U.S. Department of Transportation
Federal Highway Administration
1200 New Jersey Avenue, SE
Washington, DC 20590
202-366-4000
Stopping sight distance is defined as the distance needed for drivers to see an object on the roadway ahead and bring their vehicles to safe stop before colliding with the object. The distances are derived for various design speeds based on assumptions for driver reaction time, the braking ability of most vehicles under wet pavement conditions, and the friction provided by most pavement surfaces, assuming good tires. A roadway designed to criteria employs a horizontal and vertical alignment and a cross section that provides at least the minimum stopping sight distance through the entire facility.
Stopping sight distance is influenced by both vertical and horizontal alignment. For vertical stopping sight distance, this includes sight distance at crest vertical curves (Figure 18), headlight sight distance at sag vertical curves (Figure 17), and sight distance at undercrossings (Figure 19).
For crest vertical curves, the alignment of the roadway limits stopping sight distance (Figure 17). Sag vertical curves provide greater stopping sight distance during daylight conditions, but very short sag vertical curves will limit the effective distance of the vehicle’s headlights at night. If lighting is provided at sag vertical curves, a design to the driver comfort criteria may be adequate. The length of sag vertical curves to satisfy the comfort criteria over the typical design speed range results in minimum curve lengths of about half those based on headlight criteria.
For horizontal curves, physical obstructions can limit stopping sight distance (Figure 20). Examples include bridge piers, barrier, walls, backslopes, and vegetation.
|
|
|
|
|
|
|
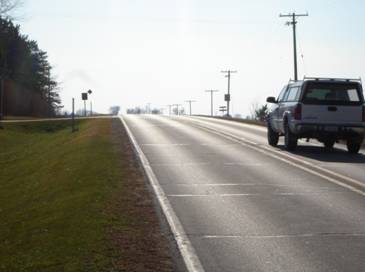
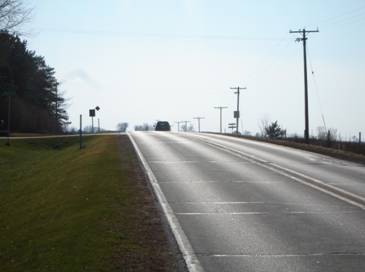
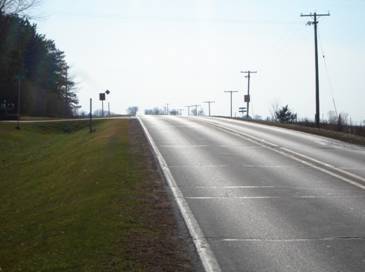
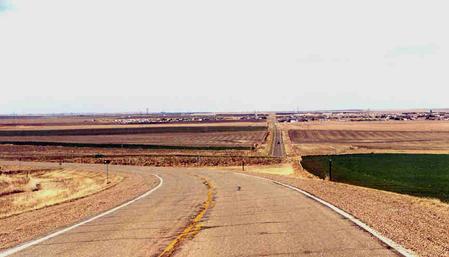
FIGURE 17 Vertical stopping sight distance at a crest vertical curve. |
Figure 17 is a series of three photos. In the top photo, a car is visible as it approaches the crest of a hill. In the second photo, the back of the car is seen descending the far side of the hill. In the third photo, the car is no longer visible.
|
|
|
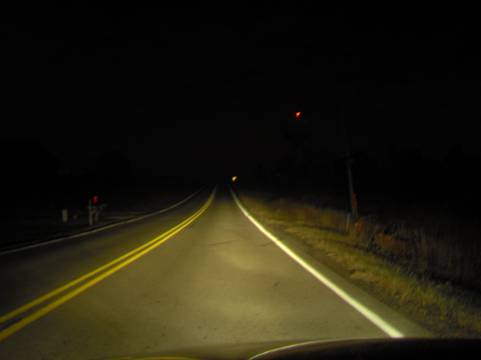
FIGURE 18 Headlight sight distance at a sag vertical curve. |
Figure 18 is a photo taken at night at a sag vertical curve that shows how much of the roadway is visible ahead via headlight illumination.
|
|
|
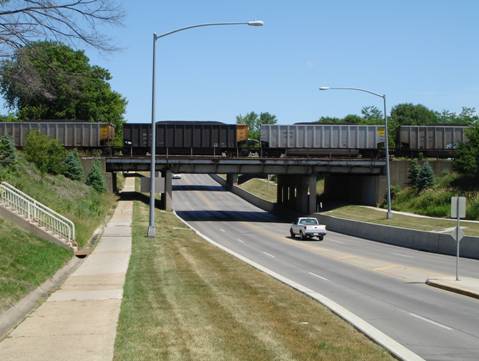
FIGURE 19 Sight distance at an undercrossing. |
Figure 19 is a photo showing a truck about to pass underneath an overhead railroad bridge and a car approaching from the opposite direction. The photo illustrates how overhead structures can affect sight lines.
|
|
|
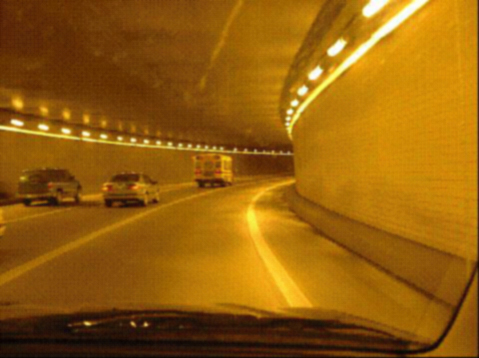
FIGURE 20 Horizontal stopping sight distance. |
Figure 20 is a photo showing vehicles traveling through a tunnel on a curved portion of road. The tunnel wall at right obscures the view ahead around the curve.
In addition to stopping sight distance, the Green Book provides design criteria for decision sight distance, passing sight distance (applies to two-lane roads only) and intersection sight distance. FHWA requires a formal design exception wherever stopping sight distance cannot be provided. Because stopping sight distance is influenced by both vertical and horizontal alignment, a design exception may be required, based on a range of geometric or roadside conditions limiting sight lines in three dimensions.
For sag vertical curves, formal design exceptions are required for curves that meet the comfort criteria but not the headlight criteria, unless lighting is provided.
The adopted criteria for stopping sight distance apply to the entire length of a highway. Clearly though, the relative risk of limited sight distance can vary significantly, based on the circumstances. A simple ‘model’ for evaluating locations with limited sight distance involves the following questions:
For example, the risk associated with a crest vertical curve with non-standard sight distance is greater at a location with intersections or driveways or other roadway features (Figure 21) within the area of the sight restriction compared with a similar location with no such features. Table 16 summarizes the relative safety risk of combining various geometric elements and other roadway features with non-standard stopping sight distance.
A stopping sight distance profile (see Figure 22) can be a useful tool for understanding location-based risk of limited stopping sight distance. The profile shows the amount of stopping sight distance at each location along the roadway, thereby illustrating the magnitude of sight distance restrictions and where they occur. This information can help designers understand the severity of a sight distance restriction, how the restriction may interact with other roadway conditions or features, and how/where to implement mitigation strategies. The IHSDM (see Chapter 1) creates stopping sight distance profiles for rural two-lane highways.
|
Relative Safety Risk of Various Conditions in Combination with Non-Standard Stopping Sight Distance |
|
|
Geometric Condition |
Relative Safety Risk |
|
Tangent horizontal alignment |
Minor |
|
Mild curvature |
|
|
Mild downgrade (<3%) |
|
|
Low-volume intersection |
Significant |
|
Intermediate curvature 1000 ft (300 m) to 2000 ft (600 m) radius |
|
|
Moderate downgrade (3–5%) |
|
|
Structure |
|
|
High volume intersection |
Major |
|
Y-diverge on road |
|
|
Sharp curvature <1000 ft (300 m) radius |
|
|
Steep downgrade (>5%) |
|
|
Narrow bridge |
|
|
Narrow pavement |
|
|
Freeway lane drop |
|
|
Exit or entrance downstream along freeway |
|
|
|
|
|
|
|
|
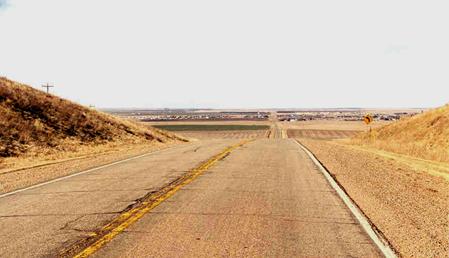
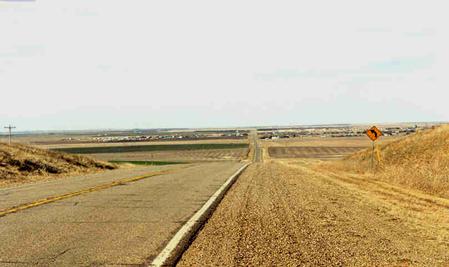
FIGURE 21 Not all locations with limited stopping sight distance are the same in terms of safety risk. In this example, the intersecting roadway in the background creates the illusion of a straight alignment and may increase the risk of run-off-road crashes. |
Figure 21 is a series of three photos. The top photo shows a rural two-lane highway with what appears to be a straight alignment. Even though a curve warning sign is present, a crest vertical curve in the road limits sight distance and creates the illusion of a straight alignment. The second photo shows the same roads farther ahead, with the illusion of a straight alignment still present. The bottom photo shows the actual curve in the road, and the lack of connection with the roadway in the background.
|
|
|
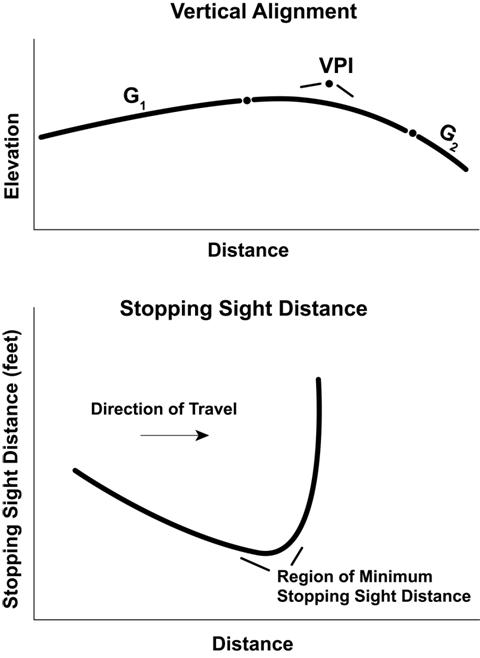
FIGURE 22 Stopping sight distance profile (Source: A Guide for Achieving Flexibility in Highway Design, AASHTO) |
Figure 22 shows two graphs. The top graph shows a roadway profile with a crest vertical curve (roadway elevation as a function of distance along the roadway). The bottom graph shows the stopping sight distance profile for the same roadway profile (stopping sight distance as a function of distance along the roadway). The stopping sight distance profile allows a designer to identify the region of minimum stopping sight distance, which is labeled on the bottom graph.
Table 17 summarizes the potential adverse impacts to safety and operations of a design exception for stopping sight distance.
|
Stopping Sight Distance: Potential Adverse Impacts to Safety and Operations |
||||
|
Safety & Operational Issues |
Freeway |
Expressway |
Rural |
Urban Arterial |
|
Collisions with vehicles stopped or slowed on the roadway |
X |
X |
X |
X |
|
Collisions with objects on the roadway |
X |
X |
X |
X |
|
Collisions with vehicles entering from intersecting roadways |
X |
X |
X | |
Freeway: high-speed, multi-lane divided highway
with interchange access only (rural or urban).
Expressway: high-speed, multi-lane divided arterial with interchange
and at-grade access (rural or urban).
Rural 2-Lane: high-speed, undivided rural highway (arterial, collector,
or local).
Urban Arterial: urban arterials with speeds 45 mi/h (70 km/h) or
less.