U.S. Department of Transportation
Federal Highway Administration
1200 New Jersey Avenue, SE
Washington, DC 20590
202-366-4000
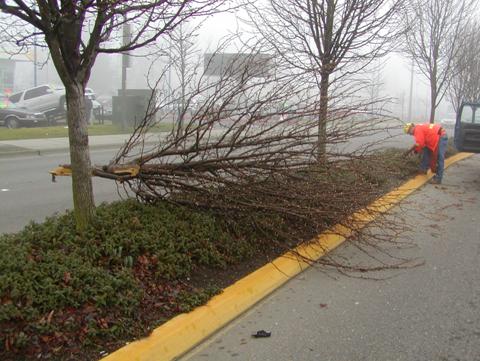
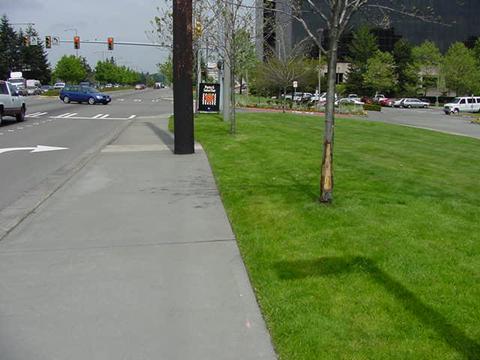
Because the proposed designs did not meet Washington DOT’s clear zone criteria, the DOT entered into the "In-Service Evaluation of Landscaped Medians Agreement" with the cities along SR 99. A key provision of the agreement stipulated that the cities participate in the data collection. The cities agreed to provide the DOT researchers with records of any median intrusions, tree strikes (Figure 105), and tree replacements related to tree health within their project areas. This part of the agreement was critical because many of the trees were small in diameter at the time of data collection. City maintenance personnel could provide information on impacts with small trees that broke off and where the crash severity was low enough that drivers left the scene without a crash report being filed (Figure 106). Another key provision was a commitment to implement mitigation measures—up to and including tree removal—if warranted by the incoming crash information. The goal would be to implement other mitigation strategies first, if possible, before asking the cities to remove trees.
Results of the in-service evaluation will also be used to evaluate the Department’s urban design criteria and make modifications, if appropriate.
The data collected for the in-service evaluation are summarized in Table 24. Crash records were collected for 3 years before the reconstruction project and for 3 years after construction. Because of the rare and random nature of crashes, short before-and-after studies are often ineffective. The longer the collection period, the higher the probability that the data are truly measuring the results attributable to the changes in the before–and–after conditions and not just the random variation in crashes from year to year. Although an even longer collection period would further increase this probability, 3 years was selected as a reasonable and practical time frame for this study.
|
|
|
FIGURE 105 Impact with tree in median (SeaTac). |
Figure 105 is a photo showing a tree broken off at the trunk after being struck by a vehicle. The tree is in the landscaped median and a maintenance worker is cleaning up debris.
|
|
|
FIGURE 106 Information from City maintenance personnel provided data on tree impacts that were not reported. Because many of the trees were still small in diameter, this information was critical to developing an understanding of the impact on safety as the trees mature (SeaTac). |
Figure 106 is a photo showing a small-diameter tree with a small amount of bark missing as a result of an impact.
The evaluation is currently ongoing and the analysis consists of two parts. The first is a before–and–after comparison—identification of significant changes in safety performance before and after construction and comparison to similar facilities statewide. The second phase of the study is development of statistical models designed to explain the factors that contribute to the frequency or severity of crashes in the area.
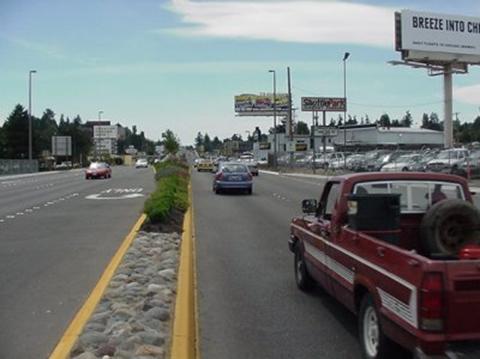
Several designs were used by the various communities, particularly for the median, which will provide control sections and an informative comparison. For example, sections of SR 99 within Kent did not include trees in the median. SeaTac and Shoreline used trees within raised medians of varying widths. Des Moines used a low-profile barrier along the sections that had trees in the median (see the following section for more information).
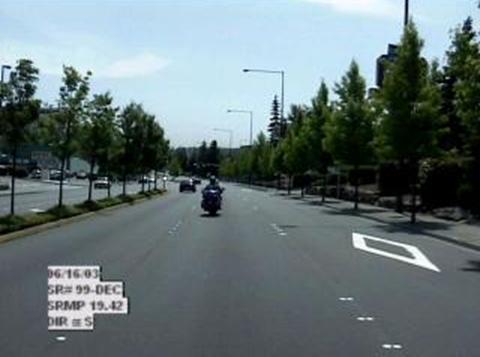
SeaTac was the first city in which the in-service evaluation was conducted. The crash records and maintenance reports indicated that a high percentage of tree hits were occurring where the median narrowed adjacent to left-turn lanes. As a result, trees were not planted in these narrow-median areas near intersections in subsequent phases of the SeaTac reconstruction project (Figure 107).
|
Types of Before-and-After Data Collected |
|
Roadway Characteristics |
|
|
Median and Roadside Features |
|
|
Traffic characteristics |
|
|
Crash Experience |
|
|
|
|
|
|
FIGURE 107 When the in-service evaluation showed that many tree hits were occurring at the narrow-median locations adjacent to turn lanes, trees were no longer planted in these areas in subsequent project phases of the project (SeaTac). |