U.S. Department of Transportation
Federal Highway Administration
1200 New Jersey Avenue, SE
Washington, DC 20590
202-366-4000
| < Previous | Table of Contents | Next > |
As shown, rural roadways are a significant portion of the highway system in the United States. Figure 3 shows the percentage of total roadway miles functionally classified as rural for each State. Only eight States have less than 50 percent of their total roadway miles functionally classified as rural. In 27 States, more than 75 percent of the total roadway mileage is on roadways designated as rural. In fact, of the total public rural roadway mileage in the United States, 91 percent falls within the rural major collectors, rural minor collectors, or rural local roads functional classes. Jurisdiction of these roadways is shared among Federal, State and local agencies, and varies from State to State as shown in Appendix C.
In 2007 only 23 percent of the Nation's population lived in rural areas, but 57 percent of fatalities on our Nation's roadways occurred on rural roads. Table 1 shows national rural and urban fatality data for the years 2000 through 2007. As shown, traffic fatalities on rural roadways have historically exceeded those on urban roadways.
Crashes on rural roads tend to be severe as a result of the following:
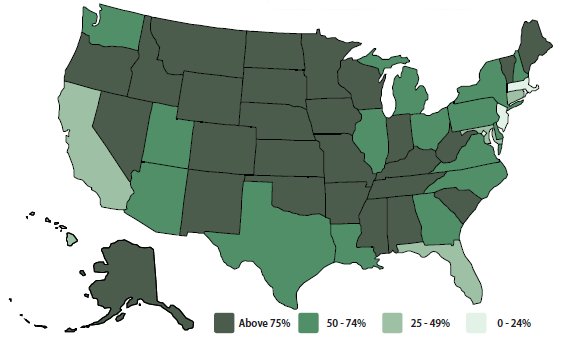
Figure 3: Percent Rural Miles of Total Roadway Miles.
Source: FHWA Highway Statistics 2007: Public Road Length 2007 Miles by Ownership
https://www.fhwa.dot.gov/policyinformation/statistics/2007/hm10.cfm
| Year | Rural Fatalities | Urban Fatalities | Total Fatalities |
|---|---|---|---|
| 2000 | 24,838 | 16,113 | 40,951 |
| 2001 | 25,150 | 16,988 | 42,138 |
| 2002 | 25,896 | 17,013 | 42,909 |
| 2003 | 24,957 | 17,783 | 42,740 |
| 2004 | 25,179 | 17,581 | 42,760 |
| 2005 | 24,587 | 18,627 | 43,214 |
| 2006 | 23,646 | 18,791 | 42,437 |
| 2007 | 22,866 | 17,497 | 40,363 |
| Source: USDOT, National Highway Traffic Safety Administration (NHTSA) – "Traffic Safety Facts" Fatality Analysis Reporting System (FARS), 2000-2007 | |||
In order to compare fatalities in urban areas to those in rural areas more accurately, it is important to factor in an exposure component. The most common exposure component used is vehicle miles traveled (VMT) on each system. On a per-mile basis, urban roads tend to carry a significantly higher number of vehicles per day than rural roads. Because of this, the levels of exposure on urban roadways are much higher than those on rural roads. As a result, fatality rate (per 100 million miles traveled) is a more appropriate measure to fairly compare these roadway types.
Figure 4 is a graphical representation of rural and urban fatality rates for the years 2000 through 2007. As indicated in the graph, the difference in the rates has remained constant over the 8 year period. Nationwide, rural fatality rates have been more than twice that of urban areas. When rural and urban fatality rates are compared, it is evident that rural roadways have an over-representation of fatalities.
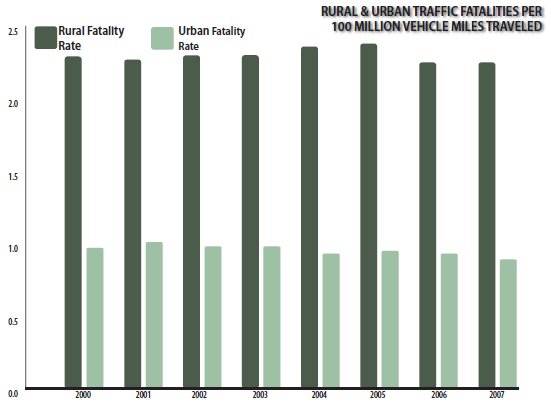
Figure 4: Rural and Urban Traffic Fatality Rates 2000-2007
Source: NHTSA Traffic Facts 2007 Data, Rural/Urban Comparison – DOT HS 810 996.
| < Previous | Table of Contents | Next > |

