U.S. Department of Transportation
Federal Highway Administration
1200 New Jersey Avenue, SE
Washington, DC 20590
202-366-4000
Best for printing: PDF Version (1.32 MB)
In this issue:
A Message from FHWA Associate Administrator for Safety, Tony Furst
FHWA Embraces "Toward Zero Deaths" Vision
Apply Now to the 2015 National Road Safety Awards!
FHWA'S EDC-3 Data-Driven Safety Analysis Initiative Sparks Strong State Interest
The Systemic Approach to Safety Uses Risk to Reap Safety Rewards
New RDE Methodology Will Support a Broad Range of Agency Activities
FHWA Promotes "Good "GIS Practices" at GIS-T Symposium
FHWA Issues New Publications Illustrating Proven Countermeasures for Intersection Safety
FHWA Spotlights Noteworthy Practices for Preserving Elderly Mobility
Accelerating Safety Activities Program (ASAP) Makes a Larger Impact in FY15
RSDP Toolbox: A Clearinghouse for Safety Data and Analysis Tools
NEW! Work Zone Safety Application Suite Now Available!
Road Diet Desk Reference Shows How Smaller Streets Can Mean a Bigger Safety Advantage
Interactive Highway Safety Design Model (IHSDM) Update Available
Demonstration Project Links Speed Feedback Signs to Fewer Roadway Departures on Curves
High Friction Surface Treatment Demo Helps County Roads "Get a Grip"
Alive at 25: KY Program Cuts Young Driver Fatalities by Half
Tennessee Uses Predictive Analytics to Tackle DUI, Other Crashes
Kentucky Recognizes Officers for Achievements in Enforcing Impaired Driving Laws

Our vision is toward zero deaths on the Nation's highways, and our mission is exercising leadership throughout the highway community to make the Nation's roadways safer.
Key to these efforts are robust safety data systems and analysis capabilities that enable a data-driven, strategic approach to improving highway safety on all public roads. We support and provide a broad range of technical assistance, training, and resources that help advance this powerful combination.
We've just kicked off a new Every Day Counts, Round 3, initiative on Data Driven Safety Analysis (article on page 4) which promotes broader implementation of predictive and systemic analysis approaches in not only safety management processes but also all project development decision making. We're pleased that 30 States have taken advantage of this opportunity to advance their implementation of these approaches.
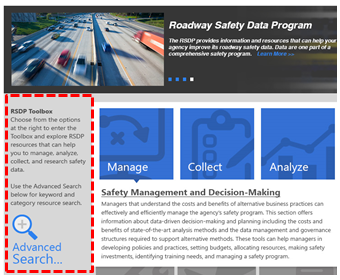
This issue of Safety Compass features several products and services of our Roadway Safety Data Program. That program is designed to help State and local agencies improve their safety data systems and expand their analysis and evaluation capabilities.
If we can assist you in implementing this "Combination of the Two" (with a nod to Janis Joplin) – data systems and/or analysis capabilities – please don't hesitate to let us know.
For more on the Roadway Safety Data Program, check out http://safety.fhwa.dot.gov/rsdp, which features our new Roadway Safety Data and Analysis Toolbox (article on page 12).
By: Robert Ritter, FHWA Office of Safety
AASHTO and a group of safety associations officially rolled out the National Strategy on Highway Safety, called Toward Zero Deaths (TZD), in March of this year. The TZD plan, created by a steering committee cooperative that includes numerous organizations representing our Nation's highway safety system, provides engineering, enforcement, education and emergency medical services (EMS) organizations with initiatives, or safety countermeasures, that can be enacted by public agencies, businesses, and individuals.
In general, the TZD vision is based on the belief that even one death on our transportation system is unacceptable. It is a way of clearly and succinctly describing how an organization, or an individual, is going to approach safety–that even one death is too many. This "zero deaths" idea was first adopted in Sweden in 1997 as "Vision Zero" and since then has evolved across the country and across the world. A growing number of States and cities have adopted "Zero" fatality visions, but the steering committee saw a need for a single, national vision for highway safety.
"We embrace the vision of Toward Zero Deaths; it provides an overarching and common vision that drives and focuses our efforts to achieve our shared goal to eliminate injuries and fatalities on our roadways," said U.S. Transportation Secretary Anthony Foxx, in the press release on the National Strategy. "Setting the bar for safety to the highest possible standard requires commitment from everyone—from drivers to industry, safety organizations, and government at all levels. The U.S. Department of Transportation will do our part by aggressively using all tools at our disposal—research into new safety systems and technologies, campaigns to educate the public, investments in infrastructure, and collaboration with all of our government partners to support strong laws and data-driven approaches to improve safety."
FHWA Deputy Administrator Gregory Nadeau also sent a special safety message to all FHWA employees to highlight the TZD vision and encourage all employees to build on the work FHWA already does.
The TZD National Strategy includes initiatives that are known to be—or are expected to be—effective in addressing specific factors contributing to crashes, that have the potential to make a significant reduction in fatalities and serious injuries nationally, or that address areas of growing concern.
The plan includes initiatives from engineering to education, all with the intended result of achieving:
As Steve Keppler, Executive Director of the Commercial Vehicle Safety Alliance (CVSA) stated in the release announcing the launch of TZD, "Crashes are influenced by many factors. To reach our goal of zero, solutions must come from multiple angles, which is why the TZD plan addresses the vehicles, the road, and the driver."
TZD uses a data-driven, interdisciplinary approach that FHWA has been promoting for many years. The TZD approach targets areas for improvement and employs proven countermeasures, integrating application of the "4Es" of transportation safety (i.e., education, enforcement, engineering, and emergency medical services). A combination of strategies from different focus areas will be necessary to achieve the TZD vision.
Within FHWA, the Office of Safety, Office of Safety Research and Development, and the Resource Center Safety and Design Technical Services Team jointly established a Safety Strategic Plan to focus on a common safety vision. The vision–toward zero deaths and serious injuries on the Nation's roadways–is being realized through annual performance objectives in each of the three safety units.
FHWA administers the Highway Safety Improvement Program (HSIP) with the goal of achieving a significant reduction in traffic fatalities and serious injuries on all public roads. The HSIP requires that each State develop a Strategic Highway Safety Plan (SHSP). The SHSP is a data-driven, multi-year safety plan developed through statewide coordination that provides a comprehensive framework for reducing highway fatalities and serious injuries on all public roads. An SHSP identifies a State's key safety needs and guides investment decisions towards strategies and countermeasures with the most potential to save lives and prevent injuries. The collaborative process for developing and implementing an SHSP brings together, and draws on, the strengths and resources of all safety partners, and will play a pivotal role in achieving the zero deaths vision.
The TZD effort is led by a group of associations representing State and local government agencies working to reduce highway fatalities:
The FHWA, Federal Motor Carrier Safety Administration, and National Highway Traffic Safety Administration have provided technical support to the TZD steering committee's efforts. For more than 5 years, these associations have been working together to identify and prioritize the leading initiatives that will reduce traffic fatalities over the next 25 years.
For more information about the Toward Zero Deaths National Strategy on Highway Safety, visit TowardZeroDeaths.org.
[ Return to list of contents.]

WHAT?
FHWA and its safety partner, the Roadway Safety Foundation (RSF), are accepting applications for the 2015 National Roadway Safety Awards through May 15, 2015. These biennial awards recognize roadway safety achievements in infrastructure, operational, and program-related improvements.
HOW?
Nominated projects and programs are judged based on their effectiveness, innovation, and efficient use of resources.
WHO?
Eligible applicants include State, local, and tribal governments as well as planning organizations, regional councils, Local Technical Assistance Programs (LTAPs), Tribal Technical Assistance Programs (TTAPs), and universities. The program is available to U.S. nominees only, including U.S. territories and funded operations such as the District of Columbia, Puerto Rico, Guam, and the Mariana Islands.
"Apply! This is a great opportunity to share highway safety. Every life counts. The application process takes a bit of work, but it is definitely worth it. The recognition our agency received was fantastic. Not to mention the time I spent in Washington, DC and getting to know all the other award winners!" — Brent Jennings, Highway Safety Manager Idaho Transportation Department
Additional details, instructions, and application packets are available at http://safety.fhwa.dot.gov/roadwaysafetyawards/ or www.roadwaysafety.org. Act fast! Nominations are due by May 15, 2015!
[ Return to list of contents.]
By: Jerry Roche, FHWA Office of Safety
 Today, there are methods to answer a question that has plagued transportation safety professionals for years: "How many crashes on a roadway are too many crashes?" With limited funding available to address transportation needs, professionals are constantly faced with making decisions to maximize the return on investment. Just reviewing a roadway in terms of generally accepted guidelines is not sufficient. Decision makers need to be able to determine if a roadway will perform satisfactorily in terms of crashes – both now and into the future.
Recent advances in highway safety analysis can provide more reliable information for effective investment decisions on the Nation's highway system. A new initiative entitled "Data-Driven Safety Analysis" (DDSA) was created under the third round of FHWA's Every Day Counts (EDC) effort. The purpose of EDC is to encourage the rapid deployment of existing, proven technologies to shorten project delivery, enhance roadway safety, and improve environmental stability. The objective of this DDSA initiative is to incorporate safety performance into all highway investment decisions by broadening implementation of predictive and systemic safety analysis.
Informed Decision Making: By quantifying the safety impacts associated with roadway planning and design, transportation professionals, elected officials, and the general public can make more informed decisions by weighing safety with other project goals.
Optimizing Investment: With limited resources, agencies need to maximize the safety benefit of every transportation investment. By applying the most current analytical methods, agencies have powerful tools to optimize investments and the safety of all users.
Improved Safety: States and other transportation agencies can proactively apply safety countermeasures at roadway locations identified as having the highest potential for improvement, effectively reducing fatalities and serious injuries.
Predictive analysis approaches combine crash, roadway inventory, and traffic volume data to provide reliable estimates of an existing or proposed roadway's expected safety performance. Before predictive methods were developed, agencies had no way to quantify the anticipated safety impacts of transportation decisions. This made it hard for safety to be fairly considered when safety benefits were being evaluated alongside other, more easily quantified criteria such as environmental and operational impacts. It was also a challenge to evaluate and compare projects of various types (resurfacing, safety, etc.) to determine which ones had the greatest potential to reduce fatal and serious injury crashes. Documentation justifying design decisions was often difficult to develop in the absence of predicted safety performance. In 2010, the publication of the AASHTO Highway Safety Manual provided a go-to source of crash prediction models for segments and intersections on two-lane rural roads, rural multilane highways, and urban and suburban arterials. This was a major advance, but still did not address two important locations: freeways and interchanges. State DOTs needed models for these facilities, which typically require the greatest amount of time and resources to design. As a result, in 2014, models for freeways, interchanges, and ramps were added to the set of prediction models and software tools. This means that rather than relying on subjective measures, we now have a comprehensive toolbox of evidence-based models to predict safety performance in terms of crash frequency and severity.
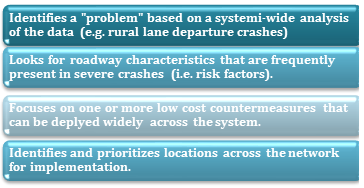
Systemic analysis approaches employ system-wide screening of a roadway network based on the presence of high-risk roadway features associated with particular severe crash types. Before the advent of systemic approaches, agencies largely relied on simple "hot spot" site analysis, focusing their resources on improving only those locations with the highest crash frequencies. While high-crash locations do exist, focusing only on these sites often led agencies to make high-cost improvements at a limited number of locations. In some jurisdictions, locations that were identified as safety concerns may have had to wait for a number of severe crashes to happen before they could be addressed. Similarly, occurrences of severe crashes that appeared to be scattered across the network could be viewed as random in nature and were sometimes left untreated. This hot spot approach could also lead a State to fund only projects on high-volume roads, and often only those on the State-owned system. Now, however, the systemic approach provides an opportunity to objectively reduce severe crash risk and improve safety performance across the road networks. Treating a larger, targeted portion of the system with cost-effective improvements helps States significantly reduce severe crashes on all their public roads and achieve their fatality and serious injury reduction goals.
Under the banner of EDC-3, 30 States are looking to advance their implementation of predictive and systemic approaches, with the number of States using them as standard practice expected to nearly triple over the next 2 years (from 12 to 35). Although the DDSA Implementation Plan was just approved in March, several activities are already underway.

Several DDSA activities are already underway, including development and delivery of:
The systemic safety analysis approach will be highlighted in the June 25th EDC Exchange for Local and Tribal Agencies.
Please look for DDSA information in sessions and exhibit halls at these upcoming conferences:
| ITE Annual Meeting | Hollywood, FL | August 2-5, 2015 |
|---|---|---|
| AASHTO Subcommittee on Design | Seattle, WA | September 20-24, 2015 |
| ASCE Convention | New York, NY | October 11-14, 2015 |
| Traffic Records Forum | Costa Mesa, CA | October 25-28, 2015 |
If your State agency is interested in further integrating safety performance into highway investment decisions and would like assistance, please contact Jerry Roche, Office of Safety Data and Analysis Tools Team, 515-233-7323, Jerry.Roche@dot.gov or John McFadden, FHWA Resource Center, Safety and Design Technical Service Team, 410-962-0982, John.McFadden@dot.gov.
[ Return to list of contents.]
By: Karen Scurry, FHWA Office of Safety and Pam Beer, Cambridge Systematics, Inc.
Systemic safety improvements are widely implemented and based on high-risk roadway features that are correlated with particular severe crash types. Many State and local agencies use this approach because it is a cost-effective and proactive approach to improving safety on all public roads in a State.
The systemic approach complements the site analysis approach (i.e., focusing on high-crash or "hot spot" locations) because it addresses crashes that are more widely distributed on the system. For example, a systemic safety analysis can be conducted on rural and local roadways or in urban areas. It can also be used to study specific crash types, such as pedestrian and bicycle crashes. A comprehensive roadway safety management program will include both systemic and site analysis approaches.
To help States and local agencies implement the systemic approach to safety, the Federal Highway Administration (FHWA) has developed many tools and resources for state and local agencies, including:
The Systemic Safety Project Selection Tool includes a step-by-step process for conducting systemic safety analyses, analytical techniques for determining a reasonable balance between the implementation of spot safety improvements and systemic safety improvements, and a mechanism for quantifying the benefits of safety improvements implemented through a systemic approach.
The tool is flexible, easy to use, and accommodates whatever data an agency has available. It can be applied to a variety of systems, locations, and crash types. It also promotes a process that can be incorporated into existing safety management efforts. Since the systemic safety process is based on risk rather than location, the tool helps agencies identify characteristics to support system-wide risk assessments.
Systemic safety training demonstrates how a combined approach of hot spot and systemic analyses can achieve greater reductions in fatalities and serious injuries than either method alone. The training is designed to benefit executives and practitioners at State DOTs, local transportation agencies, and tribal agencies. It provides hands-on expertise that enables users to quickly implement the program.
There are two types of training, which FHWA offers by request.
Selecting the right type of training to meet an agency's needs depends in part on the recipients. For example, the DOT chief engineer or head of planning, a mayor, or tribal chairman may benefit from the one-hour overview training. The four-hour workshop will be useful for safety engineers, planning offices, DOT districts, county engineers, public works directors, and tribal engineers and planners.
Washington State has successfully used this four-hour training to educate local agencies on the systemic approach to safety in preparation for a Highway Safety Improvement Program (HSIP) solicitation. The Washington State LTAP Center, in cooperation with FHWA, provided training on the Systemic Safety Project Selection Tool in 2014. This training was provided primarily to counties in order to complete their HSIP grant applications, which required submitting a local road safety plan as part of the application process. This training provided additional ideas, insights, and directions that could be incorporated into those local road safety plans. "Ultimately, 30 counties (out of 39) successfully developed a local road safety plan and received HSIP funding to make systemic safety improvements to their roadway networks," said Matthew Enders from the Washington State Department of Transportation (WSDOT)." This training provided a direct benefit to multiple counties that successfully applied for these funds."
FHWA also offers technical assistance to help agencies use the Systemic Safety Project Selection Tool. This technical assistance includes guidance for:
Technical assistance is available in person, where FHWA staff or an approved subject matter expert provides over-the-shoulder analysis support during the application of a systemic safety analysis by an agency. It is also available through on-call telephone support. Help is available in response to a stand-alone request and can be offered as a follow-up to the four-hour hands on workshop where the instructor can guide an agency through the systemic safety analysis process.
FHWA also identifies and shares noteworthy practices and lessons learned related to the systemic approach to safety. For example, Thurston County, Washington, used a proactive, data-driven approach to identify curves for improvement before a severe crash could occur rather than reacting after an incident has occurred. Missouri used the systemic analysis to expand and improve roadway visibility features, expand the installation and maintenance of shoulders, remove or shield fixed objects, and improve curve recognition–all of which helped achieve a 46 percent reduction in lane departure fatalities statewide.
Peer-to-peer assistance offers valuable insights and lessons learned through peers who detail their own experience implementing the systemic approach. Peers can address questions and concerns about adopting this approach and provide specific information on how it benefited their agency.
FHWA is hosting a series of systemic safety webinars throughout 2015. The purpose of the webinar series is to continue the dialogue from the 2014 Systemic Safety Implementation Peer Exchanges and share information to advance systemic safety implementation efforts across the country. Participants will hear how State and local agencies have engaged partners, used analysis tools, and applied countermeasures to advance implementation of systemic safety efforts across the Nation. Upcoming webinar topics include:
June 8, 2015 (1:00 – 3:00 PM ET): Using the Right Tools for Systemic Safety Analysis Learn about data analysis tools and approaches agencies are using to conduct systemic safety analysis. Register at: https://collaboration.fhwa. dot.gov/dot/fhwa/WC/Lists/Seminars/DispForm.aspx?ID=556
September 29, 2015 (1:00 – 3:00 PM ET): Selecting the Right Systemic Safety Treatments Learn about systemic safety treatments implemented by State and local agencies. Register at: https://collaboration.fhwa.dot.gov/dot/fhwa/WC/Lists/Seminars/DispForm.aspx?ID=571
November 2015 (Date TBD): Advancing Systemic Safety Implementation Efforts Learn how agencies are using innovative implementation and evaluation approaches to advance systemic safety efforts.
Find out how this new approach to traffic safety is making a real difference on our Nation's roads and highways! The Systemic Approach to Safety web site at http://safety.fhwa.dot.gov/systemic/index.htm is your one-stop shop for everything related to the systemic approach to safety. You can download the Systemic Safety Project Selection Tool, review case studies and noteworthy practices, and learn more about the upcoming webinars. You can also access the systemic training and technical assistance application and 2014 Systemic Safety Implementation Peer Exchange Reports. For further information, contact Karen Scurry, FHWA, Office of Safety, karen.scurry@dot.gov, 609-637-4207.
[ Return to list of contents.]
By Robert Pollack, FHWA Office of Safety
The FHWA Office of Safety is developing the Roadway Data Extraction Technical Assistance Program (RDETAP) as part of its Roadway Safety Data Program. This program is intended to provide technical assistance to State and local agencies to identify, extract, and maintain roadway data needed to conduct an effective safety program and to support other disciplines such as asset management, planning and maintenance. The RDETAP is an extension of work initiated under the Model Inventory of Roadway Elements – Management Information System (MIRE-MIS) project conducted in 2012-2013. The MIRE-MIS project developed data identification/extraction tools that assisted the development of an intersection inventory in two test States. The current RDETAP effort is seeking to modify one of the tools developed under the MIRE-MIS project into a more "generic" version that can be more easily adapted to work with data systems in other States.
MAP-21 specifies that safety analyses be conducted on all public roads. The safety data (e.g., crash, roadway and traffic data) maintained in a State from all public roads should be linkable by geolocation and available for problem identification and evaluation. However, statewide roadway safety databases do not exist in many States because the required data are collected by multiple public agencies, such as DOTs, MPOs, and cities, and are stored in multiple databases. As a result, the MAP-21-generated safety requirements necessitate cooperation and coordination between State, local, and other jurisdictions in developing or incorporating the data needed to conduct analyses on a system-wide basis. The current effort is intended to assist State and local agencies to identify and reformat roadway data that may exist in diverse databases or to identify and input data from existing data sources, such as State roadway photo logs, through automated tools and interfaces.
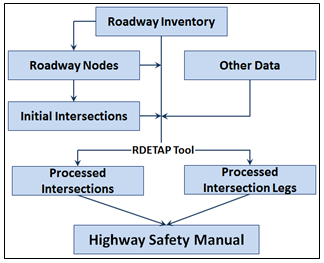
The RDETAP tool (currently being modified from the version used in the MIRE-MIS project) processes roadway inventory data from multiple sources in an ESRI ArcGIS environment and attaches non-spatial attribute data (e.g., AADT and roadway width) to spatial roadway elements (e.g., intersection points and intersection legs). The data is stored in a geodatabase and can be exported in a variety of desired formats to support safety analysis, such as techniques identified in AASHTO's Highway Safety Manual. The tool is being pilot tested in two States, where it will be modified to work with each test State's data files and data storage structure.
This pilot effort is being conducted, in part, to assist in developing a Programmer's Guide and a User's Guide that can be used to promote this tool to other States once the pilot test is completed.
As part of the pilot test program, the project team also intends to work with selected local agencies (e.g. cities, counties) to try to make their data compatible with the roadway data in the State system, thus allowing the local data to be integrated with the State system. The work with local agencies will not commence until the data extraction tool has been adapted to and is functioning on the State's database system.
One of the benefits to State and local agencies is expected to be the development of an expanded roadway and traffic inventory database. This expanded database will allow the use of more advanced analytic tools to eliminate some of the shortcomings of just using crash frequencies or rates to determine the severity and extent of safety problems. In addition to safety program benefits, an expanded roadway inventory database can also assist participating jurisdictions with asset management, maintenance, operations, and planning activities.
Pending the successful completion of the pilot tests, FHWA anticipates making the RDETAP available to other states.
To learn more about this project, please contact Robert Pollack, 202-366-5019 or at robert.pollack@dot.gov.
[ Return to list of contents.]
By Esther Strawder, Office of Safety
The annual Geospatial Information Systems for Transportation (GIS-T) Symposium, sponsored by the American Association of State Highway Transportation Officials (AASHTO), was held April 19-22 in Des Moines, Iowa. This year's meeting offered keynote speakers, discussion forums, workshops, presentations, and a technology hall where exhibitors showcased their services. Organizations and individuals with information related to GIS in transportation shared their experience with the nearly 300 participants in attendance. The FHWA Office of Safety was also on hand to offer a technical workshop exploring ways to advance GIS-based efforts to support traffic safety programs through good practices, development of case studies, and, eventually, technical support. KLS Engineering, LLC and the University of Kentucky are assisting FHWA in this ongoing effort.
FHWA is working to develop case studies promoting "good GIS practices" in support of road safety programs to share with State and local transportation agencies that may be interested in advancing their own GIS practice in this area. If you have or know of any programs or unique GIS processes or practices for advancing highway safety, please contact Esther Strawder at esther.strawder@dot.gov or Robert Pollack at robert.pollack@dot.gov.
[ Return to list of contents.]
By: Jeffrey B. Shaw, P.E., FHWA Office of Safety
The FHWA Office of Safety – Intersections Program is pleased to announce two new publications that support our Proven Safety Countermeasures (http://safety.fhwa.dot.gov/provencountermeasures/) campaign. These new resources support two of the Intersections countermeasures: Backplates with Retroreflective Borders (http://safety.fhwa.dot.gov/provencountermeasures/fhwa_sa_12_007.cfm) and Corridor Access Management (http://safety.fhwa.dot.gov/provencountermeasures/fhwa_sa_12_006.cfm). With a target audience that consists of technical professionals from State and local agencies, these technical summary documents describe the effectiveness of each countermeasure, outline the respective "state of the practice," and highlight experiences from agencies across the United States. Additionally, a shorter, companion Executive Summary for each topic is also available to help promote the benefits of these important safety elements to non-technical audiences and stakeholders.Traffic signal backplates—thin plates of material that surround traffic signal indication light arrays—are intended to improve the visibility of the signal by providing a consistent and controlled-contrast background. Attempts to further enhance the visibility and conspicuity of traffic signals, particularly during nighttime hours, have led to the addition of narrow strips of retroreflective tape or sheeting around the border of the backplates (see photo below). This combination of backplates with retroreflective borders frames the signal head and provides visual enhancement to the signal indication during both daytime and nighttime conditions.
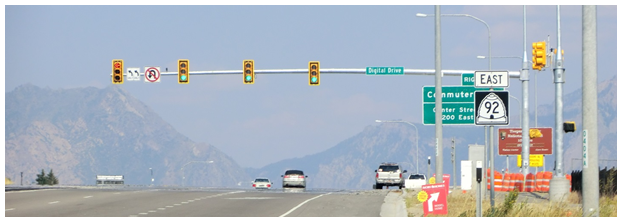
By framing the signal, retroreflective borders also enhance the visibility of traffic signals for both aging and color-vision impaired drivers, enabling them to more easily identify which signal indication is illuminated. Retroreflective borders may also alert drivers to the presence of an intersection during periods of power outages at night, when the signals would otherwise be dark and non-reflective signal heads and backplates would not be visible. The very low cost of implementation—typically only a few hundred dollars per intersection—and the associated 15 percent reduction in crashes at treated intersections has led many State and local transportation agencies to make this a standard practice when modernizing existing or constructing new signalized intersections.
Learn more about this Proven Safety Countermeasure and implementers' experiences in Kentucky, New Hampshire, Virginia and Washington State in Proven Safety Countermeasures Technical Summary: Backplates with Retroreflective Borders at http://safety.fhwa.dot.gov/intersection/blackplates/blackplate_tech/
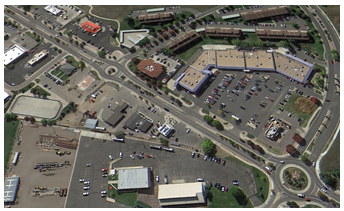
Corridor Access Management (CAM) is a strategy that seeks an appropriate balance between the safety and mobility of a roadway facility with the access needs of adjacent land uses. While managing access at a single location may help improve safety and operations within an immediate vicinity, CAM has been shown to improve safety, mobility, accessibility, and even business profitability along an entire stretch of roadway because it favorably impacts ALL properties along that corridor.
CAM preserves the flow of people and freight and enables safe access to businesses and neighborhoods using a combination of policies and strategies such as closing, consolidating, or improving driveways, median openings, and intersections; adding or redesigning medians; and planning the spacing of intersections, median openings, and driveways.
Studies conducted by State and local agencies, national organizations, and transportation trade associations consistently show that corridor access management notably improves traffic flow and safety for travelers. In addition, strong evidence shows that CAM can ultimately improve the success of businesses in many cases.
To review or download Proven Safety Countermeasures Technical Summary: Corridor Access Management, please visit http://safety.fhwa.dot.gov/intersection/am/cam_tech/
For more information on the FHWA Intersections program, visit http://safety.fhwa.dot.gov/intersection/ or contact Jeff Shaw at Jeffrey.Shaw@dot.gov.
[ Return to list of contents.]
By: Rebecca Crowe, Office of Safety

Reflecting its increasing focus on promoting the safety of all road users, the FHWA has made available the new North American Conference on Elderly Mobility – Noteworthy Practices Guide. The guide showcases 22 national and international noteworthy practices that have improved elderly mobility in locations from New Zealand to New York City, from Florida to North Dakota. FHWA recog-nizes that, as our population ages, it is increasingly important that we account for the safety and needs of older adults and people with disabilities in our transportation system. Keeping our aging population mobile is important for maintaining independence and quality of life. We must also be mindful that older adults are especially vulnerable to injury and death in crashes.
The new guide is based on presentations from the North American Conference on Elderly Mobility (NACEM) held in Detroit, Michigan in May 2014. For example:
These are just a few of the many examples of successful and innovative practices and programs in use throughout the country. The North American Conference on Elderly Mobility – Noteworthy Practices Guide can be accessed at http://safety.fhwa.dot.gov/older_users/noteworthy/. For more information on the FHWA Older Road Users program or other resources, please contact Rebecca Crowe at rebecca.crowe@dot.gov
[ Return to list of contents.]
By: Esther Strawder, FHWA Office of Safety and Mark Sandifer, FHWA Technology Partnership Programs
In FY 15, the Accelerating Safety Activities Program (ASAP) has the opportunity to make a bigger impact on the Focused Approach States than in previous years due to a significant increase in funding. In March of this year, the Office of Safety awarded ASAP funding totaling $157,659.00 to 15 projects from 12 States. A total of 27 projects were submitted from 15 Focused Approach States. Projects were evaluated by a panel of subject matter experts and ranked on their merit. The recipient States also funded at least 20 percent of their projects' value, pushing the total value of the funded projects to more than $380,000.
ASAP is administered through a partnership between the Office of Safety and the Technology Partnership Programs. Through ASAP, FHWA staff work with Local Technical Assistance Programs (LTAPs) and Tribal Technical Assistance Programs (TTAPs) to further the goal of promoting safety innovation through training, outreach, and education. ASAP supports partnerships among the LTAP/TTAP Centers, State DOTs, local government agencies, and professional organizations to assist the 23 Focus Approach States in improving safety in three program focus areas: roadway departures, pedestrian safety, and intersection safety. ASAP funds are currently available to the 23 States that are eligible to participate in the Focused Approach to Safety.
2015 marks the tenth consecutive year of project awards through ASAP and the third year of partnering with the LTAP/TTAP Centers to implement innovation in safety. More than $1.35 million dollars have been invested to date.
For more information on the ASAP program, please contact Esther Strawder at esther.strawder@dot.gov or Mark Sandifer at mark.sandifer@dot.gov.
[ Return to list of contents.]
By: Stuart Thompson, FHWA Office of Safety, and Frank Gross, Vanasse Hangen Brustlin, Inc.
The last two decades have brought significant advancements in data-driven decision-making, including the development and refinement of numerous safety data and analysis tools. While these new tools support data-driven decision-making, the identification and selection of an appropriate tool can be a daunting task, particularly for those new to quantitative safety analysis.
In response, the FHWA Roadway Safety Data Program (RSDP) team developed a web-based Toolbox that acts as a clearinghouse for roadway safety data and analysis tools. The Toolbox fulfills the need for a centralized source of information about the available safety data and analysis tools. The web-based, user-guided interface helps users identify the appropriate tool based on self-identified needs, capabilities, and resources.
The Toolbox is designed to be useful to all technical roadway safety stakeholders in both the public and private sectors. This includes those groups or individuals involved in the project development process (planning to design) as well as those responsible for the operation and maintenance of constructed facilities. The toolbox supports activities including data management, data analysis, data collection, and research. Detailed information is provided on each of the tools, presenting the information at a level that is easily understandable. The Toolbox also provides users the ability to identify which tools can be implemented with current data capabilities and determine what data improvements might be needed to employ more advanced tools.
Want to have an impact on how the RSDP Toolbox works? Try it out!
FHWA welcomes our stakeholders to take the Toolbox for a "test drive"! The main page of the tool gives you options to share your own tools, identify gaps or additional needs, and provide general feedback. So take her for a spin, and let us know what you think!
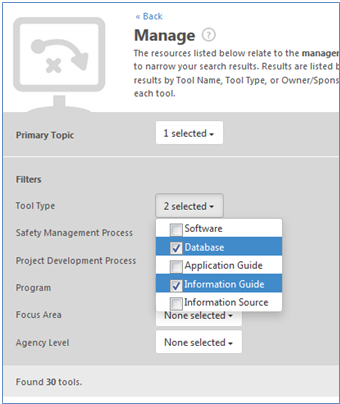
http://projects.vhb.com/fhwatoolbox/toolbox-home.aspxState and local agency staff and their contractors will find the Toolbox useful for identifying appropriate tools based on their needs and capabilities. Users have the option to explore a list of all relevant tools based on four primary actions (i.e., manage, analyze, collect, and research) or they can use the advanced search function to identify a tool to support a specific need. In either case, users can use drop-down menus to apply filters (see screen capture, right) to refine the list of tools to those that are appropriate for their needs, data, system maturity (e.g., basic or advanced), and other factors related to the tools. Other selection factors include:
While developing the toolbox, FHWA conducted a gap analysis and developed a prioritized list of the data and analysis tools needed to support the data-driven decision-making process. The top three tools, currently under development, are as follows:
These and other helpful tools can be found at http://safety.fhwa.dot.gov/rsdp/, and don't forget to visit the RSDP Toolbox at http://projects.vhb.com/fhwatoolbox/toolbox-home.aspx. For more information on the Roadway Safety Data Program (RSDP), contact Stuart Thompson at stuart.thompson@dot.gov.
[ Return to list of contents.]
By: Martha C. Kapitanov, Office of Operations
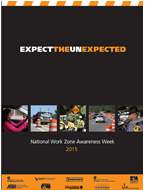 March 23-27, 2015 marked the 15th National Work Zone Awareness Week (NWZAW), with kick-off events taking place on March 24th in Arlington, Virginia. For this landmark occasion, FHWA joined representatives from the American Traffic Safety Services Association (ATSSA), the American Association of State Highway and Transportation Officials (AASHTO), Federal Motor Carrier Safety Administration (FMCSA), American Road & Transportation Builders Association (ARTBA), Associated General Contractors (AGC), Virginia Department of Transportation (VDOT), Maryland State Highway Administration (MDSHA), District Department of Transportation (DDOT), and other stakeholders to raise public awareness of the importance of work zone safety.
The 2015 NWZAW theme "Expect the Unexpected" is the same that was used in 2000, when this annual event first took place. The NWZAW Committee decided that this comprehensive theme showcases the importance of being aware while working, driving, and walking in and around a work zone. The theme conveys the important message that motorists should be prepared for changes in speed limits, lane merges or shifts, construction vehicles entering the highway, detours, flaggers, workers near the road, queues, and other potentially unexpected changes that may occur at any time in a work zone.
Work zone safety remains an important focus in FHWA's efforts to move the Nation toward zero deaths. In 2013, the most recent year for which we have data, there were 579 fatalities in work zones, with 81 percent of fatalities occurring among motorists and their occupants and 19 percent being among non-motorized users such as pedestrians, bicyclists, and construction workers. According to data from the Fatality Analysis Recording System (FARS), 2013 saw a 6 percent decrease in fatalities from 2012, when 617 people died in work zone-related incidents. But because even one work zone fatality is too many, there is still much work to be done.
For more information regarding work zone management training, regulations, resources and tools visit the FHWA Work Zone Management website at https://www.fhwa.dot.gov/workzones and the National Work Zone Safety Information Clearinghouse at http://www.workzonesafety.org
Did You Know?
The FHWA Every Day Counts (EDC-3) Smarter Work Zones initiative is one of the many FHWA commitments to establishing safer, more efficient work zones. The EDC-3 Smarter Work Zones effort focuses on road project coordination and technology applications, especially queue management and speed management. More information on this initiative can be found at https://www.fhwa.dot.gov/everydaycounts/edc-3/zones.cfm
[ Return to list of contents.]

Developed under the FHWA Work Zone Safety Grant for use on both iOS and Android smart phones and tablets, this FREE app can help users:
Download these resources today!
Available on Google Play at https://play.google.com/store/apps/details?id=com.leidos.wzsa.beta.x2
Available on iTunes at https://itunes.apple.com/us/app/work-zone-safety/id968405741?mt=8
[ Return to list of contents.]
The FHWA has just released a new resource, the Road Diet Desk Reference. This handy guide provides a snapshot of what the Road Diet configuration looks like, describes how it decreases potential vehicle conflicts, explains why Road Diets are an important tool for improving safety and mobility on roadways, and gives examples of localities that have seen safety benefits from applying the Road Diet configuration.

Many localities are unaware that a Road Diet, which reduces the number of lanes in the road cross-section (e.g., turning a four-lane roadways into three-lane undivided roadway made up of two through lanes and a center two-way left-turn lane), is an important safety countermeasure, decreasing vehicle-to-vehicle conflicts that can contribute to rear-end, left-turn, and sideswipe crashes by removing undivided inside lanes from multilane roadways. In fact, studies indicate both a 19 to 47 percent reduction in overall crashes when a Road Diet is installed on a previously four-lane undivided facility as well as a decrease in crashes involving drivers under 35 and over 65 years of age.
By reducing the number of available travel lanes, the configuration offers the added benefit of allowing roadway "real estate" to be reallocated for other uses, such as bike lanes, pedestrian refuge islands, transit pullouts, and parking. This makes roadways more accessible and useful to all road users.
For more information on the Road Diet configuration, or to download a copy of the new Road Diet Desk Reference, please visit http://safety.fhwa.dot.gov/road_diets. For questions about the FHWA's Road Diet program, please contact Rebecca Crowe at rebecca.crowe@dot.gov.
[ Return to list of contents.]
By: Lincoln Cobb, FHWA Office of Safety
The FHWA Office of Safety R&D has released the Interactive Highway Safety Design Model - HSM Predictive Method 2014 Public Release Update (version 10.1.0), which can be downloaded for free at www.ihsdm.org.
IHSDM is a suite of software analysis tools to evaluate safety and operational effects of geometric design decisions. IHSDM supports the Data-Driven Safety Analysis initiative as part of the FHWA's Every Day Counts 3 (EDC-3) efforts. The IHSDM Crash Prediction Module implements Highway Safety Manual Predictive Methods (Part C) for two-lane rural highways, multi-lane rural highways, urban and suburban arterials, freeways and ramps/interchanges.
Major enhancements in this update include:
For more information contact Clayton Chen, clayton.chen@dot.gov or 202-493-3054. To learn more about IHSDM, please visit the program web page at https://www.fhwa.dot.gov/research/tfhrc/projects/safety/comprehensive/ihsdm/index.cfm
[ Return to list of contents.]
By: Abdul Zineddin, FHWA Office of Safety R&D
Roadway departures continue to account for more than half of U.S. roadway fatalities annually and nearly 40 percent of serious injuries, making such crashes a significant safety concern. The majority of lane departure crashes occur on rural two-lane roadways, with a disproportionate number of these crashes taking place on horizontal curves. Horizontal curves, which change the alignment or direction of the road (as opposed to vertical curves, which change the slope), are associated with more than 25 percent of fatal crashes, and the vast majority of these fatalities are associated with roadway departures. The average crash rate for horizontal curves is about three times that of other types of highway segments. About three-quarters of curve-related fatal crashes involve single vehicles leaving the roadway and striking trees, utility poles, rocks, or other fixed objects – or overturning. A primary factor in curve-related crashes is speeding.
Dynamic speed feedback sign (DSFS) systems are one method to reduce vehicle speeds and, consequently, crashes on curves. The Center for Trans-portation Research and Education at Iowa State University conducted a national demonstration project to evaluate the effectiveness of two different DSFSs in reducing speed and crashes on curves at 22 total sites on rural two-lane roadways in seven States. The goal was to provide traffic safety engineers and other professionals with additional tools to manage speeds and crashes on rural horizontal curves more effectively.
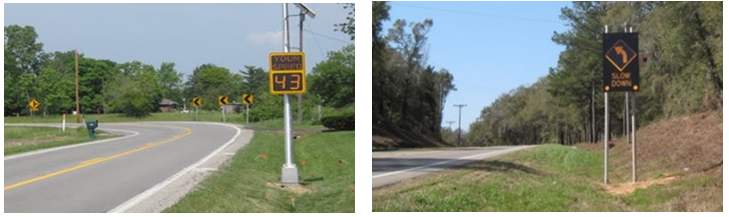
Researchers collected data before installation and at 1, 12, and 24 months after installation of the DSFS. On average, most sites experienced decreases in mean speeds, with decreases up to 10.9 miles per hour (mph) noted for both the point of curvature (PC) and center of curve (CC). In addition, large reductions in the number of vehicles traveling faster than the posted or advisory speed occurred for all of the "after" periods at the PC and CC, indicating that the signs were effective in reducing both high-end speeds as well as average and 85th percentile speeds. A before-and-after crash analysis also led to the development of crash modification factors (CMF), which ranged from 0.93 to 0.95 depending on the crash type and direction.
The findings of this study are documented in the report Evaluation of Dynamic Speed Feedback Signs on Curves: A National Demonstration Project, which is available at https://www.fhwa.dot.gov/publications/research/safety/14020/14020.pdf
For more information, contact Abdul Zineddin, 202-493-3288, abdul.zineddin@dot.gov
[ Return to list of contents.]
By Lisa Harris, Kansas LTAP
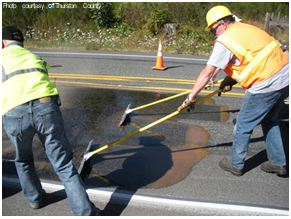
"It's pretty amazing, actually," said Scott Davis, county traffic engineer for Thurston County in Washington State. Davis is talking about high friction surface treatment, or HFST. His county's crew recently installed HFST on three road segments under a FHWA-funded demonstration project. HFST is designed to treat short sections of road where there have been crashes due to skidding or there is a high risk for skidding. It is a specialized aggregate placed over a binder that creates a sandpaper-like texture, improving the ability of tires to "grip" the road surface.
Davis has known about the technology for a while, but did not consider it for previous safety programs largely because it is more expensive than other run-off-the-road countermeasures like chevrons, rumble strips, and pavement markings. Davis noted, however, that in many areas of Thurston County there are limitations on where rumble strips can be installed due to the proximity of homes, lack of pavement structure, or lack of shoulders.
Davis said he was "re-motivated" to pursue HFST as a possible solution at the 2013 American Public Works International Congress in Chicago, where he learned about the striking effectiveness of an HFST project in Wisconsin. "Crash reductions were phenomenal – something like 100 down to 2 at an inter-state ramp," he said. Davis learned that FHWA's Every Day Counts (EDC) Program, which funds selected demonstration projects, recommended HFST. "At the time I was re-introduced to HFST, I was looking for another relatively low-cost and proven countermeasure that could help in some of the more interesting sites in Thurston County," Davis said.
To become more comfortable with applying and maintaining HFST, however, he wanted to see firsthand how the product was installed. He talked with the FHWA Division office and the Local Technical Assistance Program (LTAP) office in Washington State about organizing a demo.
"Partnerships are important in most things we do, but having the support of those two offices is crucial to getting an EDC-funded demo project," he said.
Mike Moravec of the FHWA Office of Transportation Performance Management and Frank Julian of the FHWA Resource Center organized the HFST demo that included a contractor installation at one site and a county maintenance crew installation at another site. FHWA paid for the contractor, materials for both sites, and provided training for the county crew, with the county funding its crew's labor. A technical team and vendors provided direct oversight for installation.
Davis, Washington LTAP, and FHWA developed a list of candidate sites for the demo using a combination of crash history and systemic risk analysis of roadway characteristics. Other considerations included sites that could provide enough room to stage and mobilize equipment and provide space for everyone observing to be safely off the road. Although the demo was planned for two sites, in the end, because there was extra material left over from the first two applications, the team was also able to treat a third demo site.
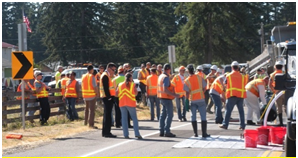
Thurston County hosted a peer exchange that coincided with the scheduled HFST installation by county maintenance staff. The intent was to allow attendees not only to learn about HFST in a classroom environment, but also to see an actual installation by local forces. Davis said 35 or so individuals attended, 21 of whom were from local governments. Davis said the weather cooperated – no small feat in Washington State. "[The installation team] did an amazing job," he added. "The work was done fast, and it was high quality. I believe these thoughts were shared by all those that attended the peer exchange."
Davis said the installation of HFST "goes pretty quick." For example, the county's maintenance crew laid about 440 ft. of HFST in a single lane in two hours, with only about an hour of preparation needed prior to installation. After installation, the treatment does need some time to cure. However, based on Thurston County's experience, Davis said a county could easily treat a one-lane segment in half a day with mobilization and demobilization. If treating two lanes, Davis recommended scheduling two days, although the crew would not be working full days at the site.
Davis appreciated having the county maintenance crews install HFST – and watching the process. "It's interesting to see a hands-on approach. It's a lot different than seeing a contractor do it," he said. Plus, for the cost of the labor, his county got a safety improvement. For him, hosting the demo was a win-win.
When asked if he had any tips for other agencies in using the materials, Davis said both of the materials used for the binder (acrylic resin or epoxy) are considered hazardous for various reasons, so the personnel handling them need to have hazmat certification to haul the materials. "Read and follow the MSDS (material safety data sheets)," he emphasized. Thurston County provided the appropriate safety gear and discussed the materials and precautions with staff prior to installation.
Davis estimated the cost of a 450-ft single-lane section to be $13-15,000 for materials, with two-thirds of that cost being for the binder and one-third being for the aggregate. "Although this sounds like a lot, it really is not if you have already exhausted other low-cost measures and you have no other options or are considering reconstruction," he said. Davis is looking at doing more HFST projects with the roadway maintenance crew next year.
Davis noted that "this effort would not have been possible without a strong partnership with our local FHWA and WSDOT offices. Both are very supportive of local road safety and helped champion our HFST demo request."
Two counties that attended the peer exchange have already decided to pursue HFST. One is planning to install a total of nearly 1 mile of treated segments, and the other county requested $2 million in HSIP funding to support its planned installations.
This article was excerpted from the Fall 2014 Kansas LTAP Newsletter at the Kansas University Transportation Center.
FHWA Videos Highlight High Friction Surface Treatments
Interested in learning more about High Friction Surface Treatments and how they are applied? FHWA has developed two videos that provide an overview of the benefits of HFST and its application process as well as some examples of where this safety countermeasure has been used.
Check them out today!
https://www.youtube.com/watch?v=V860pC6ncAY (20 minutes)
https://www.youtube.com/watch?v=HVzS-VkABPE (6 minutes)
[ Return to list of contents.]
By Sarah Trotto, National Safety Council
Kentucky's Alive at 25, an accredited Graduated Driver Licensing program, has expanded from six instructors teaching a few classes to 33 instructors teaching classes in every county. Since State troopers began teaching Alive at 25 in 2004, nearly 15,000 students have attended the program, and Kentucky's death toll among drivers aged 16 to 19 has declined by 51 percent.
However, Lori Hunsaker, the program's State Coordinator and Instructor Trainer, hopes to expand Alive at 25 even farther across the State. Her goals: double the number of instructors, secure permanent locations for classes, and bring the program into colleges.
"I would like to see it in every single county on a monthly basis," Hunsaker said. "We're not just in the schools or waiting for someone to approve the class. We're there each and every month teaching at some part of the county or in a [state police] post district."
One big draw is the instructors' expertise.
"The parents trust the state police," said Hunsaker, internal policy analyst with the Kentucky State Police and National Safety Council's (NSC) 2013 Defensive Driving Courses Instructor Trainer of the Year. "They see it's a little more in depth. We do promote the fact that the majority of the time the state police is the first responder to a crash. They know what it's like to tell a parent that a teen has been killed in a car crash. It puts more heart into it knowing how hard it is to do that job."
Hunsaker credited the program's growth to receiving certification last year from the Kentucky Transportation Cabinet after the NSC, the organization responsible for developing the curriculum, restructured the course contents – including more State-specific information – to meet the agency's guidelines.
Hunsaker has also discussed with Kentucky State University officials the possibility of making Alive at 25 a requirement for incoming students. She would like to see other colleges follow suit. Although teens and young adults 15 to 24 attend Alive at 25 in various States, 16- and 17-year-olds are generally targeted, Hunsaker said.
"What's hurting our teen fatality rate, it's not high school students, it's more the college students," Hunsaker said. "It's more the 18- to 19-year-olds. If we don't reach out to them, we're going to be right back where we were."
During a four-hour course, the instructors often share video, PowerPoint presentations, and stories to bolster the defensive-driving curriculum and show how crashes affect lives. The classes focus on both behavior and technical information, such as specific Commonwealth of Kentucky laws for GDL drivers.
"I've had a lot of the kids say it really made them aware of things, how quickly things can happen," Hunsaker said. "One reason they were keeping it to state troopers teaching it is the personal stories they can bring. Those stories really grab students' attention."
This article was adapted from a longer article published in the National Safety Council's Driver Trainer Newsletter.
[ Return to list of contents.]
By Jessica Rich, FHWA Tennessee Division
Improving crash data and analysis is a vital component of Tennessee's Strategic Highway Safety Plan (SHSP). One of the strategies in the SHSP is to "improve data collection in the field and [facilitate] data distribution to expedite and improve delivery of relevant data for safety analysis, infrastructure improvement, and law enforcement."
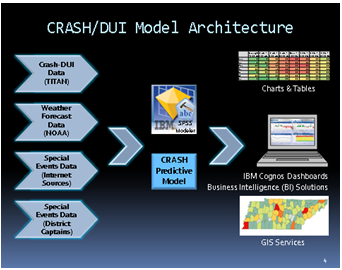
To help achieve this goal, in August of 2014 the Tennessee Highway Patrol (THP) spent $243,000 to launch a predictive analytics tool that forecasts crashes and assists law enforcement in the deployment resources in the field. THP, in consultation with IBM, used IBM's SPSS predictive analytics software to build the Crash Reduction Analyzing Statistical History (CRASH) program. CRASH predicts the occurrence of traffic crashes and DUI arrests based on integrated crash and DUI information, weather forecasts, and special events information, which it uses to build a statistical model (see diagram).
Although it is still early, CRASH has helped THP optimize manpower resources and support its local law enforcement partners. While currently focused on predicting the likelihood of serious injury and fatal crashes as well as DUI related crashes, THP plans to expand this tool to help with enforcement related to commercial vehicle crashes, drug interdiction, gun seizures, human trafficking, and felony arrests.
If you have questions or want more information about Tennessee's Crash Reduction Analyzing Statistical History program, please contact Jessica Rich, at Jessica.rich@dot.gov.
[ Return to list of contents.]
By: Erin Eggen, Kentucky Office of Highway Safety
The Kentucky Office of Highway Safety (KOHS) honored 193 law enforcement officers from 169 agencies across the Commonwealth at the Governor's Impaired Driving Enforcement Awards in December 2014. Awards were presented to officers with the most impaired driving arrests in each agency and division.
In 2014 Kentucky recorded more than 5,500 alcohol-related crashes, resulting in 138 deaths and more than 3,000 injuries. More than 440 of those crashes occurred in December, resulting in eight deaths and 239 injuries.
According to the National Highway Traffic Safety Administration, one in three Americans will be impacted by a drunken driving crash in his or her lifetime.
For more information on the Impaired Driving Enforcement Awards, please contact Erin Eggen of the Kentucky Transportation Cabinet at erin.eggen@ky.gov
[ Return to list of contents.]
By: Timothy E. Barnett, PE, PTOE, Alabama Department of Transportation and Susan B. Herbel, Cambridge Systematics, Inc.
The former speaker of the U.S. House of Representatives, Tip O'Neill once said, "All politics is local." You could say much the same for traffic safety. Fatalities and serious injuries don't happen "statewide," they happen in communities. Alabama is taking this notion to heart and using a bottom-up approach to update its Strategic Highway Safety Plan (SHSP). This means that rather than starting from a statewide perspective, State safety leaders will get the word straight from the source, starting the 2017 SHSP update with input from regional coalitions who will provide a community perspective.
Over the next two years, the Alabama Department of Transportation (ALDOT) will phase in this approach, beginning with four regions that represent diverse geographic and demographic characteristics, as well as highway safety issues experienced in rural, urban, and suburban areas. In addition, the regional coalitions will provide much-needed specifics regarding traffic safety in various geographical and socio-economic conditions. This information will provide the AL SHSP Steering Committee with a solid foundation for applying the regional SHSP program to the remaining regions.
Each region will be assigned the following tasks:
ALDOT will assist the first four regional coalitions in a variety of ways – e.g., data analysis, coalition building strategies, meeting planning and facilitation, research on countermeasure effectiveness, etc. – and will use those experiences to develop a user-friendly guidebook to document both the type of assistance available and the required procedures for the remaining eight regional coalitions to follow. The guidebook will outline the costs and benefits of regional SHSP implementation including challenges, opportunities, and lessons learned. It will also provide implementation guidance and available resources.
The phased approach will provide real-world experience to the remaining eight regional coalitions as they embark on the development of regional safety plans. The State will develop an overarching, statewide SHSP based on the 4 initial regional safety plans, and statewide strategies and action steps will be further enhanced by the experiences of all 12 coalitions.
To provide support for the regional planning effort and to improve traffic safety statewide, ALDOT is undertaking additional safety initiatives, such as:
For more information on the "bottom-up" SHSP planning approach, please contact Timothy E. Barnett, PE, PTOE, State Safety Operations Engineer, Alabama Department of Transportation, 334-353-6464, barnettt@dot.state.al.us
[ Return to list of contents.]
2015 FHWA Webinar Series: A Systemic Approach to Safety – Using Risk to Drive Action
Join your colleagues for a series of FHWA-hosted webinars to learn more about systemic safety noteworthy practices! Anyone with an interest in learning innovative systemic techniques to address traffic safety concerns is invited to attend.
June 8, 2015 (1:00 – 3:00 PM ET): Using the Right Tools for Systemic Safety Analysis. Learn about data analysis tools and approaches agencies are using to conduct systemic safety analyses. Register at: https://collaboration.fhwa.dot.gov/ dot/fhwa/WC/Lists/Seminars/DispForm.aspx?ID=556
September 29, 2015 (1:00 – 3:00 PM ET): Selecting the Right Systemic Safety Treatments. Learn about systemic safety treatments implemented by State and local agencies. Register at: https://collaboration.fhwa. dot.gov/dot/fhwa/WC/Lists/Seminars/DispForm.aspx?ID=571
November 2015 (Date TBD): Advancing Systemic Safety Implementation Efforts. Learn how agencies are using innovative implementation and evaluation approaches to advance systemic safety efforts.
To register, visit the Systemic Approach to Safety Training and Technical Assistance web page at: http://safety.fhwa.dot.gov/systemic/training.htm or contact Karen Scurry at karen.scurry@dot.gov or (609) 637-4207.11th International Conference on Low-Volume Roads, July 12-15, 2015, Pittsburgh, PA (http://tinyurl.com/mcgmb6l). This conference, held every four years and sponsored by the Transportation Research Board, will feature the latest information about low-volume road management, design, construction, safety, maintenance, and many other related topics. The conference is organized for practitioners worldwide in local, State, and Federal agencies; universities; private firms; and international organizations. For inquiries and general correspondence, please use the conference mail box: LVR@nas.edu
ITE 2015 Annual Meeting, August 2-5, 2015, Hollywood, FL (http://tinyurl.com/on97coj). Join your colleagues to participate in discussions and learn about topics such as traffic control devices, bicycle sharing, intelligent transportation systems (ITS), electronic tolling, data collection, incident detection, parking, and much more!
International Conference on Traffic and Transport Psychology (ICTTP2016), August 2-5, 2016, Brisbane, Australia (http://icttp2016.com/). The theme for this quadrennial international conference is "Taking Traffic and Transport Psychology to the World." The conference will feature a strong program of keynote speakers, oral and poster presentations, workshops, and symposia. ICTTP2016 is expected to attract 350 delegates from around Australia and overseas, including academics, researchers, and practitioners in the factors, and psychology. The conference will include presentations and discussions on the latest areas of public health, law, medicine, economics, law enforcement, public policy, education, human work being undertaken in the traffic and transportation psychology (i.e., human factors) field.
is a publication of the U.S. Department of Transportation, Federal Highway Administration.
The Federal Highway Administration publishes the Safety Compass newsletter three times a year. We can be reached at:
FHWA Office of Safety
1200 New Jersey Ave. SE
Room E71-320
Washington, DC 20590
The Safety Compass is available online at the FHWA Office of Safety web site at: http://safety.fhwa.dot.gov/newsletter/safetycompass/.
We welcome your comments and highway safety-related articles. The purpose of this newsletter is to increase highway safety awareness and information and to provide resources to help save lives.
We encourage readers to submit highway safety articles that might be of value to the highway safety community. Send your comments, questions and articles for review electronically to Tara McLoughlin at: tara.mcloughlin@dot.gov

