U.S. Department of Transportation
Federal Highway Administration
1200 New Jersey Avenue, SE
Washington, DC 20590
202-366-4000
Best for printing: PDF Version (2.36 MB)
In this issue:
New! Manual for Selecting Safety Improvements on High Risk Rural Roads is Now Available!
New! Local and Rural Road Safety Briefing Sheets Just Released!
Improving Safety on Rural, Local, and Tribal Roads One Step at a Time
FHWA Releases New BIKESAFE Guide To Improve Pedestrian and Bicycle Safety
Interactive Highway Safety Design Model Helps RSA Teams Identify Issues
FHWA Emphasizes Designing for the Needs of an Aging Population
"New and Improved" Roadway Safety Data Dashboard Coming Soon!
FHWA Joins Traffic Records Forum Attendees in Supporting Safety Data Integration Efforts
FHWA Kicks off the All Road Network of Linear Referenced Data (ARNOLD) Pooled Fund Study
Two Initiatives, One Shared Goal: PBPD and DDSA
FHWA Launches New "Designing for Pedestrian Safety 201" Course
Connecticut Develops Highway Safety Road Map (HSRM) Information Management Tool
Agencies Begin Developing and Calibrating State-specific SPFs
Maryland Brings Plans and Programs Under its SHSP Umbrella
Spotlight on the Colorado Flood Rapid Response
Scanning Tour Uncovers TZD Advances
"See Tracks? Think Train!" A Multimodal Public Safety Campaign
New eLearning Modules Focus on Roadway Departure Countermeasures to Improve Safety

The number of U.S. cities that are embracing biking and walking as viable, sustainable modes for their constituents is remarkable. These are not just the "usual suspect" cities like Portland, Seattle, New York, or Chicago. They're places like Sitka, AK; Ft. Worth, TX; Bozeman, MT; and Gainesville, FL that are working hard to make their communities bike and pedestrian friendly.
Over 600 jurisdictions have embraced policies that promote safe access for users of all ages and abilities, including pedestrians, bicyclists, motorists and transit riders. Cities with these "Complete Streets" policies are implementing innovative ways to improve bicyclist and pedestrian transportation. They're installing separated bike lanes (also known as cycle tracks) into their transportation networks, launching bike share programs to improve transportation options, and installing proven safety countermeasures such as pedestrian hybrid beacons to increase the safety of people crossing the street.
We hear from surveys and advocacy groups that people would walk or bike more often if they felt safer when they did it. So addressing these safety concerns is a key to unlocking greater use of these modes.
To help communities deliver the transportation network that their constituencies want, FHWA continues to provide tools and resources like PEDSAFE, BIKESAFE, Pedestrian Safer Journey, and Bicycle Safer Journey (see http://safety.fhwa.dot.gov/ped_bike/tools_solve/ for more information). We promote the use of proven countermeasures like road diets though a broad spectrum of activities including "Every Day Counts."
Improving pedestrian and bicyclist safety is one of Secretary Foxx's top priorities, and he is marshalling the Department's resources to advance that priority. The pedestrian and bicycle assessments that Secretary Foxx announced in September are underway across the country and will identify additional actions that can be taken to improve pedestrian and bicyclist safety.
So whether you "Walk this Way" like Aerosmith, or "Walk the Line" like Johnny Cash, or "Walk on the Wild Side" like Lou Reed, or sing to yourself "I want to ride my bicycle, I want to ride my bike" like Queen–we'll do all we can to have the infrastructure there to support you.
By: James Dahlem, FHWA Office of Safety
State and local agencies face significant safety challenges on rural collectors and rural local roads, where the fatality rate is nearly 2.5 times as high as the urban fatality rate. According to NHTSA, in 2012 the rural fatality rate was 1.84 per 100 million vehicle miles traveled (VMT), while the urban fatality rate was 0.77 per 100 million VMT. However, the majority of rural roadways are owned by local agencies with limited funding and expertise to solve safety issues on these roadways.
The FHWA Office of Safety is committed to reducing crashes and saving lives on these high risk rural roads. As part of this effort, FHWA has released a new resource to assist State and local transportation agencies in selecting and comparing safety treatments: the Manual for Selecting Safety Improvements on High Risk Rural Roads.
This manual allows users to quickly identify and compare cost-effective proven infrastructure treatments to address crash problems on these rural roadways. Based on research into State, local, and tribal agencies' noteworthy practices, the manual:
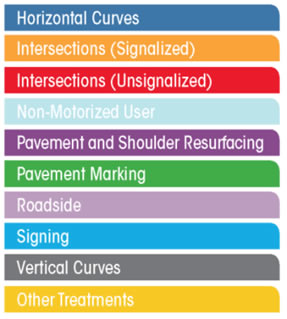
Color-coded and tabbed sections allow
a user to quickly jump to the section of the
manual that describes treatments
for each of the roadway feature types.
The manual is organized into categories by roadway feature and is color-coded throughout to aid in navigation. A matrix in each category section helps users narrow the possibilities based on criteria specific to an agency's needs and available resources. The manual also covers safety program management, potential funding sources and processes, and decision-making tools.
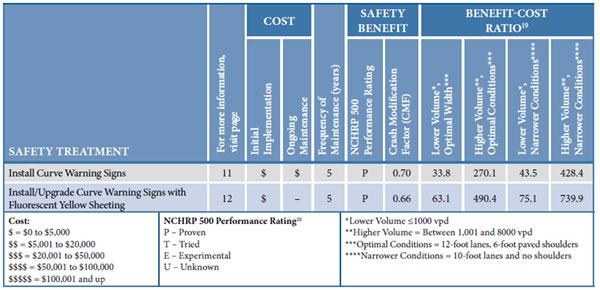
A matrix at the beginning of each section provides a quick reference on the costs and benefits
for each treatment to quickly identify a few potential countermeasures that can be compared in greater detail in the manual.
[ Return to list of contents.]
Do you or your colleagues have questions about how to improve safety at a specific location on a local or rural roadway? Are you wondering how to apply systemic solutions on your local roadway system? Do you have a high-crash intersection that you need to figure out how to improve? Or maybe you are trying to figure out what your options are for funding a local safety improvement and want to connect with decision makers to get buy in.
FHWA recognizes that practitioners in local and rural areas have questions and need fast, easily accessible guidance specifically geared toward their questions and concerns. In response, the Office of Safety has developed a series of 15 briefing sheets on a wide array of rural road safety-related topics. Each briefing sheet provides ideas and helpful information that addresses safety on subjects such as unpaved roads, bicycle and pedestrians, driver behavior, as well as developing local road safety plans, and even using crash modification factors effectively. Each two- to four-page briefing sheet contains an extensive list of resources and links that you can access quickly via the web for more detailed information on the topics that are most important to you.
Interested in learning more? Visit FHWA's Local and Rural Road Safety Program at http://safety.fhwa.dot.gov/local_rural/ to access these and other valuable resources today!
[ Return to list of contents.]
By: Rosemarie Anderson, FHWA Office of Safety
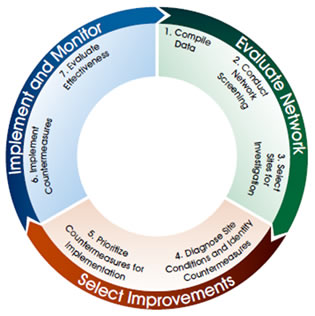
Safety Analysis Process
According to FHWA, rural roads account for approximately 40 percent of the vehicle miles traveled in the United States, but almost 57 percent of fatalities. Even though staff in rural agencies are keenly aware of the need to address safety on these roadways, they are often tasked with many diverse responsibilities including planning, landscaping, construction oversight, and maintenance. In the busy world of rural transportation safety, practitioners are always looking for more efficient ways to identify and apply effective safety countermeasures.
To help both rural and tribal agencies address roadway safety issues in an efficient and effective way, FHWA has developed new resources: Improving Safety on Rural Local and Tribal Roads – Safety Toolkit and two accompanying User Guides.
The Toolkit walks the reader through a step-by-step safety analysis process. Each step includes descriptions of tools, examples, guidance, resources, and implementation suggestions.
The plain language and real world examples make this user-friendly product an easy reference guide for local and tribal practitioners dealing with traffic safety challenges.
The accompanying User Guides demonstrate different aspects of the Toolkit through the use of hypothetical examples based on real-world situations.
Improving Safety on Rural Local & Tribal Roads – Site Safety Analysis, User Guide #1 concentrates on how to conduct a site-specific analysis for a specific scenario. The guide gives a hypothetical example in which residents in a community are complaining that travel speeds are too high on a horizontal curve in their community and have taken their concerns to community leaders who in turn ask the Public Works Department to study the location and come up with a solution. How should a Director proceed? The User Guide walks the Director through the solution for addressing this problem in a way that satisfies all stakeholders.
Improving Safety on Rural Local & Tribal Roads – Network Safety Analysis, User Guide #2 describes how to conduct a safety analysis on a component of the transportation network (such as all two-lane road segments, or all stop-controlled intersections). A hypothetical example of this type of analysis might involve a question from a county commissioner on how to improve intersection safety following a particularly severe traffic crash, such as one involving teenagers.
Training on how to use the Toolkit and User Guides will be available in the near future. The Toolkit and User Guides are now available online at http://safety.fhwa.dot.gov/local_rural/. For more information, contact Rosemarie Anderson at rosemarie.anderson@dot.gov.
[ Return to list of contents.]
By: Tamara Redmon, FHWA Office of Safety and the Pedestrian and Bicycle Information Center
The FHWA Office of Safety is pleased to announce it has released its newly revised Bicycle Safety Guide and Countermeasure Selection System (BIKESAFE). This resource helps support the U.S. Department of Transportation's new pedestrian and bicycle safety initiative.
BIKESAFE is an online guide for implementing countermeasures to improve the safety and mobility of bicyclists and is now available for use on your computer, tablet, or smartphone. It provides practitioners with information and tools to review and select engineering and roadway infrastructure improvements to reduce bicyclist injuries.
BIKESAFE is comprised of four sections:
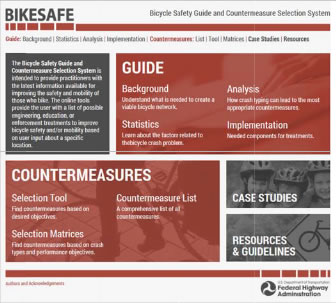
BIKESAFE Online Guide
BIKESAFE also features links to dozens of other helpful web resources. For more information on the USDOT pedestrian and bicycle safety initiative, visit www.dot.gov/briefing-room/us-transportation-secretary-foxx-announces-new-initiative-enhance-pedestrian-and.
.[ Return to list of contents.]
By: Rebecca Crowe, FHWA Office of Safety
Localities are increasingly using Road Safety Audits (RSAs) to assess road safety issues and to identify opportunities for improvement. RSAs are formal safety performance evaluations of existing or future roads or intersections conducted by an independent, multidisciplinary team. These evaluations can be performed on any type of facility during any stage of the project development process, including during the design phase.
When RSAs are conducted on existing facilities, the RSA team typically uses available data and field observations to assess safety conditions. Historical crash and other data can help an RSA team to understand the issues and target locations for a more detailed investigation in the field.
Practitioners have found that the FHWA-supported Interactive Highway Safety Design Model (IHSDM), originally developed to evaluate the safety and operational effects of roadway geometry on highways, is a highly useful tool for providing quantitative measures of roadway safety that can be used during the RSA process. IHSDM currently includes six evaluation modules (Crash Prediction, Design Consistency, Intersection Review, Policy Review, Traffic Analysis, and Driver/Vehicle) that evaluate safety from a different perspective. When IHSDM models are run prior to the RSA, the model outputs can be an effective tool for flagging potential problems for detailed field investigation by the RSA team and can help point to potential measures that may mitigate safety issues identified as part of the RSA process. IHSDM can also help focus an RSA team's efforts, maximizing the efficiency and productivity of the audit process.
In a recent series of RSAs conducted in Montana, Oregon, and Rhode Island, IHSDM enabled the RSA teams to identify potential crash factors, or combinations of crash factors, in advance of the RSA, and to calculate the effects of potential countermeasures in terms of expected crashes, predicted operating speeds, stopping sight distance, etc. It also improved the potential for the RSA team to identify and prioritize those locations that pose the greatest crash risk, not just locations experiencing crashes. This highlighted the need to address some crash types at these study locations in a more systemic manner.
The RSA teams identified several benefits of using IHSDM in the RSA process. In addition to providing quantitative assessments, IHSDM helps RSA teams focus their efforts– this is especially true on longer corridors where completion of an RSA would be time and cost prohibitive. Using IHSDM on longer corridors also facilitates a "holistic" look at safety that takes crash risk into consideration, not just reported crashes. This systemic approach gives road owners the ability to address safety on a larger scale by applying wide-scale, low-cost countermeasures systemically.
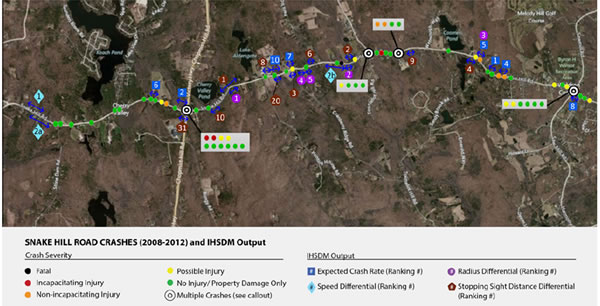
Section of Snake Hill Road in Glocester, Rhode Island with crashes (2008-2012) and IHSDM output
results.
The results confirmed critical "spot" locations along the corridor, including three intersections
that showed a total of 24 crashes
during a 4-year period.
However, the RSA teams found that there can be challenges to using IHSDM in the RSA process as well. One of the biggest challenges is obtaining and entering geometric data for existing facilities' RSAs, which can significantly increase the cost of the RSA. As a result, the case studies identified two RSA projects that could benefit the most from the use of IHSDM:
[ Return to list of contents.]
By: Rebecca Crowe, FHWA Office of Safety and Marcus A. Brewer, P.E., Texas A&M Transportation Institute
The number of aging persons using our Nation's streets and highways continues to increase. According to the National Highway Transportation Safety Administration, 13 percent of the total U.S. resident population (41.4 million people) were age 65 and older in 2016. The Aging Statistics page on the Administration on Aging website says that by 2030 there will be approximately 72.1 million Americans in that age category, accounting for roughly one-fifth of the population of driving age in this country. In effect, for many aspects of road planning and design, the "design driver" and the "design pedestrian" of the early 21st century will likely be 65 or over.
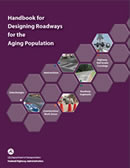
In a proactive response to this pending surge in aging road users, FHWA has published the Handbook for Designing Roadways for the Aging Population. The Handbook is divided into two parts. Part I includes recommendations on treatments and countermeasures to address specific areas of concern for aging road users, and Part II presents the rationale, supporting evidence, and previous research results for each treatment. Four supplemental appendices include technical notes, a procedure for measuring the visibility of treatments, a glossary, and an extensive list of references.
Part I is organized around five broad roadway feature categories, each containing a number of specific design elements for which guidance is presented. The top priority is intersections, reflecting aging drivers' most serious and enduring crash problem area, as well as the greatest exposure to risk for pedestrians. Next, well-documented difficulties with merging/weaving and lane changing maneuvers provide opportunities for treatments at interchanges. Roadway segments, with an emphasis on curves and passing zones, plus highway work zones, are included due to heightened steering demands that may increase a driver's workload along with an increased potential for unexpected events that require a rapid response. Finally, highway-rail grade crossings merit consideration as sites where conflicts are rare, and thus unexpected, and where problems of detection may be aggravated by the sensory losses that come with advancing age.
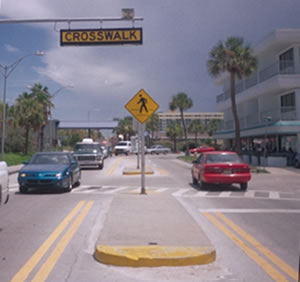
The visibility of curbs and medians is especially important
when medians are used as pedestrian refuges due to the
effects
of age on visual ability. Pedestrian refuges
must
be clearly signed and made as visible as possible.
Part II presents the rationale, supporting evidence, and previous research results for each treatment recommendation made in Part I. The material in this part of the Handbook represents, to as great an extent possible, the results of empirical work with aging driver or pedestrian samples for investigations with the specific highway features of interest. Naturalistic and controlled field studies were given precedence, but were augmented by laboratory simulations employing traffic stimuli and relevant situational cues.
Crash data are cited, as appropriate. Part II also includes some reference studies showing the effects of design changes, where the predicted impact on (aging) driver performance is tied logically to the results of research on age-related differences in detection, comprehension, response selection, maneuver execution, or other capability needed to safely negotiate the design element.The recommendations in the 2014 Handbook can be applied preemptively to enhance safety wherever there are aging road users in a given jurisdiction, or it may be employed primarily as a "problem solver" at crash sites. FHWA encourages States and localities to apply treatments highlighted in the Handbook in the design of new facilities and planned highway reconstruction projects or to make improvements in existing facilities. Implementing these treatments is intended to translate into real gains in safety and mobility for the increasing number of our Nation's aging citizens, and many of the treatments have potential benefits for all users of our surface transportation system.
The 2014 Handbook for Designing Roadways for the Aging Population is available at http://safety.fhwa.dot.gov/older_users/handbook/. For more information and resources on meeting the transportation needs of the elderly, visit the Office of Safety's Older Road User program page at http://safety.fhwa.dot.gov/older_users/.
By: Danielle Betkey, FHWA Office of Safety
The Office of Safety has been working hard to update and redesign its Roadway Safety Data Dashboard, just in time for TRB! The dashboard will provide a graphical presentation of fatal crashes on U.S. public roadways – describing the crash, the vehicles, and the people involved.
Information previously scattered across three separate menus will be condensed via an easy-to-follow, step-by-step procedure. The dashboard also includes a redesigned process for creating individual graphs and maps.
As a result of this workflow redesign, lots of new possibilities open up, such as the ability to add graphs looking at different States, regions or metropolitan planning organizations (MPOs) to the same dashboard. Users will also find options for new combinations of data display and comparison, including manner of collision, person involved, and location and setting.
Additional improvements include a refocused landing page to better introduce and promote the dashboards to users and updated graphing options that will offer new display options including line and area charts.
Start looking for the new dashboard beginning in January 2015!
By: Bob Pollack and Esther Strawder, FHWA Office of Safety, and Arianna Betkey, FHWA California Division Office
The Association of Transportation Safety Information Professionals (ATSIP) held its 40th Annual International Traffic Records Forum (TRF) in St. Louis, MO from October 26-29, 2014. This event brought together a large gathering of individuals and agencies responsible for collecting, managing, and analyzing safety data. The FHWA Office of Safety was represented at the TRF by Michael Griffith, Esther Strawder, and Bob Pollack. Carol Tan from the Office of Safety Research and Development and Arianna Valle from the FHWA California Division Office also participated.
The theme of this year's TRF was "Gateway to Integration." This theme was particularly timely as FHWA works to assist State and local agencies in creating State safety data systems to meet the requirements of MAP-21. FHWA efforts include identifying good safety data analysis practices and providing technical assistance and training in support of efforts to collect, analyze, manage, and integrate safety data. This assistance allows States and local agencies to have their targeted needs met or to identify steps that address their challenges. Some of the programs and presentations that FHWA was involved in or supported included:
Contacting Bob Pollack (202-366-5019 or robert.pollack@dot.gov) for more information about these programs and presentations.
[ Return to list of contents.]
By: Joseph Hausman, FHWA Office of Highway Policy Information
On August 7, 2012, FHWA announced that, beginning in 2014, Highway Performance Monitoring System (HPMS) reporting requirements would expand from mapping only the Federal-Aid System to mapping all State and locally managed public roads. As a result, supporting a national geospatial platform for highway information – All Roads Network of Linear Referenced Data or ARNOLD – has become a critical endeavor.
Many State and local DOTs have been challenged by this expanded requirement as they focus on mapping their public roadways. FHWA recognizes that working with local authorities and partnering with non-State DOT organizations is an essential component to building a cohesive spatial network of roadways as envisioned in the Transportation for the Nation (TFTN) plan and has initiated a Pooled Fund Study (PFS) project to assist States in developing their own ARNOLD and to meet the HPMS requirements.
The Statewide Geospatial Transportation Development of the ARNOLD PFS is different from traditional studies in that FHWA and the PFS consultant team are working with each participating State to develop individual work plans designed to meet their specific needs. Since State needs vary significantly, this PFS will consider any work plan that helps States support the ARNOLD initiative.
Interested in participating in the ARNOLD PFS? Applications are being accepted through January 9th, 2015. Please visit http://www.pooledfund.org/Details/Solicitation/1366 for more information, or contact Joe Hausman at joseph.hausman@dot.gov
Activities may include planning, development, and maintenance of the network geometries and linear referencing systems (LRS) as well as the development and maintenance of network attributes supÂporting Highway Performance Monitoring System, National Bridge Inventory, Model Inventory of Roadway Elements and/or Financial Management Information System. The PFS places emphasis on the planning aspects of ARNOLD for each state and has identified the following recommended activities:
The study will fund approximately 10 State ARNOLD PFS projects and is open to new submissions from States interested in obtaining support for addressing their unique resource needs to comply with ARNOLD. For more information about ARNOLD, or to inquire about participating in the study, please contact Joe Hausman at joseph.hausman@dot.gov.
[ Return to list of contents.]
By: Ray Krammes and Jerry Roche, FHWA Office of Safety
PBPD and DDSA: two new acronyms for safety professionals to add to their glossary, and two opportunities to strengthen integration of safety into highway agency practices. PBPD is the acronym for Performance-Based Practical Design and DDSA stands for Data-Driven Safety Analysis, a new initiative promoted under the Every Day Counts, Round 3 Innovations. This article highlights the interrelationship between these two new FHWA initiatives.
FHWA Executive Director Jeff Paniati announced in his October 24, 2014 e-mail to FHWA staff the release of resources designed to position the Agency to take a leadership role in advancing the practice of PBPD.
PBPD is an approach to decision-making that encourages engineered solutions rather than relying on maximum values or limits found in design specifications. PBPD is grounded in an analytic framework that enables States to utilize existing design flexibility and analysis tools in a way that maximizes benefits while minimizing costs. Project-level decisions can be placed in a systems context so that the implications of these decisions can be better understood.
Safety professionals play an important role in PBPD by performing the data-driven safety analysis that can inform decisions throughout the project development process. Objective data on the safety performance impacts of project decisions are a key to incorporating design flexibility in a way that maximizes benefits while minimizing costs.
The Kansas Department of Transportation allocated a $25 million budget to a modernization project on K-177 from Council Grove to I-70. The estimated cost to completely reconstruct this 22.9-mile corridor was $67 million. Therefore, the Kansas DOT conducted extensive safety and operational analysis to select a project scope that achieved their performance objectives within their budget constraint. Key elements of the project scope included: widening the existing 26-ft cross section (13-ft lanes) to 40 ft. (12-ft lanes and 8-ft composite shoulders) throughout the corridor, reconstructing 4.6 mi of the existing alignment, retaining existing pavement beyond the reconstructed section, replacing one bridge, and extending a second bridge. The analyses estimated that, compared to the no-build condition, the project would:
The EDC3 DDSA innovation builds on decades of work and current collaborative efforts to incorporate safety performance into all highway investment decisions with the ultimate goal of saving lives. DDSA focuses on broadening implementation of two advances – predictive approaches and systemic approaches – into safety management processes and project development decision making. Applying predictive approaches in project development is truly what is meant by PBPD.
Predictive approaches combine crash, roadway inventory, and traffic volume data to provide reliable estimates of an existing or proposed roadway's expected safety performance in terms of crash frequency and severity. These methods can help agencies quantify the safety impacts of transportation decisions, similar to the way agencies quantify traffic growth, construction costs, environmental impacts, pavement life, and traffic operations. These techniques can be applied at various stages of the project development process.
By advocating a broader deployment of predictive analysis approaches to highway safety investment decision-making, FHWA seeks to improve on traditional approaches that rely on recent crash history data at a site. The goal is a more scientifically sound, data-driven resource allocation approach that results in fewer fatalities and serious injuries on the Nation's roadways.
Examples of tools agencies can use to apply predictive approaches for data-driven safety analysis in project development include:
[ Return to list of contents.]
By: Peter Eun, FHWA Resource Center
Based on the principle that the right design invites the right use, Designing for Pedestrian Safety 201 (DPS 201) picks up where the introductory DPS 101 course left off, providing engineers, planners, and traffic safety professionals with more detailed instruction for applying the safety countermeasures introduced in DPS101. The DPS201 course addresses several specific design and operational countermeasures, including:
The workshop, conducted by an FHWA instructor and a consultant instructor, allows participants to ask questions about these countermeasures and gain new insights and information.
The new DPS 201 course is structured to be flexible. Agencies can opt for the full three days of training, or select only those modules that are of the greatest interest for a shorter duration course. FHWA will consult with each host agency in advance to prioritize the modules and teach as many as possible in the time allocated.
[ Return to list of contents.]
By: Robert W. Turner, P.E., FHWA Connecticut Division Office
The FHWA Connecticut Division Office, in partnership with the Connecticut Department of Transportation (CTDOT), has created an information management tool that we hope will serve as a concept model for other FHWA program areas such as planning, environment, rights-of-way, civil rights, bridges, and operations. We created this tool, called the Highway Safety Road Map (HSRM), because the State had an ongoing need for a comprehensive reference that contained resources for current information as well as a library of past discussions on highway safety.
The HSRM provides quick access to guidance, reference, discussion, and monitoring materials to encourage the implementation of highway safety improvements in Connecticut under the Federal-aid highway program. The HSRM includes external links to web sites for more detailed information on highway safety and related topics, a list of acronyms, a multi-year table of Connecticut traffic safety statistics, agency mission statements, and highway safety contacts as well as internal links to a cumulative synthesis of past highway safety meeting minutes–including an action items tracking table. This compendium of information is continually updated and periodically distributed as a "living" document for internal use by the agencies.
The idea for this information management tool evolved after the FHWA Division Office and CTDOT instituted a series of regular monthly meetings on highway safety topics in August 2012. It was motivated in part by new opportunities for improving inter-agency communications on highway safety following staff changes at CTDOT. A programmed schedule of regular monthly highway safety meetings has helped ensure timely and coordinated safety planning discussions and actions by our agencies. This collaboration has also helped enable compliance with new Federal policies and procedures to implement MAP-21 requirements.
The HSRM is an integral component of these meetings, and is shared with our counterparts at NHTSA and FMCSA, who regularly participate in these meetings. In addition, it is used by Division Office management as a reference on the status of highway safety issues in Connecticut.
A variation of this document that excludes the synthesis of past meeting minutes, called the Highway Safety Road Map (Topics Index), has been made available for external distribution to the Connecticut Local Technical Assistance Program (LTAP) (http://www.t2center.uconn.edu/) at the University of Connecticut (UCONN) Transportation Institute (http://www.cti.uconn.edu/) and participants at an NHI course on Transportation Safety Planning (http://www.nhi.fhwa.dot.gov/downloads/catalog/FHWA-NHI-151042.pdf ) held in Connecticut, and is available for download at: http://www.t2center.uconn.edu/pdfs/SafetyIndex.pdf The Topics Index was also presented at the 2014 Northeast Transportation Safety Conference in Rhode Island.
For more information, or to request a copy of Connecticut's Highway Safety Road Map, contact: Robert W. Turner, P.E. (860-494-7563 or robert.w.turner@dot.gov).
By: Ray Krammes, Esther Strawder, and Jerry Roche, FHWA Office of Safety
The AASHTO Highway Safety Manual (HSM) provides predictive models to quantify the potential effects on crashes as a result of various transportation decisions. These models, referred to as Safety Performance Functions (SPFs), have been developed for various facility and site types based on observed crash data from various states. For simply comparing alternatives, these SPFs can be used "as-is" (i.e., uncalibrated) to help make informed decisions.
However, for more accurate predictions, FHWA recommends adjusting these SPFs to account for differences between the conditions present in the models and the jurisdictions in which the models are being applied. For example, some of the variations that could be present include differences in crash reporting thresholds, terrain, weather, the prominence of animal crashes, and driver behavior. Agencies can make these adjustments by calibrating the HSM-provided SPFs or developing agency-specific SPFs.
FHWA compiled results from 10 States that have published their calibration factors and/or State-specific SPFs. AASHTO will be posting them soon.
For States ready to start SPF calibration and/or development, several guides are available to help:
FHWA offers technical assistance on SPF calibration and development through its Roadway Safety Data Program and the Every Day Counts program's Data-Driven Safety Analysis initiative. For more information and to apply for assistance, go to http://safety.fhwa.dot.gov/rsdp/technical.aspx
By: Melonie Barrington, FHWA Office of Safety
Every State's Strategic Highway Safety Plan (SHSP) provides a comprehensive framework for reducing deaths and serious injuries on all public roads. Maryland, which has adopted a vision of Toward Zero Deaths, is an exemplar of using an SHSP as a framework for Statewide safety plans and programs.
An SHSP is an umbrella plan that guides transportation plans and roadway safety investment decisions. Maryland's SHSP seeks to bring Statewide road fatalities down to 475 by 2015 and to half that number by 2030. To reach those goals, the State is bringing the SHSP concept to the local level.
The big idea in Maryland is for local plans to align with the SHSP, but with emphasis areas and strategies tailored to match local conditions. The Maryland State Highway Administration (SHA) is taking the lead and is developing local data packages for counties.
Hartford County, MD, located northeast of Washington, DC, has already developed a local SHSP and has set the stage for efforts in other counties. Like the State's SHSP, the Hartford County SHSP follows a data-driven, multidisciplinary approach the draws from the 4E's of traffic safety–education, emergency medical services, enforcement, and engineering.
The Hartford County SHSP provides a framework for reducing fatalities and serious injuries on all county roads, and it establishes goals, objectives, and key emphasis areas that align with the goals and objectives of the Maryland SHSP. The Hartford County SHSP encompasses all road users, including bicyclists, drivers, motorcyclists, and pedestrians.
Hartford County will join Maryland SHA in adopting the goal of halving traffic fatalities by 2030, which is also the centerpiece of FHWA's national Toward Zero Deaths initiative. Hartford County used the same methodology as was used in the State's SHSP to establish benchmarks for progress, and the county will follow interim goals for fatality and injury reductions by 2015.
At the State level, the Maryland Department of Transportation (DOT) did not always use the SHSP as a standard. In prior years, the safety elements in the Maryland DOT's Statewide Long Range Transportation Plan and the Motor Vehicle Association's long range plan were not in line with the SHSP. Now, through a concerted effort to elevate the State SHSP in the eyes of the DOT, the SHSP sets the tone and goals for these plans, and the plans refer back to the SHSP.
Other Maryland State agencies have also begun to refer to the SHSP. For example, the Maryland Department of Health and Mental Hygiene and the Maryland State Police both have agency business plans with highway safety components that align with those in the SHSP.
"The SHSP guides our overarching highway safety goals and efforts. Our annual safety plans are where the rubber meets the road."
–Thomas J. Gianni, Chief
Maryland Highway Safety Office
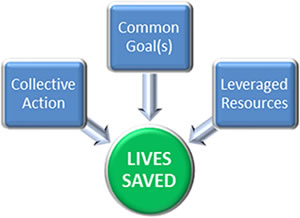
By integrating the SHSP across the DOT and other State agency efforts, the safety needs of the State can be addressed more strategically and resources can be shared more effectively. Integration encourages State partners to strive toward common goals, collectively implement appropriate strategies and actions, share resources to meet or exceed the State's goals and objectives, and, most importantly, save lives.
For more on Maryland's SHSP efforts and other noteworthy practices from around the country, please visit FHWA's Roadway Safety Noteworthy Practices Database. For more information on Maryland's Toward Zero Deaths initiative, please visit http://towardzerodeathsmd.com/.
By: Leslie DeWitt, FHWA Central Federal Lands Highway Division; Barbara Burke, FHWA Central Federal Lands Highway Division; Dahir Egal, FHWA Colorado Division Office
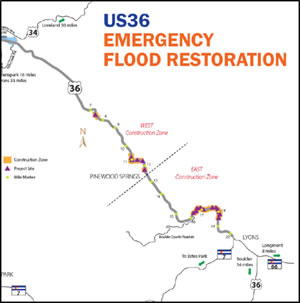
During the week of September 9, 2013, a slow-moving cold front stalled over Colorado, clashing with warm, humid, monsoonal air from the South. This resulted in heavy rain and catastrophic flooding along Colorado's Front Range, which caused flash flooding that washed out many roads throughout the State, including US Highway 36, Larimer County Road 43, Larimer County Road 47, roads throughout Pike National Forest, Arapaho-Roosevelt National Forest, and roads throughout Rocky Mountain National Park. Access to several mountain communities and many other remote areas became extremely limited or totally cut off.
There was an urgent need to reestablish the roadway network to provide access to these communities; therefore, Gov. John Hickenlooper set a deadline to complete all permanent repairs by December 1, 2014. To begin construction as quickly as possible, a project team was created to coordinate the massive relief efforts. The project team included the Central Federal Lands Highway Division (CFLHD), the Colorado Division Office of Federal-Aid, Colorado Water Conservation Board, Colorado Department of Transportation (CDOT), USDA – Arapaho-Roosevelt and Pike National Forests, Larimer County, Boulder County, and the Army National Guard. This project team adopted highly accelerated design and contractual delivery strategies, and utilized a true peer-to-peer collaboration to meet the tight deadlines.
When repairs were being performed on the main routes, such as US Highway 36 (see map), it was important to keep the road open during construction. Public safety was a priority, and the 4E's of safety (Engineering, Education, Law Enforcement, and Emergency Response) were the main focus. Engineering for safety included redesigning drainage structures for improved flood capacity; redesigning horizontal curves to meet design criteria; and constructing wider, flatter shoulders for clear zones
A major component of safety during this massive repair effort was the education of the public concerning expected road delays during construction. Many of the local residents were stranded and cut off from access to supplies and services. Keeping them well-informed of delays, road reconfiguring, and detours was critical toward alleviating their concerns. Law enforcement personnel were continuously available to provide communication and maintain traffic during blasting operations and the resulting delays. Due to the diligence and open communication of all personnel, emergency services had full access through the construction zone at all times.
Several important highlights of the safety effort involved in the disaster relief effort include the following:
By: Jennifer Warren, FHWA Office of Safety
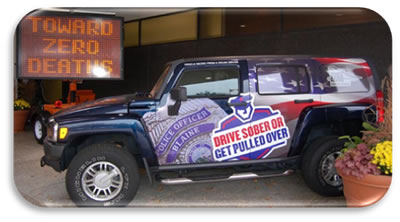
Many transportation agencies across the United States are adopting a toward zero deaths (TZD) goal or vision, and a great deal can be learned from their experiences, successes, and obstacles. As part of NCHRP's U.S. Domestic Scan Program, a team of safety practitioners and experts among State, local and national agencies took part in a two-week scanning tour in the spring of 2014 to identify advances and opportunities in TZD practices.
The scan team observed that TZD provides an overarching philosophy (or mindset) that brings safety partners together and helps articulate a compelling and unifying vision. Another commonality is that TZD adoption is a leading indicator of a change in an agency's safety culture. "Successful strategies vary by agency, however," scan chair Priscilla Tobias of Illinois DOT. "It was apparent that there isn't a ‘one-size-fits-all' approach."
Enforcement is one of Minnesota's "Four E's" for TZD, along with Education, Engineering, and Emergency Medical and Trauma Services. (Image courtesy minnesotatzd.org).
Other highlighted findings from the scan include:
Effective internal communication and external marketing are vital.
Additional factors for a robust TZD program are goal setting, performance tracking, commitment to research, and integration into standard practice to ensure program sustainability. The scan team included representatives from Illinois, Iowa, and Pennsylvania DOTs; Louisiana's Local Technical Assistance Program; Champaign County (Illinois) Regional Planning Commission; FHWA; and AASHTO. The team visited sites in Idaho, Maine, Maryland, Michigan, South Carolina, and Washington State, and met with Minnesota via webinar. Findings from the scan will be published at http://www.domesticscan.org/12-03-noteworthy-practices-of-zero-fatalities-states
By: Joyce Rose, President and CEO, Operation Lifesaver, Inc.
A recent rise in the number of vehicle-train collisions and pedestrian rail trespass casualties prompted Operation Lifesaver, Inc. (OLI), the national, nonprofit rail safety education organization, to develop a multi-faceted public awareness campaign with the assistance of its safety partners at the U.S. Department of Transportation (USDOT). Preliminary USDOT statistics show that, from 2012 to 2013, highway-railway grade crossing collisions for all vehicles rose by 5.6 percent; through August 2014, collisions increased more than 10 percent. Similarly, the number of pedestrian-train incidents (deaths and injuries combined) across the United States rose 4.8 percent in 2013, and 7.5 percent through the first 8 months of 2014.
To address this problem, in April of this year OLI launched its first national safety outreach effort in over a decade with the "See Tracks? Think Train!" (ST3) campaign. The organization partnered with the Federal Highway Administration (FHWA), Federal Railroad Administration (FRA), Federal Transit Administration (FTA) and the Association of American Railroads to develop and launch the campaign.
The multimedia ST3 campaign includes television and radio public service announcements (PSAs), billboards, posters, and other collateral materials, as well as a dedicated microsite. All materials are available in both English and Spanish. The campaign targets younger people, especially young men ages 18-35, although the message is applicable to any age group. Campaign materials are designed to raise awareness about grade crossing safety and railroad trespass prevention, and to combat distraction around passenger rail and transit systems.
Throughout the year, ST3 campaign materials – billboards, movie theater PSAs, posters, signage in train stations and on buses and light rail vehicles – have been getting further exposure through OLI State programs and transit agency-led projects and campaigns, thanks to grants funded by FRA and FTA.
The campaign's television and radio PSAs were distributed to stations in the top 15 States for trespassing fatalities. In all, 578 television stations and 2,819 radio stations received the ST3 PSAs.
According to usage reports, through September 30th, 136 television stations in the Top 15 States for trespasser fatalities are currently playing the ST3 video PSA, with 14,172 broadcasts reported, and more than 38 million potential audience impressions. The radio PSA results are even more impressive: 220 radio stations are playing the PSA, with 40,695 broadcasts reported, and approximately 97 million potential audience impressions.
Working with FHWA, Operation Lifesaver also created billboards and posters that feature semi-trailer trucks, adapting the "See Tracks? Think Train!" message for professional drivers.
On November 6, we learned that the ST3 campaign won six different MarCom Awards, a creative competition for marketing and communications administered and judged by the Association of Marketing and Communication Professionals. The campaign itself won a platinum MarCom Award; the billboards and posters won Gold Awards; and the TV and radio PSAs, along with the microsite, received Honorable Mention Awards. Our success with this campaign extends to our safety partners at FHWA, FRA, and FTA as well.
What's next for "See Tracks? Think Train!"? The campaign PSAs will continue to be aired in states throughout the country, and regional and state efforts will continue through 2014 and into 2015. We will be developing new campaign components, including a crossing-themed video PSA, along with other materials.
How can you help with the ST3 campaign? There are several ways to ensure these lifesaving safety messages will continue to be shared throughout the transportation community and beyond:
By: Mark Sandifer, FHWA Technology Partnership Programs
Thanks to funding support provided by FHWA's Office of Safety's Accelerating Safety Activities Program (ASAP), Ohio's Local Technical Assistance Program (LTAP) Center is currently developing a series of eLearning modules that describe strategies for reducing the occurrence and severity of roadway departure (RwD) crashes–defined as any non-intersection crash in which a vehicle crosses an edge line, a centerline, or otherwise leaves the traveled way.
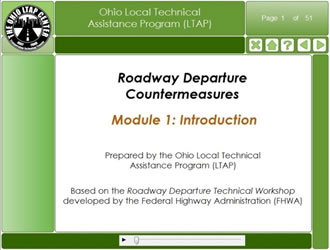
Roadway Departure Countermeasure eLearning Module
Roadway Departure Crashes: A Major Traffic Safety Concern
When a vehicle leaves the road, the results can be deadly: more than half of the annual fatal crashes in the United States relate to roadway departures. Nearly 75 percent of roadway departure fatalities are from the following three crash types:
Roadway departures have also been identified as the leading cause of traffic deaths in Ohio. Nearly 65 percent of the RwD crashes in our State occur in rural areas.
Helping to Share Roadway Safety Information
The new Roadway Departure Countermeasures (RDC) eLearning Series is being developed based on information from FHWA's Roadway Departure Technical Workshop. Part of the development process includes incorporating Ohio-specific crash data and resources.
The first two modules of the RDC series are already available through the Ohio LTAP Center's eLearning website. Module 1 provides an introductory overview of crash data, strategic highway safety planning, roadway departure crash types, and resources for addressing risk factors. Module 2 discusses several implementation approaches that are used to address traffic crash problems, and introduces the Systemic (or Systematic) safety approach. Module 3, which will address signing and delineation treatments, is currently being developed. Additional modules will be published periodically as the eLearning development process continues in 2015.
A New Addition to the Training Toolbox
In recent years, eLearning has become more familiar as an additional information sharing option that can be used to supplement traditional training methods. Developing eLearning content is a multi-step process that often involves a combination of research, instructional design, computer programming, multi-media production, and collaboration with subject matter experts. Although it typically requires a high level of initial time investment for the eLearning developer, it offers the potential benefit of widespread distribution when each lesson or module is completed. One of the goals in publishing the RDC safety information in an eLearning format is to make it widely available for interested persons to quickly and easily access online, and at no cost.
To Learn More …
To access the RDC modules and other eLearning programs that are available free of charge from the Ohio LTAP Center, please visit: http://www.dot.state.oh.us/Divisions/Planning/LocalPrograms/LTAP/Pages/Ohio_LTAP_eLearning.aspx
Additional roadway departure safety information is available online from FHWA's Roadway Departure Safety Program website, at: http://safety.fhwa.dot.gov/roadway_dept/
By: Esther Strawder, FHWA Office of Safety
The roadway safety data and analysis atmosphere is slowly changing for the better in the world of transportation safety. Advances in the science of safety have begun to improve States' ability to make more informed decisions using techniques introduced in the Highway Safety Manual. More states are trying new approaches to safety using data-driven methods and are achieving impressive results in driving down fatalities and serious injuries. Two outstanding examples of data collection in Utah and safety analysis integration in Louisiana are now available on the Roadway Safety Noteworthy Practices database. FHWA has committed to developing a series of case studies that will continue to highlight those states that are ahead of the curve in the roadway safety data and analysis arena.
Utah's case study documents the success Utah Department of Transportation (UDOT) has had with data collection using a combination of Federal and State funding. UDOT surveyed the entire State roadway network and obtained a wide set of data elements. LiDAR (short for "Light Detection and Ranging") was used to collect the asset data, and was also used to create a three-dimensional model of the assets scanned along the roadway. Through this data collection effort, UDOT has improved its budgeting due to the enhanced knowledge of the quantity and quality of roadway assets. UDOT's Traffic and Safety Division has enhanced safety analysis through an improved understanding ofroadway attributes and crash data. The agency's ability to share access to this roadway information also enables divisions to work more closely together.
Louisiana's case study shows how a safety analysis process can be integrated into project development. The Louisiana DOT has improved safety awareness in the department as well as in local agencies by establishing safety review guidelines in the areas of maintenance, design, environment, work zone construction and operations, and local roadway coordination. Safety data analysis is available to support decision makers' compliance with the safety review guidelines in each area. Cost savings, though difficult to quantify precisely, have improved the State's ability to use available funding for safety improvement in multiple contexts, resulting in successful implementation of low-cost alternatives and reduced crash risk during construction.
The Utah case study is available at http://rspcb.safety.fhwa.dot.gov/noteworthy/html/datacollect_ut.aspx?id=135
To view the Louisiana case study, visit http://rspcb.safety.fhwa.dot.gov/noteworthy/html/datacollect_la2.aspx?id=136 FHWA welcomes information from any State or local agency demonstrating success in using safety data and analysis to achieve improved safety results. The Roadway Safety Noteworthy Practices database is designed specifically to highlight your successes, so please feel free to share at the following link:
http://rspcb.safety.fhwa.dot.gov/noteworthy/suggestpractice.aspxTransportation Research Board (TRB) 94th Annual Meeting, January 11-15, 2015, Washington, D.C. (http://tinyurl.com/lp5k2zf). The spotlight theme for the 2015 TRB Annual Meeting is "Corridors to the Future: Transportation and Technology." A number of sessions and workshops will focus on this theme.
ATSSA's 44th Annual Convention & Traffic Expo, San Antonio, Texas, February 21-25, 2014. (http://expo.atssa.com/) The ATSSA Annual Convention and Traffic Expo brings together Roadway Safety professionals and vendors in fields such as pavement marking, computer software, protective clothing, and ITS. Workshops will address a wide range of safety-related topics including mitigating wrong-way driving, pedestrian access in work zones, use of truck-mounted attenuators (TMA) in work zones, work zone performance measures, and pavement markings and features.
2015 NACo Annual Conference, Charlotte, North Carolina, July 10-13, 2015. (http://tinyurl.com/
mr7m7y4) NACo's 80th Annual Conference and Exposition will provide county officials with the opportunity to vote on NACo's policies related to federal legislation and regulation; elect officers; network with colleagues; learn about innovative county programs; find out about issues impacting counties across the country; and view products and services from participating companies and exhibitors.
2015 National Bike Summit, Washington, DC, March 10-12, 2015. (http://bikeleague.org/
content/summit-2015) The theme of the 2015 National Bike Summit is "Bikes+" and reflects how bikes add value in so many ways. This dynamic event will include keynote addresses from top government officials, Members of Congress, and leaders from advocacy and industry and workshops that highlight innovative advocacy ideas and trends from around the country.
2015 Lifesavers National Conference on Highway Safety Priorities, Chicago, Illinois, March 15-17, 2015. (http://tinyurl.com/2b64um) The Lifesavers National Conference brings together a combination of public health and safety professionals, researchers, volunteers, and practitioners from a variety of organizational backgrounds who are committed to sharing best practices, research, and policy initiatives that are proven to work. With more than 80 workshops on a wide variety of safety-related topics, this event is geared towards novice as well as seasoned safety practitioners working at the local, state and national level to address the Nation's most pressing roadway problems.
Join your colleagues from the FHWA Office of Safety in the Exhibit Hall of the Walter E. Washington Convention Center, Booth 457! Learn about our latest programs, pick up materials, get a guided tour of our web-based offerings, and meet our staff!
Exhibit hours:
Scenes from the Office of Safety Exhibit at the 2014 TRB Annual Meeting
is a publication of the U.S. Department of Transportation, Federal Highway Administration.
The Federal Highway Administration publishes the Safety Compass newsletter three times a year. We can be reached at:
FHWA Office of Safety
1200 New Jersey Ave. SE
Room E71-105
Washington, DC 20590
The Safety Compass is available online at the FHWA Office of Safety web site at: http://safety.fhwa.dot.gov/newsletter/safetycompass/.
We welcome your comments and highway safety-related articles. The purpose of this newsletter is to increase highway safety awareness and information and to provide resources to help save lives.
We encourage readers to submit highway safety articles that might be of value to the highway safety community. Send your comments, questions and articles for review electronically to Tara McLoughlin at: tara.mcloughlin@dot.gov

