U.S. Department of Transportation
Federal Highway Administration
1200 New Jersey Avenue, SE
Washington, DC 20590
202-366-4000
The following discussion presents the rationale and supporting evidence for Handbook treatments pertaining to these 24 proven and promising practices:
Proven Practices
Promising Practices
There is broad agreement that right-angle intersections are the preferred design. Decreasing the angle of the intersection makes detection of and judgments about potential conflicting vehicles on crossing roadways much more difficult. In addition, the amount of time required to maneuver through the intersection increases, for both vehicles and pedestrians, due to the increased pavement area. However, there is some inconsistency among reference sources concerning the degree of skew that can be safely designed into an intersection. The Green Book states that although a right-angle crossing normally is desired, an angle of 60 degrees provides most of the benefits that are obtained with a right-angle intersection. Subsequently, factors to adjust intersection sight distances for skewness are suggested for use only when angles are less than 60 degrees (AASHTO, 2011). However, another source on subdivision street design states that: "Skewed intersections should be avoided, and in no case should the angle be less than 75 degrees" (Institute of Transportation Engineers [TEH], 1984). The Traffic Engineering Handbook (TEH, 1999) states that: "Crossing roadways should intersect at 90 degrees if possible, and not less than 75 degrees." It further states that: "Intersections with severe skew angles (e.g., 60 degrees or less) often experience operational or safety problems. Reconstruction of such locations or institution of more positive traffic control such as signalization is often necessary." With regard to intersection design issues on two-lane rural highways, TEH (1999) states that: "Skew angles in excess of 75 degrees often create special problems at stop-controlled rural intersections. The angle complicates the vision triangle for the stopped vehicle; increases the time to cross the through road; and results in a larger, more potentially confusing intersection."
| Applications in Standard Reference Manuals | ||||
|---|---|---|---|---|
| MUTCD (2009) | AASHTO Green Book (2011) | NCHRP 500 - Volume 9 (2004) | NCHRP 279 Intersection Channelization Design Guide (1985) | Traffic Engineering Handbook (2009) |
| Sections 2B.54, 4D.06, 4D.09, 4D.12, 4D.13 |
Pg. 5-9, Final Paragraph Pg. 9-5, 3rd bullet item Pg. 9-10, Final Paragraph Pgs. 9-19, 9-20, Sect. 9.3.3 Multileg Intersections Pgs. 9-25 through 9-27, Sect. 9.4.2 Alignment Pgs. 9-57 through 9-63, Tables 9-15 and 9-16 Pg. 9-82, Sect. on Oblique-Angle Turns Pgs. 9-97 through 9-99, Sects. on Divisional Islands, Refuge Islands, & Island Size and Designation Pg. 9-98 Figure 9-37 Pg. 9-112, Sect. on Oblique-Angle Turns with Corner Islands Pgs. 9-113 through 9-114 Table 9-18 Pg. 9-54, Sect. 9.5.4 Effect of Skew Pg. 9-55, Figure 9-22 Pgs. 9-151 through 9-153, Sect. 9.8.5 Effect of Skew Pg. 9-152 through 9-153, Table 9-28 |
Pgs. V-25-V-26, Sect. on Strategy 3.1 B10: Reduce Intersection Skew Angle |
Pg. 19, Top fig. Pg. 21, Item 5 Pg. 25, Para. 2 Pg. 30, Para. 1 & top three figs. Pg. 31, Para. 3 & bottom left fig. Pgs. 42-44, Sect. on Angle of Intersection Pg. 45, Fig. 4-5 Pg. 71, Top two figs. Pgs. 100-105, Intersct. Nos. 7 -9 Pgs. 148-149, Intersct. No. 35 |
Pg. 243, 5th Principle Pg. 243, Sect. on Alignment Design |
Skewed intersections pose particular problems for aging drivers. Many aging drivers experience a decline in head and neck mobility, which accompanies advancing age and may contribute to the slowing of psychomotor responses. Joint flexibility, an essential component of driving skill, has been estimated to decline by approximately 25 percent in aging adults due to arthritis, calcification of cartilage, and joint deterioration (Smith and Sethi, 1975). A restricted range of motion reduces an aging driver's ability to effectively scan to the rear and sides of his or her vehicle to observe blind spots, and similarly may be expected to hinder the timely recognition of conflicts during turning and merging maneuvers at intersections (Ostrow, Shaffron, and McPherson, 1992). For aging drivers, diminished physical capabilities may affect their performance at intersections designed with acute angles by requiring them to turn their heads further than would be required at a right-angle intersection. This obviously creates more of a problem in determining appropriate gaps. For aging pedestrians, the longer exposure time within the intersection becomes a major concern.
Isler, Parsonson, and Hansson (1997) measured the maximum head rotation of 20 drivers in each of four age groups: less than age 30; ages 40 to 59; ages 60 to 69; and age 70 and older, as well as their horizontal peripheral visual field. The oldest subjects exhibited an average decrement of approximately one-third of head range of movement compared with the youngest group of subjects. The mean maximum head movement (in one direction) was 86 degrees for the youngest drivers, 72 degrees for drivers ages 40 to 59, 67 degrees for drivers ages 60 to 69, and 59 degrees for drivers age 70+. In addition, the percentage of drivers with less than 30 degrees of horizontal peripheral vision increased with increases in age, from 15 percent of the younger driver sample to 65 percent of the drivers age 70+. Three of the oldest drivers had less than 50 degrees of head movement and two of these drivers also had less than 20 degrees of horizontal peripheral vision.
In a survey of aging drivers conducted by Yee (1985), 35 percent of the respondents reported problems with arthritis and 21 percent indicated difficulty in turning their heads to scan rearward while driving. Excluding vision/visibility problems associated with nighttime operations, difficulty with head turning placed first among all concerns mentioned by aging drivers participating in a focus group conducted by Staplin, Harkey, Lococo, and Tarawneh (1997) to examine problems in the use of intersections where the approach leg meets the main road at a skewed angle, and/or where channelized right-turn lanes require an exaggerated degree of head/neck rotation to check for traffic conflicts before merging. Comments about this geometry centered around the difficulty aging drivers experience turning their heads at angles less than 90 degrees to view traffic on the intersecting roadway, and several participants reported an increasing reliance on outside rearview mirrors when negotiating highly skewed angles. However, they reported that the outside mirror is of no help when the roads meet at the middle angles (e.g., 40 to 55 degrees) and a driver is not flexible enough to physically turn to look for traffic.
In an observational field study conducted as a part of the same project, Staplin et al. (1997) found that approximately 30 percent of young/middle-aged drivers (ages 25–45) and young-old drivers (ages 65–74) used their mirrors in addition to making head checks before performing a right-turn-on-red (RTOR) maneuver at a skewed intersection (a channelized right-turn lane at a 65-degree skew). By comparison, none of the drivers age 75 and older used their mirrors; instead, they relied solely on information obtained from head/neck checks. In this same study, it was found that the likelihood of a driver making an RTOR maneuver is reduced by intersection skew angles that make it more difficult for the driver to view conflicting traffic.
The practical consequences of restricted head and neck movement on driving performance at T-intersections were investigated by Hunter-Zaworski (1990), using a simulator to present videorecorded scenes of intersections with various levels of traffic volume and sight distance in a 180-degree field of view from the driver's perspective. Drivers in two subject groups, ages 30–50 and 60–80, depressed a brake pedal to watch a video presentation (on three screens), then released the pedal when it was judged safe to make a left turn; half of each age group had a restricted range of neck movement as determined by goniometric measures of maximum (static) head-turn angle. Aside from demonstrating that skewed intersections are hazardous for any driver with a neck movement impairment, this study found that maneuver decision time increased with both age and level of impairment. Thus, the younger drivers in this study were able to compensate for their impairments, but aging drivers both with and without impairments were unable to make compensations in their (simulated) intersection response selections.
Older and younger driver performance was compared at 10 intersections (5 improved and 5 unimproved) to test the effectiveness of FHWA's recommendations for intersection design to accommodate aging road users (Classen et al., 2007). Thirty-nine drivers ages 25 to 45 and 32 drivers ages 65 to 85 drove an instrumented vehicle on urban and residential streets in Gainesville, FL, accompanied by a front-seat driving evaluator who recorded behavioral errors. The course took approximately 1 hour to complete, and included driving through 5 sets of improved and unimproved intersections. One set of intersections included roadways that met at a 90-degree angle (improved) and roadways that met at an angle less than 75 degrees (unimproved). Both kinematic data (vehicle control responses during the turn phase including longitudinal and lateral accelerations, yaw, and speed) and behavioral data (driving errors including vehicle position, lane maintenance, speed, yielding, signaling, visual scanning, adjustment to stimuli/traffic signs, and left-turn gap acceptance) were recorded. With the exception of speed during the turn, kinematic measures showed significantly better performance associated with the improved intersection, and there were significantly fewer behavioral errors with the improved design. The improved design was associated with lesser side forces, indicating improved lateral stability, and fewer deviations from the idealized curved path during the turn, indicating greater vehicle stability. There were no significant differences between age groups for either the kinematics measures or the behavioral measure.
These research findings reinforce the desirability of providing a 90-degree intersection geometry and support the TEH (1984) recommendation establishing a 75-degree minimum as a practice to accommodate age-related performance deficits, benefiting both older as well as younger drivers.
Lane widths are addressed in the Intersection Channelization Design Guide (Neuman, 1985). A recommendation for (left) turning lanes, which also applies to receiving lanes, is that "12-ft widths are desirable, (although) lesser widths may function effectively and safely. Absolute minimum widths of 9 ft should be used only in unusual circumstances, and only on low-speed streets with minor truck volumes." Similarly, the TEH (1984) guidelines suggest a minimum lane width of 11 ft and specify 12 ft as desirable. These guidelines suggest that wider lanes be avoided due to the resulting increase in pedestrian crossing distances. However, the TEH guidelines provide a range of lane widths at intersections from 9 ft to 14 ft, where the wider lanes would be used to accommodate larger turning vehicles, which have turning paths that sweep a path from 13.6 ft for a single-unit truck or bus up to 20.6 ft for a semitrailer. Thus, wider (12-ft) lanes used to accommodate (right) turning trucks also are expected to benefit (left) turning drivers. Further increases in lane width for accommodation of heavy vehicles may result in unacceptable increases in (aging) pedestrian crossing times, however.
Results of field observation studies conducted by Firestine, Hughes, and Natelson (1989) found that trucks turning on urban roads encroached into other lanes on streets with widths of less than 12 ft. They noted that on rural roads, lanes wider than 12 ft or 13 ft allowed oncoming vehicles on the cross street to move further right to avoid trucks, and shoulders wider than 4 ft allowed oncoming vehicles a greater margin of safety. Lane widths are addressed in the Intersection Channelization Design Guide (Neuman, 1985). A recommendation for (left) turning lanes, which also applies to receiving lanes, is that "12-ft widths are desirable, (although) lesser widths may function effectively and safely. Absolute minimum widths of 9 ft should be used only in unusual circumstances, and only on low-speed streets with minor truck volumes."
| Applications in Standard Reference Manuals | ||
|---|---|---|
| AASHTO Green Book (2011) | NCHRP 279 Intersection Channelization Design Guide (1985) | Traffic Engineering Handbook (2009) |
| Pgs. 3-97 through 3-106, Sect. 3.3.11 Widths for Turning Roadways at Intersections Pg. 9-55, Section 9.6.1 Types of Turning Roadways, Para. 1 Pg. 9-97, Final Two Paragraphs Pg. 9-98, Figure 9-37 |
Pg. 10, Table 2-4 Pg. 57, Para. 5, 1st Bullet Pg. 58, Fig. 4-20 Pg. 63, Sect. on Lane Widths Pg. 69, Sect. on Width of Roadways Pg. 73, Fig. 4-29 Pg. 107, Fig. c Pg. 113, Fig. a Pg. 115, Figs. d-e Pg. 120, Item 3 Pg. 122, Item 2 Pg. 125, Intersct. No. 19 |
Pg. 381, Para. 2 |
Design recommendations for lane width at intersections follow from consideration of vehicle maneuver requirements and their demands on drivers. Positioning a vehicle within the lane in preparation for turning has long been recognized as a critical task (McKnight and Adams, 1970). Swinging too wide to lengthen the turning radius and minimize rotation of the steering wheel ("buttonhook turn") while turning left or right is a common practice of drivers who lack strength (including aging drivers) or are physically limited (McKnight and Stewart, 1990).
Two factors can compromise the ability of aging drivers to remain within the boundaries of their assigned lane during a left turn. One factor is the diminishing ability to share attention (i.e., to assimilate and concurrently process multiple sources of information from the driving environment). The other factor involves the ability to turn the steering wheel sharply enough, given the speed at which they are traveling, to remain within the boundaries of their lanes. Some aging drivers seek to increase their turning radii by initiating the turn early and rounding-off the turn. The result is either to cut across the apex of the turn, conflicting with vehicles approaching from the left, or to intrude upon a far lane in completing the turn.
In an observational field study conducted to determine how aging drivers (age 65 and older) compare with younger drivers during left-turn operations under varying intersection geometries, one variable that showed significant differences in older and younger driver behavior was turning path (Staplin, Harkey, Lococo, and Tarawneh, 1997). Aging drivers encroached into the opposing lane of the cross street (see Figure 69, turning path trajectory number 1) when making the left turn more often than younger drivers at the location where the throat width (equivalent to the lane width) measured 12 ft. Where the throat width measured 23 ft, which consisted of a 12-ft lane and an 11-ft shoulder, there was no significant difference in the turning paths. The narrower throat width resulted in higher encroachments by aging drivers, who physically may have more difficulties maneuvering their vehicles through smaller areas.
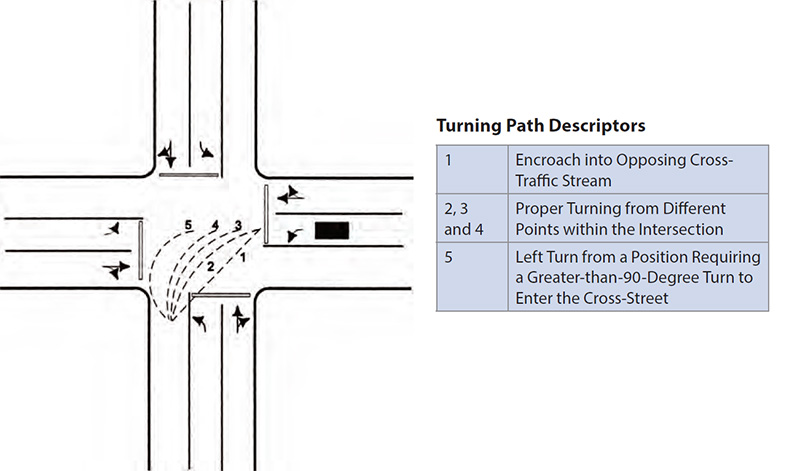
Figure 69. Turning Path Taken by Left-Turning Vehicles (from Staplin et al., 1997)
In a study comparing older and younger driver performance at improved and unimproved intersections to test the effectiveness of FHWA's recommendations for intersection design to accommodate aging road users, Classen et al. (2007) included an intersection where a left-turning vehicle had an extended receiving lane width of at least 12 ft and a forgiving shoulder of 4 ft and an intersection where the receiving lane was less than 12 ft and there was no forgiving shoulder. In this study, 39 drivers ages 25 to 45, and 32 drivers ages 65 to 85 drove an instrumented vehicle on urban and residential streets in Gainesville, FL, accompanied by a front-seat driving evaluator who recorded behavioral errors. The course took approximately 1 hour to complete, and included driving through five sets of improved and unimproved intersections. Both kinematic data (vehicle control responses during the turn phase including longitudinal and lateral accelerations, yaw, and speed) and behavioral data (driving errors including vehicle position, lane maintenance, speed, yielding, signaling, visual scanning, adjustment to stimuli/traffic signs, and left-turn gap acceptance) were recorded. There were significantly fewer behavioral errors with the improved design. The improved design was associated with lesser side forces and fewer deviations from the idealized curved path during the turn, indicating improved lateral control and greater vehicle stability. The increased speed at the improved intersection indicated greater control and confidence during turning. There were no significant differences between age groups for either the kinematics measures or the behavioral measures. The authors concluded that the guidelines for extended receiving lane width at intersections are effective for driver safety, and improve the performance of older as well as younger drivers.
In a retrospective site-based review and crash analysis, that included a detailed investigation of over 400 crashes involving drivers age 65 years and older at 62 sites in Australia, absence of a minimum receiving lane width of 12 ft with a 4 ft shoulder was a contributing factor in 8 percent of the crashes (Oxley, et al., 2006).
These data sources indicate that a 12-ft lane width provides the most reasonable tradeoff between the need to accommodate aging drivers, as well as larger turning vehicles, without penalizing the aging pedestrian in terms of exaggerated crossing distance.
The spatial visual functions of acuity and contrast sensitivity are important in the ability to detect/recognize downstream geometric features such as pavement width transitions, channelized turning lanes, island and median features across the intersection, and any non-reflectorized raised elements at intersections. Visual acuity (the ability to see high-contrast, high-spatial-frequency stimuli, such as black letters on a white eye chart) shows a slow decline beginning at approximately age 40, and marked acceleration at age 60 (Richards, 1972). Approximately 10 percent of men and women between ages 65 and 75 have (best corrected) acuity worse than 20/30, compared with roughly 30 percent over the age of 75 (Kahn, et al., 1977). A driver's response to intersection geometric features is influenced in part by the processing of high-spatial-frequency cues—for example, the characters on upstream advisory signs—but it is the larger, often diffuse edges defining lane and pavement boundaries, curb lines, and raised median barriers that are the targets with the highest priority of detection for safety. Aging persons' sensitivity to visual contrast (the ability to see objects of various shapes and sizes under varying levels of contrast) also declines beginning around age 40, then declines steadily as age increases (Owsley, Sekuler, and Siemsen, 1983). Poor contrast sensitivity has been shown to relate to increased crash involvement for drivers age 66 and older, when incorporated into a battery of vision tests also including visual acuity and horizontal visual field size (Decina and Staplin, 1993).
The effectiveness of channelization from a safety perspective has been documented in several studies. An evaluation of Highway Safety Improvement Program projects showed that channelization produced an average benefit-cost ratio of 4.5 (FHWA, 1996). In this evaluation, roadway improvements consisting of turning lanes and traffic channelization resulted in a 47 percent reduction in fatal crashes, a 26 percent reduction in nonfatal injury crashes, and a 27 percent reduction in combined fatal plus nonfatal injury crashes, at locations where before and after exposure data were available.
One of the advantages of using curbed medians and intersection channelization is that it provides a better indication to motorists of the proper use of travel lanes at intersections. In a set of studies performed by the California Department of Public Works investigating the differences in crash experience with raised channelization versus channelization accomplished through the use of flush pavement markings, the findings were as follows: raised traffic islands are more effective than flush marked islands in reducing frequencies of night crashes, particularly in urban areas; and little difference is noted in the effectiveness of raised versus marked channelizing islands at rural intersections (Neuman, 1985).
One of the most common uses of channelization is for the separation of left-turning vehicles from the through-traffic stream. The safety benefits of left-turn channelization have been documented in several studies. A study by McFarland, et al. (1979) showed that crashes at signalized intersections where a left-turn lane was added, in combination with and without a left-turn signal phase, were reduced by 36 percent and 15 percent, respectively. At non-signalized intersections with marked channelization separating the left-turn lane from the through lane, crashes were reduced for rural, suburban, and urban areas by 50, 30, and 15 percent, respectively. When raised channelization devices were used, the crash reductions were 60, 65, and 70 percent in rural, suburban, and urban areas, respectively. Consistent findings were reported in Hagenauer, et al. (1982).
| Applications in Standard Reference Manuals | |||||
|---|---|---|---|---|---|
| MUTCD (2009) | AASHTO Green Book (2011) | FHWA Lighting Handbook (2012) | NCHRP 500 - Volume 9 (2004) | NCHRP 279 Intersection Channelization Design Guide (1985) | Traffic Engineering Handbook (2009) |
| Sections 1A.13, 3B.03, 3B.05, 3B.09, 3B.10, 3B.20, 3B.23, 3C.02, 3C. 03, 3E. 01, 3G.01, 3H.01, 3I.01 through 3I.06, 5G.03 |
Pg. 4-35, Para. 4 Pg. 7-31, Final two paragraphs Pg. 7-32, Fig. 7-7 Pgs. 9-12 through 9-14, Sect. on Channelized Three-Leg Intersections Pgs. 9-15 through 9-19, Sect. on Channelized Four-Leg Intersections Pgs. 9-95 through 9-112, Sects. on Channelizing Islands, Divisional Islands, Refuge Islands, Island Size and Designation, Island Delineation and Approach Treatment & Right-Angle Turns With Corner Islands Pgs. 9-8 through 9-10, Introductory portion of Sect. 9.3 Types and Examples of Intersections Pgs. 9-92 through 9-94, Sect. 9.6.2 Channelization Pgs. 9-182 through 9-183 Sect. 9.11.7 Midblock Left Turns on Streets with Flush Medians |
Pg. 71, Para. 1-3 Pg. 77, Fig. 47 |
Pgs. V-23 through V-25, Sect. on Strategy 3.1 B9: Replace Painted Channelization with Raised Channelization (P) | Pg. 1, Paras. 2-3 Pg. 21, Fig. 3-1 Pg. 24, Bottom fig. Pg. 25, Para. 3 Pg. 26, Top fig. Pg. 28, Middle fig. Pg. 32, Middle fig. Pg. 34, Para. 1 & bottom fig. Pg. 35, Bottom lef t fig. Pg. 38, Middle fig. Pg. 39, Paras. 2-3 & top two figs. Pg. 69, Sect. on Traffic Islands Pg. 74, Fig. 4-30 Pgs. 75-76, Para. 1 on 1st pg. & Sects. on Guidelines for Design of Traffic Islands, Guidelines for Selection of Island Type, & Guidelines for Design of Median Islands Pg. 79, Fig. 4-34 Pgs. 94-95, Intersct. No. 4 Pgs. 102-103, Intersct. No. 8 Pgs. 106-113, Intersct. Nos. 10-13 Pgs. 116-117, Intersct. No. 15 Pgs. 132-133, Intersct. No. 22 Pgs. 138-139, Intersct. No. 29 Pgs. 148-153, Intersct. Nos. 35-37 |
Pgs. 243, Sect. on Principles of Channelization Pg. 247, Sect. on Traffic Island Design Pg. 381, Para. 1 |
Important considerations in choosing to implement raised versus marked channelization include operating speed and type of maneuver (i.e., left turn versus right turn). Left-turn channelization separating through and turning lanes may, because of its placement, constitute a hazard when a raised treatment is applied, especially on high-speed facilities. Detection and avoidance of such hazards requires visual and response capabilities known to decline significantly with advancing age.
In this same vein, it was reported in Transportation Research Circular 382 (Transportation Research Board, 1991) that the aging driver, having poorer vision, slower physical reaction time, lower degree of awareness, and reduced ability to maneuver the vehicle, is more likely to be negatively affected by a raised median than is the average driver; and, because medians are fixed objects, when they are struck they pose a serious threat of loss of control, especially for aging drivers. The typical curbed median offers low to no contrast with the adjacent pavement and is difficult to reflectorize at night. Low-beam headlight limitations coupled with reduced vision of the aging driver compounds the visibility problem. In addition, raised medians and raised corner islands, when used together, often create turning path options at complex intersections that are confusing to the average driver, and disproportionately so for the aging one. Thus, to realize the safety benefits channelization can provide, it is particularly important to ensure the visibility of raised surfaces for (aging) drivers with diminished vision, so these road users can detect the channelizing devices and select their paths accordingly.
Another benefit in the use of channelization is the provision of a refuge for pedestrians. Refuge islands are a design element that can aid aging pedestrians who have slow walking speeds. With respect to the Hagenauer et al. (1982) study cited earlier, Hauer (1988) stated that because channelization in general serves to simplify an otherwise ambiguous and complex situation, the channelization of an existing intersection might enhance both the safety and mobility of aging persons, as well as enhance the safety of other pedestrians and drivers. However, in designing a new intersection, he stated that the presence of islands is unlikely to offset the disadvantage of large intersection size for the pedestrian.
Staplin, et al. (1997) conducted a field study evaluating four right-turn lane geometries to examine the effect of channelized right-turn lanes and the presence of skew on right-turn maneuvers made by drivers of different ages. One hundred subjects divided across three age groups drove their own vehicles around test routes using the local street network in Arlington, VA. The three age groups were ages 25–45, ages 65–74, and age 75 and older. As diagrammed in Figure 70, the four right-turn lane geometries were:
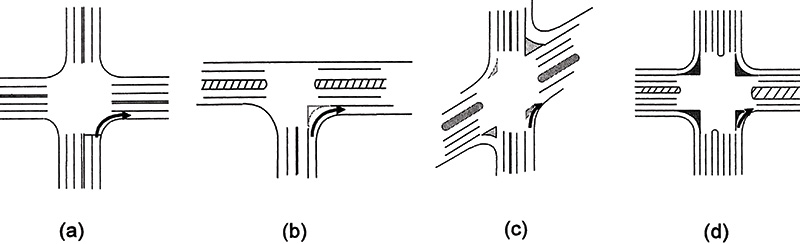
Figure 70. Intersection Geometries Examined in a Field Study of Right-Turn Channelization (Staplin et al., 1997)
The right-turn maneuver at all locations was made against two lanes carrying through (conflicting) traffic. The two through lanes were the only ones that had a direct effect on the right-turn maneuver. All intersections were located on major or minor arterials within a growing urban area, where the posted speed limit was 35 mph. All intersections were controlled by traffic signals with yield control on the three channelized intersections.
The results indicated that right-turn channelization affects the speed at which drivers make right turns and the likelihood that they will stop before making a RTOR. Drivers, especially younger drivers (ages 25–45), turned right at speeds 3–5 mph higher on intersection approaches with channelized right-turn lanes than they did on approaches with non-channelized right-turn lanes.
At the non-channelized intersection, 22 percent of drivers age 25–45, 5 percent of the drivers age 65–74, and none of the drivers age 75 and older performed a RTOR without a stop. On approaches with channelized right-turn lanes, drivers age 25–74 were much less likely to stop before making a RTOR. Where an acceleration lane was available, 65 percent of young/middle-aged drivers continued through without a complete stop, compared with 55 percent of drivers age 65–74 and 11 percent of drivers 75 and older. Female drivers age 75 and older always stopped before a RTOR. The increased mobility exhibited by the two younger groups of drivers at the channelized right-turn lane locations was not, however, exhibited by the drivers age 75 and older, who stopped in 19 of the 20 turns executed at the channelized locations. Also, questionnaire results indicated drivers perceived that making a right turn on an approach with a channelized right-turn lane without an acceleration lane on the cross street was more difficult than at other locations, and even more difficult than at skewed intersections.
Regarding channelization for mid-block left-turn treatments, Bonneson and McCoy (1997) evaluated the safety and operational effects of three mid-block left-turn treatments: raised curb medians; two-way, left turn-lanes; and undivided cross sections. Traffic flow data were collected during 32 field studies in eight cities in four States, and 3-year crash histories for 189 street segments were obtained from cities in two States. The studies were conducted on urban or suburban arterial segments, and therefore treatments can only be applied to such environments that include the following criteria: traffic volume exceeding 7,000 vehicles per day; speed limit between 30 and 50 mph); spacing of at least 350 ft between signalized intersections; direct access from abutting properties; no angle curb parking (parallel parking is acceptable); located in or near a populated area (e.g., population of 20,000 or more); no more than six through lanes (three in each direction); and arterial length of at least 0.75 mi.
In terms of annual delays to major-street left-turn and through vehicles, the raised-curb treatment has slightly higher delays than the TWLTL treatment at the highest left-turn and through volumes, which results from the greater likelihood of bay overflow for the raised-curb median treatment under high-volume conditions. The undivided cross section has significantly higher delays than the raised-curb treatment for all nonzero combinations of left-turn and through volume.
Looking at crash frequencies as a function of mid-block channelization treatment, the raised curb median treatment is associated with the fewest crashes of all three treatment types. Differences between the crash frequencies for TWLTL treatments vs. undivided cross sections are affected by whether or not parallel parking is allowed on the undivided cross section. When parallel parking is allowed on the undivided cross section, the undivided cross section is associated with significantly more crashes than the TWLTL treatment. However, when parallel parking is not allowed, the TWLTL has about the same crash frequency as the undivided cross section at lower traffic volumes.
In general, at mid-block locations, the raised-curb median treatment was associated with fewer crashes than the undivided cross section and TWLTL, especially for average daily traffic demands greater than 20,000 vehicles per day. Also, a benefit of the raised-curb median is that it provides a pedestrian refuge.
Bonneson and McCoy (1997) provide a set of six tables to use as guidelines in considering the conversion of an undivided cross section to a raised curb median, or to a TWLTL, and conversion from a TWLTL to a raised-curb median treatment. In these tables, it is recommended that the existing treatment remain in place when the benefit-cost ratio (in terms of delay and safety) is less than 1.0, and when the benefit-cost ratio exceeds 2.0, it is recommended that the engineer consider adding the alternative treatment.
Bonneson and McCoy (1997) do not report crash frequencies by driver age for one treatment versus another. However, approximately one-fifth of the aging drivers participating in focus group studies conducted by Staplin, et al. (1997) reported that using center two-way left turn lanes (TWLTL), was confusing, risky, and made them uncomfortable, because at times they came face-to-face with an opposing left-turner, and both drivers were stranded. Also mentioned was the difficulty seeing the pavement markings in poor weather (night, fog, rain) when they are less visible, and particularly when they are snow-covered. Drivers referred to TWLTL's as 'suicide lanes." In the same research study, Staplin et al. (1997) reported on a crash analysis that revealed ways in which aging drivers failed to use a TWLTL correctly: a TWLTL was not used for turning at all; and the TWLTL was entered too far in advance of where the turn was to be made.
Because intersections define locations with the highest probability of conflict between vehicles, adequate sight distance is particularly important. Not surprisingly, a number of studies have shown that sight distance problems at intersections usually result in a higher crash rate (Mitchell, 1972; Hanna, Flynn, and Tyler, 1976; David and Norman, 1979). The need for adequate sight distance at an intersection is best illustrated by a quote from the Green Book: "The driver of a vehicle approaching an intersection should have an unobstructed view of the entire intersection, including any traffic-control devices, and sufficient lengths along the intersecting highway to permit the driver to anticipate and avoid potential collisions" (AASHTO, 2011, p. 9-28). AASHTO values (for both uncontrolled and stop-controlled intersections) for available sight distance are measured from the driver's eye height (currently 3.5 ft above the roadway surface) to the object to be seen (currently 3.5 ft above the surface of the intersecting road).
| Applications in Standard Reference Manuals | |||
|---|---|---|---|
| AASHTO Green Book (2011) | FHWA Lighting Handbook (2012) | NCHRP 279 Intersection Channelization Design Guide (1985) | Traffic Engineering Handbook (2009) |
| Pgs. 3-6 through 3-8, Sect. 3.2.3 Decision Sight Distance Pg. 5-21, Para. 6 Pg. 5-22, Para. 1 Pg. 6-9, Para. 7 Pg. 9-25, Para. 2 Pg. 9-27, Para. 2 Pgs. 9-27 through 9-28, Sect. 9.4.3 Profile Pgs. 9-28 through 9-55, Sect. 9.5 Intersection Sight Distance Pg. 9-123, Sect. 9.6.7 Stopping Sight Distance at Intersections for Turning Roadways Pgs. 9-186 through 9-192, Sect. 9.12.4 Sight Distance Pgs. 10-104 through 10-105, Sects. on Terminal Location and Sight Distance, Ramp Terminal Design, & Distance Between a Free-flow Terminal and Structure |
Pg. 20, Figure 8 | Pg. 1, Item , 1st bullet Pg. 10, Table 2-4 Pgs. 13-14, Sect. on Sight Distance Pg. 15, Para. 1 Pg. 27, Bottom right fig. Pg. 30, 2nd fig. from bottom Pg. 31, Para. 3 Pg. 35, Para. 3 & bottom right fig. Pg. 44, Para. 6, item 1 Pg. 45, Table 4-2 Pg. 63, Para. 3, item 3 Pg. 75, Last item 4 Pgs. 99-103, Intersct. Nos. 6-8 Pgs. 106-111, Intersct. Nos. 10-12 |
Pgs. 223-224, Sect. on Intersection Sight Distance Pg. 466, Para. 3 Pg. 631, Sect. on Intersection Sight Distance |
Sight distances at an intersection can be reduced by a number of deficiencies, including physical obstructions too close to the intersection, severe grades, and poor horizontal alignment. The alignment and profile of an intersection have an impact on the sight distance available to the driver and thus affect the ability of the driver to perceive the actions taking place both at the intersection and on its approaches. Since proper perception is the first key to performing a safe maneuver at an intersection, it follows that sight distance should be maximized; this, in turn, means that the horizontal alignment should be straight and the gradients as flat as practical. Horizontal curvature on the approaches to an intersection makes it difficult for drivers to determine appropriate travel paths, because their visual focus is directed along lines tangential to these paths. Kihlberg and Tharp (1968) showed that crash rates increased 35 percent for highway segments with curved intersections over highway segments with straight intersections. Limits for vertical alignment at intersections suggested by AASHTO (2011) and Institute of Transportation Engineers (1984) are 3 and 2 percent, respectively.
Harwood, et al. (1993) stated that the provision of intersection sight distance (ISD) is intended to give drivers an opportunity to obtain the information they need to make decisions about whether to proceed, slow, or stop in situations where potentially conflicting vehicles may be present. They noted that while it is desirable to provide a reasonable margin of safety to accommodate incorrect or delayed driver decisions, there are substantial costs associated with providing sight distances at intersections; therefore, it is important to understand the derivation of ISD requirements and why it is reasonable to expect a safety benefit from tailoring this design parameter to the needs of aging drivers.
Traditionally, the need for—as well as the basis for calculating—sight distance at intersections has rested upon the notion of the sight triangle. As excerpted from NCHRP Report 383, the diagram shown in Figure 71 effectively illustrates how different driver decisions during a (minor) road approach to an intersection (with a major road) depend upon the planned action. The driver's first decision is to either stop or to continue through the intersection (with a turning or a crossing maneuver) according to the type of traffic control information he or she perceives. A red signal or a stop sign results in a 'stop" decision; all other types of information are functionally equivalent at this stage of driver decision making, translating into a "yield" decision. That is, drivers' decisions at this stage are dichotomous: (1) slow down and prepare to stop, regardless of traffic on the major road, or (2) based on their view of the major road, either slow down, maintain speed, or accelerate as required to safely complete their intended maneuver. For drivers who are required to stop, their decision to proceed after the stop also is based on a view of traffic on the major road, but at a point much closer to the intersection. The contrasting sight lines and sight triangles defined by the position of a driver who must stop before proceeding at the intersection, versus one who may proceed without stopping, conditional on the intersecting (major) road traffic, are clearly indicated in Figure 71.

Figure 71. Sight Distance for Left and Right Turns for Passenger Car Drivers at Yield-Control Intersections (Harwood et al., 1993)
For purposes of describing driver decision making, the diagram in Figure 71 may apply to varying aspects of intersection operations in all Cases A through F as per AASHTO (2011) classification. For Case F, however, where a driver is turning left from a major road at an intersection or driveway, the decision process and corresponding sight distance requirements are defined differently. The sight lines in this case are affected by the presence, type (passenger versus heavy vehicle), and location (positioned or un-positioned in the intersection) of opposing left-turning traffic, and by the lateral offset of the opposite left-turn lanes themselves. These relationships are illustrated in Figure 72 from McCoy, Navarro, and Witt (1992).
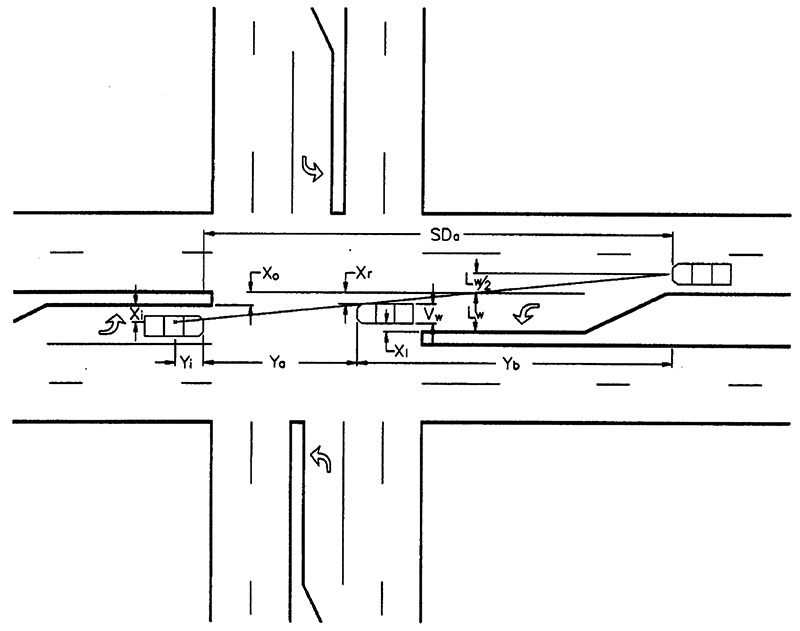
Figure 72. Spatial relationships that determine available sight distance (McCoy et al., 1992)
The rationale for treatments pertaining to intersection sight distance requirements will proceed as follows. First, driver age differences in cognitive and physical capabilities that are relevant to ISD issues will be discussed. Then, research efforts that have attempted to quantify the safety impact of providing adequate sight distance are summarized, plus studies examining the appropriate values for specific components used when calculating sight distance in the AASHTO gap acceptance models. Much of the research cited was conducted on the basis of the PRT models that were included in the Green Book prior to 2001. The discussion emphasizes the need for an increased value of PRT, which translates to a need for an increased gap using the current AASHTO models.
Older road users do not necessarily react more slowly to events that are expected, but they take significantly longer to make decisions about the appropriate response than younger road users, and this difference becomes more exaggerated in complex situations. Although the cognitive aspects of safe intersection negotiation depend upon a host of specific functional capabilities, the net result is response slowing. There is general consensus among investigators that older adults tend to process information more slowly than younger adults, and that this slowing transcends the slower reaction times (Anders, Fozard, and Lillyquist, 1972; Eriksen, Hamlin, and Daye, 1973; Waugh, Thomas, and Fozard, 1978; Salthouse and Somberg, 1982; Byrd, 1984). Of course, a conflict must be seen before any cognitive processing of this sort proceeds. Therefore, any decrease in available response time because of sight distance restrictions will pose disproportionate risks to aging drivers. Slower reaction times for older versus younger adults when response uncertainty is increased has been demonstrated by Simon and Pouraghabagher (1978), indicating a disproportionately heightened degree of risk when aging road users are faced with two or more choices of action. Also, research has shown that aging persons have greater difficulty in situations where planned actions must be rapidly altered (Stelmach, Goggin, and Amrhein, 1988). The difficulty aging persons experience in making extensive and repeated head movements further increases the decision and response times of aging drivers at intersections.
David and Norman (1979) quantified the relationship between available sight distance and the expected reduction in crashes at intersections. The results of this study showed that intersections with shorter sight distances generally have higher crash rates. Using these results, predicted crash reduction frequencies related to ISD were derived as shown in Table 13.
| AADT* (1000s) | Intersection Sight Distance (ft) | ||
|---|---|---|---|
| 20-49 | 50-99 | > 100 | |
| < 5 | 0.18 | 0.20 | 0.30 |
| 5 – 10 | 1.00 | 1.30 | 1.40 |
| 10 – 15 | 0.87 | 2.26 | 3.46 |
| > 15 | 5.25 | 7.41 | 11.26 |
* Annual average daily traffic entering the intersection
Other studies have attempted to show the benefits to be gained from improvements to ISD (Mitchell, 1972; Strate, 1980). Mitchell conducted a before-and-after analysis, with a period of one year on each end, of intersections where a variety of improvements were implemented. The results showed a 67 percent reduction (from 39 to 13) in crashes where obstructions that inhibited sight distance were removed; this was the most effective of the implemented improvements. Strate's analysis examined 34 types of improvements made in Federal Highway Safety Program projects. The results indicated that sight distance improvements were the most cost-effective, producing a benefit-cost ratio of 5.33:1. A report on the FHWA Highway Safety Improvement Programs (1996) indicates that improvements in intersection sight distance have a benefit-cost ratio of 6.1 in reducing fatal and injury crashes. In these analyses, fatal crashes were reduced by 56 percent and nonfatal injury crashes by 37 percent after sight distance improvements were implemented.
Collectively, the studies described above indicate a positive relationship between available ISD and a reduction in crashes, though the amount of crash reduction that can be expected by a given increase in sight distance may be expected to vary according to the maneuver scenario and existing traffic control at the intersection. Procedures for determining appropriate ISDs are provided by AASHTO for various levels of intersection control and the maneuvers to be performed. The scenarios defined are as follows:
Case A: Intersections with No Control. ISD for vehicles approaching intersections with no control, at which vehicles are not required to stop, but may be required to adjust speed.
Case B: Intersections with Stop Control on the Minor Road.
Case C: Intersections with Yield Control. ISD for vehicles on a minor-road approach controlled by a yield sign.
Case D: Intersections with Traffic Signal Control. ISD for two-way flashing operations should be determined by Case B guidance.
Case E: Intersections with All-Way Stop Control. ISD for a vehicle on any approach determined by the location of the first vehicle on all other approaches.
Case F: Left Turns from the Major Road. ISD for a vehicle making a left-turn across the lanes used by opposing traffic.
Prior to 2001, perception-reaction time (PRT) was a key component in determining ISD in all cases defined according to AASHTO (1994). The discussion of this value is still present in chapters 2 and 3 of the Green Book under "Reaction Time" and "Brake Reaction Time," respectively (AASHTO, 2011). Results of several studies (e.g., Normann, 1953; Johansson and Rumar, 1971) are cited, and in conclusion, the 2.5-s value is selected since it was found to be adequate for approximately 90 percent of the overall driver population. Controlled field studies and simulator studies involving aging drivers have confirmed that brake reaction times to unexpected hazards (e.g., a barrel rolling into the road in front of the driver, a vehicle turning in front of a driver who is traveling straight through an intersection) are not significantly different as a function of age, and that virtually all response times are captured by the current 2.5-s AASHTO design parameter for brake perception-response time (Lerner, et al., 1995; Kloeppel, et al., 1995).
With respect to at-grade intersections, the 1994 Green Book recommended the following values of PRT for ISD calculations. In Case I, the PRT is assumed to be 2.0 s plus an additional 1.0 s to actuate braking, although the "preferred design" uses stopping sight distance (SSD) as the ISD design value (which incorporates a PRT of 2.5 s). In Case II, SSD is the design value; thus, the PRT is 2.5 s. For all Case III scenarios and Cases IV and V, the PRT is assumed to be 2.0 s. Refer to Table 14 to cross-reference the 1994 vs. 2011 intersection scenarios.
| Scenario | AASHTO 2011 Case | 1994 AASHTO Case |
|---|---|---|
| No control | Case A | Case I |
| Stop control on minor road | Case B | Case III |
| Left turn maneuver | B1 | III-B |
| Right turn maneuver | B2 | III-C |
| Crossing maneuver | B3 | III-A |
| Yield control on minor road | Case C | Case II |
| Crossing maneuver | C1 | |
| Left or right turn maneuver | C2 | |
| Traffic signal control | Case D | Case IV |
| All-way stop control | Case E | Not included |
| Left turn from major road | Case F | Case V |
Regarding PRT for Cases III and V, the value of 2.0 s assumed by AASHTO (1994) represents the time necessary for the driver to look in both directions of the roadway, to perceive that there is sufficient time to perform the maneuver safely, and to shift gears, if necessary, prior to starting. This value is based on research performed by Johansson and Rumar (1971). The PRT is defined as the time from the driver's first look for possible oncoming traffic to the instant the car begins to move. Some of these operations are done simultaneously by many drivers, and some operations, such as shifting gears, may be done before searching for intersecting traffic or may not be required with automatic transmissions. AASHTO states that a value of 2.0 s is assumed to represent the time taken by the slower driver.
A critique of these values questioned the basis for reducing the PRT from 2.5 s used in SSD calculations to 2.0 s in the Case III ISD calculations (Alexander, 1989). As noted by the author, "The elements of PRT are: detection, recognition, decision, and action initiation." For SSD, this is the time from object or hazard detection to initiation of the braking maneuver. Time to search for a hazard or object is not included in the SSD computation, and the corresponding PRT value is 2.5 s. Yet, in all Case III scenarios, the PRT has been reduced to 2.0 s and now includes a search component which was not included in the SSD computations. Alexander pointed out that a driver is looking straight ahead when deciding to perform a stopping maneuver and only has to consider what is in his/her forward view. At an intersection, however, the driver must look forward, to the right, and to the left. This obviously takes time, especially for those drivers with lower levels of physical dexterity, e.g., aging drivers. Alexander (1989) proposed the addition of a 'search time" variable to the current equations for determining ISD, and use of the PRT value currently employed in the SSD computations (i.e., 2.5 s) for all ISD computations. Neuman (1989) also argued that a PRT of 2.5 s for SSD may not be sufficient in all situations, and can vary from 1.5 s to 5.0 s depending on the physical state of the driver (alert versus fatigued), the complexity of the driving task, and the location and functional class of the highway.
A number of research efforts have been conducted to determine appropriate PRT values for use in ISD computations. Hostetter, et al. (1986) examined the PRT of 124 subjects traversing a 3-hour test circuit which contained scenarios identified above as Cases II, IIIA, IIIB, and IIIC. For the Case II (yield control) scenario, the results showed that in over 90 percent of the trials, subjects reacted in time to meet the SSD criteria established and thus the 2.5-s PRT value was adequate. With respect to Case III scenarios, the PRT was measured from the first head movement after a stop to the application of the accelerator to enter the intersection. The mean and 85th percentile values for all maneuvers combined were 1.82 s and 2.7 s, respectively. The results also showed that the through movement produced a lower value than the mean, while the turning maneuvers produced a higher value. These results led to conclusions that the 2.0-s criteria for Case IIIA be retained and that the PRT value for the Case III turning maneuvers (B and C) be increased from 2.0 to 2.5 s. One other result, which is applicable to the current effort, was that no significant differences were found with respect to age, (i.e., increased PRTs were needed to accommodate all drivers).
Fambro, et al. (1998) found significant differences in mean perception-brake response times as a function of age and gender, with aging drivers and female drivers demonstrating longer response times. They conducted three separate on-road studies to measure driver perception-brake response time to several stopping sight distance situations. Studies were conducted on a closed course as well as on an open roadway. In one study conducted on the closed course, subjects drove an instrumented test vehicle belonging to the Texas Transportation Institute (TTI), and in another closed course study they drove their own vehicles. In the open roadway study, they drove their own vehicles. Seventeen younger drivers (age 24 or under) and 21 older drivers (age 55 or older) participated in trials that required them to brake in response to expected and unexpected events, that included a barrel rolling off of a pickup truck parked next to the roadway, an illuminated LED on the windshield, and a horizontal blockade that deployed ahead of them on the roadway. Across all expected-object, perception-brake response time trials, the mean response time for younger drivers was 0.52 s and the mean response time for older drivers was 0.66 s. For these "expected" trials, the mean perception brake-response time for males was 0.59 s and for females was 0.63 s. For the unexpected-object, perception-brake response trials, longer response times were demonstrated for trials where subjects drove their own vehicles, compared to those in which they drove TTI's vehicle. The study authors suggested that subjects were more relaxed and unsuspecting when driving their own vehicles. The mean response time across studies (controlled and open road, own vehicle and research vehicle) for the unexpected object was 1.1 s; the 95th percentile perception-brake response time was 2.0 s.
Based on this finding, Fambro et al. (1998) concluded that AASHTO's 2.5-s perception-brake reaction time value is appropriate for highway design, when stopping sight distance is the relevant control. However, they note that at locations or for geometric features where something other than stopping sight distance is the relevant control, different perception-reaction times may be appropriate. For example, longer perception-reaction times may be appropriate for intersection or interchange design where more complex decisions and driver speed and/or path correction are required.
Another effort examined the appropriateness of the PRT values currently specified by AASHTO for computing SSD, vehicle clearance interval, sight distance on horizontal curves, and ISD (McGee and Hooper, 1983). With respect to ISD, the results showed the following: for Case I, the driver is not provided with sufficient time or distance to take evasive action if an opposing vehicle is encountered; and for Case II, adequate sight distance to stop before arriving at the intersection is not provided despite the intent of the standard to enable such action. With respect to the PRT values, recommendations include increasing the 2.0-s and 2.5-s values used in Case I and Case II calculations, respectively, to 3.4 s. It was also recommended that the PRT value for Case III scenarios be redefined.
Although there is no consensus from the above studies on the actual values of PRT that should be employed in the ISD computations, there is a very clear concern as to whether the current values are meeting the needs of aging drivers. Since aging drivers tend to take longer in making a decision, especially in complex situations, the need to further evaluate current PRT values is underscored. Slowed visual scanning of traffic on the intersecting roadway by aging drivers has been cited as a cause of near misses of (crossing) crashes at intersections during on-road evaluations. In the practice of coming to a stop, followed by a look to the left, then to the right, and then back to the left again, the aging driver's slowed scanning behavior allows approaching vehicles to have closed the gap by the time a crossing maneuver finally is initiated. The traffic situation has changed when the aging driver actually begins the maneuver, and drivers on the main roadway are often forced to adjust their speed to avoid a collision. Hauer (1988) stated that "the standards and design procedures for intersection sight triangles should be modified because there is reason to believe that when a passenger car is taken as the design vehicle, the sight distance is too short for many aging drivers, who take longer to make decisions, move their heads more slowly, and wish to wait for longer gaps in traffic."
In a retrospective site-based review and crash analysis that included a detailed investigation of over 400 crashes involving drivers age 65 years and older at 62 sites in Australia, Oxley, et al. (2006) identified an insufficient perception-reaction time for intersection sight distance (e.g., a value less than 2.5 s) as a contributing factor in 23 percent of the crashes. This was particularly problematic at intersections controlled by stop and yield signs. The study authors suggest that these findings provide strong support for the argument that longer sight distances at intersections are required to accommodate older drivers, to give them more time to select a safe gap in which to turn across, enter, or cross traffic.
In contrast, research conducted by Lerner, et al. (1995) concluded that, based on older driver performance, no changes to design PRT values were recommended for ISD, SSD, or decision sight distance (DSD), even though the 85th percentile J values exceeded the AASHTO 2.0-s design standard at 7 of the 14 sites. The J value equals the sum of the PRT time and the time to set the vehicle in motion, in seconds. No change was recommended because the experimental design represented a worst-case scenario for visual search and detection (drivers were required to begin their search only after they had stopped at the intersection and looked inside the vehicle to perform a secondary task). Naylor and Graham (1997), in a field study of older and younger drivers waiting to turn left at stop-controlled intersections (Case IIIB), similarly concluded that the current AASHTO value of 2.0 s is adequate for the PRT (J-value) used in calculating intersection sight distance at these sites.
Lerner et al. (1995) conducted an on-road experiment to investigate whether the assumed values for Case III driver PRT used in AASHTO design equations adequately represent the range of actual PRT for aging drivers. Approximately 33 subjects in each of three driver age groups were studied: ages 20–40, ages 65–69, and age 70 and older. Drivers operated their own vehicles on actual roadways, were not informed that their response times were being measured, and were naive as to the purpose of the study (i.e., they were advised that the purpose of the experiment was to judge road quality and how this relates to aspects of driving). The study included 14 data collection sites on a 56-mi route. Results showed that the aging drivers did not have longer PRT than younger drivers, and in fact the 85th percentile PRT closely matched the AASHTO design equation value of 2.0 s. The 90th percentile PRT was 2.3 s, with outlying values of 3 to 4 s. The median daytime PRT was approximately 1.3 s. Interestingly, it was found that typical driver actions did not follow the stop/search/decide maneuver sequence implied by the model; in fact, drivers continued to search and appeared ready to terminate or modify their maneuver even after they had begun to move into the intersection. This finding resulted in the study authors' conclusion that the behavioral model on which ISD is based is conservative.
Harwood, et al. (1996) evaluated current AASHTO policy on ISD for Cases I, II, III, IV, and V during performance of NCHRP project 15-14(1), based on a survey of current highway agencies' practices and a consideration of alternative ISD models and computational methodologies, as well as findings from observational studies for selected cases. Although this work culminated in recommendations for minimum distances for the major and minor legs of the sight triangle for all cases, driver age was not included as a study variable; therefore, specific values for these design elements were not included within the treatments presented in this Handbook, nor is an exhaustive discussion of these materials included in this section. The results of the Harwood et al. (1996) analyses pertaining to ISD for Case IIIB and IIIC—and by extension for Case V—are of particular interest, however, in the interpretation of related findings from an aging driver field study in this area. These analysis outcomes are reviewed below.
Prior to the 1990 AASHTO Green Book, the issue of ISD for a driver turning left off of a major roadway onto a minor roadway or into an entrance (Case V) was not specifically addressed. In the 1990 Green Book, the issue was addressed at the end of the Case III discussions in two paragraphs. In the 1994 Green Book, these same paragraphs have been placed under a new condition referred to as Case V. The equation used for determining ISD for Case V was simply taken from the Case IIIA (crossing maneuver at a stop-controlled intersection) and Case IIIB (left-turn maneuver from a stop-controlled minor road onto a major road) conditions, with the primary difference between the cases being the distance traveled during the maneuver. A central issue in defining the ISD for Case V involves a determination of whether the tasks that define ISD for Cases IIIA and IIIB are similar enough to the tasks associated with Case V to justify using the same equation, which follows:
![]()
where:
For Case IIIA (crossing maneuver), the sight distance is calculated based on the need to clear traffic on the intersecting roadway on both the left and right sides of the crossing vehicle. For Case IIIB (left turn from a stop), sight distance is based on the requirement to first clear traffic approaching from the left and then enter the traffic stream of vehicles from the right. It has been demonstrated that the perceptual judgments required of drivers in both of these maneuver situations increase in difficulty when opposing through traffic must be considered.
The perceptual task of turning left from a major roadway at an unsignalized intersection or during a permissive signal phase at a signalized intersection requires a driver to make time-distance estimates of a longitudinally moving target as opposed to a laterally moving target. Lateral movement (also referred to as tangential movement) describes a vehicle that is crossing an observer's line of sight, moving against a changing visual background where it passes in front of one fixed reference point after another. Longitudinal movement, or movement in depth, results when the vehicle is either coming toward or going away from the observer. In this case there is no change in visual direction, only subtle changes in the angular size of the visual image, typically viewed against a constant background. Longitudinal movement is a greater problem for drivers because the same displacement of a vehicle has a smaller visual effect than when it moves laterally—that is, lateral movement results in a much higher degree of relative motion (Hills, 1980).
In comparison with younger subjects, a significant decline for older subjects has been reported in angular motion sensitivity. In a study evaluating the simulated change in the separation of taillights indicating the overtaking of a vehicle, Lee (1976) found a threshold elevation greater than 100 percent for drivers' ages 70–75 compared with drivers ages 20–29 for brief exposures at night. Aging persons may in fact require twice the rate of movement to perceive that an object is approaching, versus maintaining a constant separation or receding, given a brief duration (2.0 s) of exposure. In related experiments, Hills (1975) found that aging drivers required significantly longer time to perceive that a vehicle was moving closer at constant speed: at 19 mph, decision times increased 0.5 s between ages 20 and 75. This body of evidence suggests that the 2.0-s PRT (i.e., variable J in the ISD equation above) used for Cases III and V may not be sufficient for the task of judging gaps in opposing through traffic by aging drivers. A revision of Case V to determine a minimum required sight distance value which more accurately reflects the perceptual requirements of the left-turn task may therefore be appropriate.
Harwood et al. (1996) suggested that at locations where left turns from the major road are permitted at intersections and driveways, at unsignalized intersections, and at signalized intersections without a protected turn phase, sight distance along the major road should be provided based on a critical gap approach, as was recommended for left and right turns from the minor road at stop-controlled intersections. The Gap Acceptance model developed and proposed to replace the 1994 AASHTO ISD model is:
![]()
where:
Field data were collected in the NCHRP study to better quantify the gap acceptance behavior of passenger car and truck drivers, but only for left- and right-turning maneuvers from minor roadways controlled by a STOP sign (Cases IIIB and C). In the Phase I interim report produced during the conduct of the NCHRP project, Harwood et al. (1993) reported that the critical gap currently used by the California Department of Transportation is 7.5 s. When AASHTO Case IIIB ISD criteria were translated to time gaps in the major road traffic stream, the gaps ranged from 7.5 s (220 ft at a 20-mph operating speed to 15.2 s (1,560 ft) at a 70-mph operating speed. Harwood et al. (1993) stated that the rationale for gap acceptance as an ISD criterion is that drivers safely accept gaps much shorter than 15.2 s routinely, even on higher speed roadways.
In developing the Gap Acceptance model for Case V, Harwood et al. (1996) relied on data from studies conducted by Kyte (1995) and Micsky (1993). Kyte (1995) recommended a critical gap value of 4.2 s for left turns from the major road by passenger cars for inclusion in the unsignalized intersection analysis procedures presented in the Highway Capacity Manual (Transportation Research Board, 1994). A constant value was recommended regardless of the number of lanes to be crossed; however, a heavy-vehicle adjustment of 1.0 s for two-lane highways and 2.0 s for multilane highways was recommended. Harwood et al. (1996) reported that Micsky's 1993 evaluation of gap acceptance behavior for left turns from the major roadway at two Pennsylvania intersections resulted in critical gaps with a 50 percent probability of acceptance (determined from logistic regression) of 4.6 s and 5.3 s. Using the rationale that design policies should be more conservative than operational criteria such as the Highway Capacity Manual, Harwood et al. (1996) recommended a critical gap for left turns from the major roadway of 5.5 s, and an increase in the critical gap to 6.5 s for left turns by single-unit trucks and to 7.5 s for left turns by combination trucks. In addition, if the number of opposing lanes to be crossed exceeds one, an additional 0.5 s per additional lane for passenger cars and 0.7 s per additional lane for trucks was recommended.
It is important to note that the NCHRP study did not consider driver age as a variable. However, Lerner et al. (1995) collected judgments about the acceptability of gaps in traffic as a function of driver age for left turn, right turn, and through movements at stop-controlled intersections. While noting that these authors found no significant differences between age groups in the total time required to perceive, react, and complete a maneuver in a related Case III PRT study, the Lerner et al. (1995) findings indicate that younger drivers accept shorter gaps than older drivers. The 50th percentile gap acceptance point was about 7 s (i.e., if a gap is 7 s long, only about half of the subjects would accept it). The 85th percentile point was approximately 11 s. The oldest group required about 1.1 s longer than the youngest group.
Staplin, et al. (1997) conducted an observational field study of driver performance as a function of left-turn lane geometry and driver age at four locations where the main road operating speed was 35 mph. The mean left-turn critical gap sizes across all sites, for drivers who had positioned their vehicles within the intersection, were as follows: 5.90 s for the young/middle-aged (ages 25–45) females; 5.91 s for the young/middle-aged males; 6.01 s for the young-old (ages 65–74) females; 5.84 s for the young-old males; 6.71 s for the old-old (age 75 and older) females; and 6.55 s for the old-old males. Prominent trends indicated that aging drivers demonstrated larger critical gap values at all locations. The young/middle-aged and young-old groups were not significantly different from each other; however, both were significantly different from the old-old group. Critical gap data were not collected in this study for drivers who did not position themselves within the intersection, but it is important to note that the older drivers were less likely to position themselves within the intersection than the young and middle-aged drivers.
Critical gap sizes displayed in a laboratory simulation study in the same project, where oncoming vehicles traveling at 35 mph were viewed on a large screen display in correct perspective, ranged from 6.4 s to 8.1 s for young/middle-aged drivers and from 5.8 to 10.0 s for drivers age 75 and older. This increase in size and variability of the critical gap for left turns by aging drivers suggests that the value for G in the Gap Acceptance model must be increased to accommodate this user group, beyond levels recommended in NCHRP 383 (where the performance of aging drivers, per se, was not at issue).
The culmination of this work was a rigorous exercise of competing models and theoretical approaches for calculating sight distance requirements. As reported by Staplin et al. (1997), several different sight distance models were exercised using data collected in the observational field study. This study was conducted at four intersections which differed in the amount that the opposite left-turn lanes were offset. The goal was to determine which model(s), including existing and modified 1994 AASHTO models and a Gap Acceptance model (which is the current 2004 AASHTO model) best predicted the data observed in the field.
Several data elements collected in the field received special attention. One of these data elements was the maneuver time of the left-turning driver. This time is equivalent to ta in the 1994 AASHTO model, as shown in Figure IX-33 in the AASHTO (1994) Green Book. These times were measured at each of four intersections included in the study, for positioned and un-positioned drivers. That is, separate maneuver-time measures were obtained, depending on whether the drivers positioned themselves within the intersection prior to turning. Staplin et al. (1997) found no significant differences in maneuver time as a function of age for the drivers turning left at the four intersections studied (which had distances ranging from 84 to 106 ft). Maneuver times for drivers positioned within the intersection versus unpositioned drivers, however, were significantly different. Since aging drivers less frequently positioned themselves in the field study, the design value for this factor (maneuver time) should be based on that obtained for unpositioned drivers.
A comparison between 1994 AASHTO values and the 95th percentile clearance times demonstrated by positioned drivers and unpositioned drivers in this study is presented in Table 15. In Table 15, the "positioned" vehicles were located within the intersection, approaching the median or centerline of the cross street. The "unpositioned" vehicles were at or behind the stop line or end of the left-turn bay. (See Figure 76, located in the discussion for Design Element 5 — Offset Left Turn Lanes, for an illustration of driver positioning within an intersection).
| Vehicle Location | Measure | Left-Turn Lane Geometry | |||
|---|---|---|---|---|---|
| -14 ft Offset | -3 ft Offset | 0 ft Offset | +6 ft Offset | ||
| Positioned | Distance Traveled (ft) | 70 ft | 67 ft | 64 ft | 70 ft |
| Positioned | 95th Percentile Clearance Time (s) From Field Study | 3.8 s | 3.9 s | 3.9 s | 3.9 s |
| Positioned | AASHTO Clearance Time (s) From Figure IX-33 | 5.1 s | 5.0 s | 5.0 s | 5.1 s |
| Unpositioned | Distance Traveled (ft) | 106 ft | 98 ft | 84 ft | 88 ft |
| Unpositioned | 95th Percentile Clearance Time (s) From Field Study | 6.7 s | 6.4 s | 6.6 s | 5.7 s |
| Unpositioned | AASHTO Clearance Time (s) From Figure IX-33 | 6.5 s | 6.2 s | 5.9 s | 6.0 s |
A detailed discussion of the outputs from the model exercise is provided in the publication Intersection Geometric Design and Operational Guidelines for Older Drivers and Pedestrians (Staplin, et al. 1997). However, the most significant result for purposes of this discussion is as follows: the required sight distances computed using a modified 1994 AASHTO model (where PRT was increased to 2.5 s) produced values that were most predictive of actual field operations.
Thus, when ISD is calculated using the AASHTO model as it relates to drivers turning left from a major roadway, there is evidence that the PRT value should be increased to 2.5 s to provide adequate sight distance. The Gap Acceptance model, on the other hand, produced sight distance values that were approximately 23 percent shorter than the current AASHTO model that uses a PRT of only 2.0 s. If the Gap Acceptance model is going to be used, particularly where there are significant volumes of aging left-turning drivers, an adjustment factor applied to increase the sight distance to better accommodate this driver age group therefore appears warranted.
To determine what adjustment is most appropriate in this regard, a set of analyses were performed in which the goal was to identify a value of G that would yield required sight distance values meeting or exceeding those derived from the modified AASHTO model formula (i.e., where J = 2.5 s). By extension, this result would also best match the behavior of drivers 75 and older observed in the field study. Very simply, alternate values for G were substituted into the gap formula for calculating minimum required sight distance (1.47VG). These included 5.5 s, as recommended by Harwood et al. (1996), as well as values which increase in 0.5 s increments. The results of these calculations for alternate values of G, beginning at 7.0 s, are plotted against the required sight distance calculated using the modified AASHTO formula [1.47V(J+ ta); where J=2.5 s and ta is obtained from Table IX-33 in the 1994 Green Book] in Figure 73. As shown in this figure, a gap of 8.0 s affords sight distance for left-turning drivers that equals or exceeds the requirements calculated using the modified AASHTO model for major road design speeds from 20 to 70 mph.
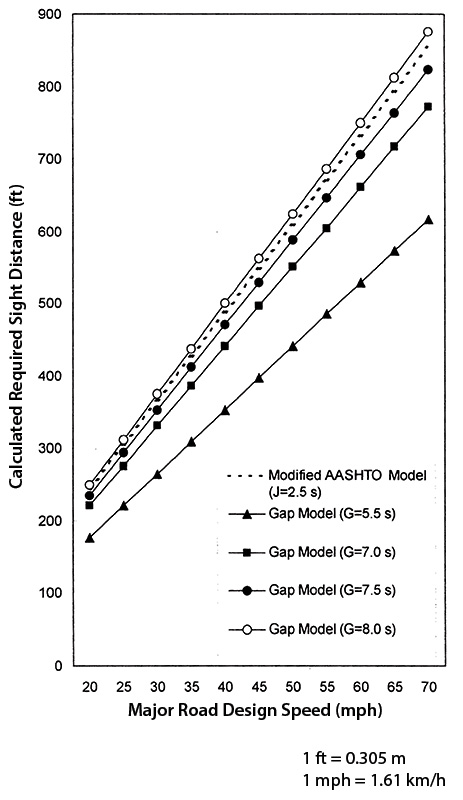
Figure 73. Comparison of Required Intersection Sight Distance Values from the Modified AASHTO Model (with J = 2.5 S) and the Gap Acceptance Model (with Gap Values of 5.5 S, 7.0, 7.5 S, and 8.0 S)
Finally, in a driving simulator study, Yan, Radwan, and Guo (2007) evaluated the effects of age, gender, and major road speed on drivers' left turn gap acceptance judgments at stop-controlled intersections. The study sample included 28 younger subjects (ages 20 to 30), 21 middle-aged subjects (ages 31 to 55), and 14 older subjects (ages 56 to 83). Subjects "drove" along the minor road and stopped at a stop sign at a major road, with approaching vehicle speeds of either 25 mph or 55 mph. Vehicle gap sizes ranged from 1 to 16 s. The driver's task was to wait at the stop sign on the minor road for an appropriate gap to turn into on the major road.
In general, older drivers accepted larger gaps than young and middle-aged drivers (7.94 s vs. 6.29 s and 6.20 s, respectively) and females accepted larger gaps than males (6.93 s vs. 6.38 s, respectively). Oncoming vehicle speed played an important role in the gap size accepted by drivers, with drivers accepting smaller gaps for the higher major road approach speed than for the lower approach speed scenario. This implies that drivers show more sensitivity to oncoming vehicle distance than to oncoming vehicle approach speed. An interaction effect between age and speed showed that for the lower approach speed scenario (25 mph), the older drivers accepted larger gaps (females =10.99 s; males 8.76 s) than the young drivers (females =7.56 s; males = 6.35 s) and middle-aged drivers (females = 6.97 s; males = 6.60 s). However, for the higher-speed approach (55 mph), the minimum gaps accepted by the older drivers (females = 7.11 s; males = 6.23 s) were not significantly larger than the younger drivers (females = 6.0 s; males = 5.26 s). During the process of turning, older drivers turned the steering wheel slower and used smaller acceleration rates to achieve the major road traffic speed than young and middle-aged drivers. The larger gaps that drivers accepted, the slower their accelerations to turn onto the road, reflecting older drivers' conservative driving attitude. Speed reduction rates of following vehicles (to accommodate the turning vehicle) were higher for all driver ages when turning into higher-speed traffic than into lower-speed traffic. However, older drivers contributed to more speed reduction rates on the major road than young and middle-aged drivers, with older females causing the highest speed reduction rates of following vehicles.
The finding that older drivers did not select larger gaps than younger drivers at higher speed roads indicates that they rely exclusively on perceived distance to make gap acceptance judgments. This puts them at a higher crash risk, because at the same time they are causing a shorter separation from the following vehicle, they are steering slower and accelerating slower than the younger drivers, and causing more effects on major road traffic. This suggests that at stop-controlled intersections, older drivers— in particular, older female drivers—are more likely to collide with speeding vehicles approaching on the major road.
Studies examining crashes involving aging drivers and the types of maneuvers being performed just prior to the collision have consistently found this group to be over-involved in left-turning crashes at both rural and urban signalized intersections and have indicated that failure to yield the right-of-way (as the turning driver) was the principal violation type (Staplin and Lyles, 1991; Council and Zegeer, 1992). Underlying problems for the maneuver errors include the misjudgment of oncoming vehicle speed, misjudgment of available gap, assuming the oncoming vehicle was going to stop or turn, and simply not seeing the other vehicle. Joshua and Saka (1992) noted that sight distance problems at intersections which result from queued vehicles in opposite left-turn lanes pose safety and capacity deficiencies, particularly for unprotected (permissive) left-turn movements. These researchers found a strong correlation between the offset for opposite left-turn lanes—i.e., the distance from the inner edge of a left-turn lane to the outer edge of the opposite left-turn lane—and the available sight distance for left-turning traffic.
| Applications in Standard Reference Manuals | ||||
|---|---|---|---|---|
| MUTCD (2009) | AASHTO Green Book (2011) | NCHRP 500 – Volume 9 (2004) | NCHRP 279 Intersection Channelization Design Guide (1985) | Traffic Engineering Handbook (2009) |
| Sections 1A.13 (median, regulatory sign, delineator, stop line, & wrong-way arrow), 2A.23, 2B.03, 2B.37, 2B.38, 2B.40, 2B.41, 2B.42, 3B.04,3B.11, 3B.16, 3B.20, 3B.23, 3F.03, 3G.01, 3I.04 through 3I.06 Table 2B-1 Figures 2A-3, 2B-14 through 2B-16, 2B-18,d 2B-19, 3B-13 a, b & d, 3B-23, 3B-27 |
Pg. 2-39, Para. 3 Pgs. 9-99 through 9-105, Sects. on Island Size and Designation & Island Delineation and Approach Treatment Pgs. 9-133 through 9-138, Sects. on Median Left-Turn Lanes, Median End Treatment, & Offset Left-Turn Lanes |
Pgs. V-19-V-21, Sect. on Strategy 3.1 B6:Provide Offset Left-Turn Lanes at Intersections (T) | Pg. 1, 1st bullet Pg. 3, 2nd col., Para. 5 Pg. 6, Table 2-1 Pg. 10, Table 2-4 & 2nd col., Para. 3 Pg. 14, Sect. on Decision Sight Distance Pg. 17, Middle fig. Pg. 29, Para. 1 Pg. 34, Para. 1 and top fig. Pg. 35, Paras. 2-3 Pg. 60, Middle fig. |
Pgs. 631, Sect. on Intersection Sight Distance Pg. 246, Para. 5 |
The alignment of opposite left-turn lanes and the horizontal and vertical curvature on the approaches are the principal geometric design elements that determine how much sight distance is available to a left-turning driver. Operationally, vehicles in the opposite left-turn lane waiting to turn left can also restrict the (left-turning) driver's view of oncoming traffic in the through lanes. The level of blockage depends on how the opposite left-turn lanes are aligned with respect to each other, as well as the type/size of vehicles in the opposing queue. Restricted sight distance can be minimized or eliminated by offsetting opposite left-turn lanes so that left-turning drivers do not block each other's view of oncoming through traffic. When the two left-turn lanes are exactly aligned, the offset distance has a value of zero. Negative offset describes the situation where the opposite left-turn lane is shifted to the left. Positive offset describes the situation where the opposite left-turn lane is shifted to the right. Figure 74 illustrates the relationships between the opposite left-turn lanes for negative and positive offset lane geometry. Positive offset left-turn lanes and aligned left-turn lanes provide greater sight distances than negative offset left-turn lanes, and a positive offset provides greater sight distance than the aligned configuration.
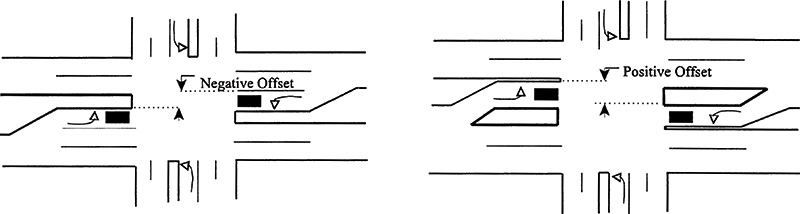
Figure 74. Alignment of Left-Turn Lanes for Negative and Positive Offset
Aging drivers may experience greater difficulties at intersections as the result of diminished visual capabilities such as depth and motion perception, as well as diminished attention-sharing (cognitive) capabilities. Studies have shown that there are age differences in depth and motion perception. Staplin, Lococo, and Sim (1993) found that the angle of stereopsis (seconds of arc) required for a group of drivers age 75 and older to discriminate depth using a commercial vision tester was roughly twice as large as that needed for a group of drivers ages 18 to 55 to achieve the same level of performance. However, while accurate perception of the distance to geometric features delineated at intersections—as well as to potentially hazardous objects such as islands and other raised features—is important for the safe use of these facilities, relatively greater attention by researchers has been placed upon motion perception, where dynamic stimuli (usually other vehicles) are the primary targets of interest. It has been shown that aging persons require up to twice the rate of movement to perceive that an object is approaching, and they require significantly longer to perceive that a vehicle is moving closer at a constant speed (Hills, 1975). A study investigating causes of aging driver over-involvement in turning crashes at intersections, building on the previously reported decline for detection of angular expansion cues, did not find evidence of overestimation of time-to-collision (Staplin et al., 1993). At the same time, a relative insensitivity to approaching (conflict) vehicle speed was shown for older versus younger drivers; this result was interpreted as supporting the notion that older drivers rely primarily or exclusively on perceived distance—not time or velocity—to perform gap acceptance judgments, reflecting a reduced ability to integrate time and distance information with increasing age. Thus, a principal source of risk at intersections is the error of an older, turning driver when judging gaps in front of fast vehicles.
In a retrospective site-based review and crash analysis that included a detailed investigation of over 400 crashes involving drivers age 65 years and older at 62 sites in Australia, limited or restricted sight distance at right turns (equivalent to left turns in the U.S.) contributed to 23 percent of the crashes, and restricted sight distance plus a lack of right-turn offsets (i.e., left-turn offsets in the U.S.) contributed to an additional 10 percent of the crashes (Oxley, et al., 2006).
Several studies examining the minimum required sight distance for a driver turning left from a major roadway to a minor roadway, as a function of major road design speed, have provided data necessary to determine: (1) the left-turn lane offset value needed to achieve the minimum required sight distance; and (2) the offset value that will provide unlimited sight distance. A fundamental premise in these studies, which are described below, is that it is not the amount of left-turn lane offset per se, but rather the sight distance that a given level of offset provides that should be the focus of any recommendations pertaining to the design of opposite left-turn lanes.
In a study conducted by McCoy, Navarro, and Witt (1992), guidelines were developed for offsetting opposite left-turn lanes to eliminate the left-turn sight distance problem. All minimum offsets specified in the guidelines are positive. For 90-degree intersections on level tangent sections of four-lane divided roadways, with 12-ft wide left-turn lanes in 16-ft wide medians with 4-ft wide medial separators, the following conclusions were stated by McCoy et al. (1992): (1) a 2-ft positive offset provides unrestricted sight distance when the opposite left-turn vehicle is a passenger car, and (2) a 3.5-ft positive offset provides unrestricted sight distance when the opposite left-turn vehicle is a truck, for design speeds up to 70 mph.
Harwood, et al. (1995) conducted an observational field study and a crash analysis to develop design policy recommendations for the selection of median width at rural and suburban divided highway intersections based on operational and safety considerations. They found that at rural unsignalized intersections, both crashes and undesirable driving behaviors decrease as median width increases. However, at suburban signalized and unsignalized intersections, crashes and undesirable behaviors increase as the median width increases. At suburban intersections, it is therefore suggested that the median should not generally be wider than necessary to accommodate pedestrians and the appropriate median left-turn treatment needed to serve current and anticipated future traffic volumes. Harwood et al. stated that wider medians generally have positive effects on traffic operations and safety; however, wider medians can result in sight restrictions for left-turning vehicles due to the presence of opposite left-turn vehicles. The most common solution to this problem is to offset the left-turn lanes, using either parallel offset or tapered offset left-turn lanes.
Figure 75 compares conventional left-turn lanes with these two alternative designs. As noted by Harwood et al. (1995), parallel and tapered offset left-turn lanes are still not common, but are used increasingly to reduce the risk of crashes due to sight restrictions from opposite left-turn vehicles. Parallel offset left-turn lanes with 12-ft widths can be constructed in raised medians with widths as narrow as 24 ft, and can be provided in narrower medians if restricted lane widths or curb offsets are used or a flush median is provided (Bonneson, McCoy, and Truby, 1993). Tapered offset left-turn lanes generally require raised medians of 24 ft or more in width.
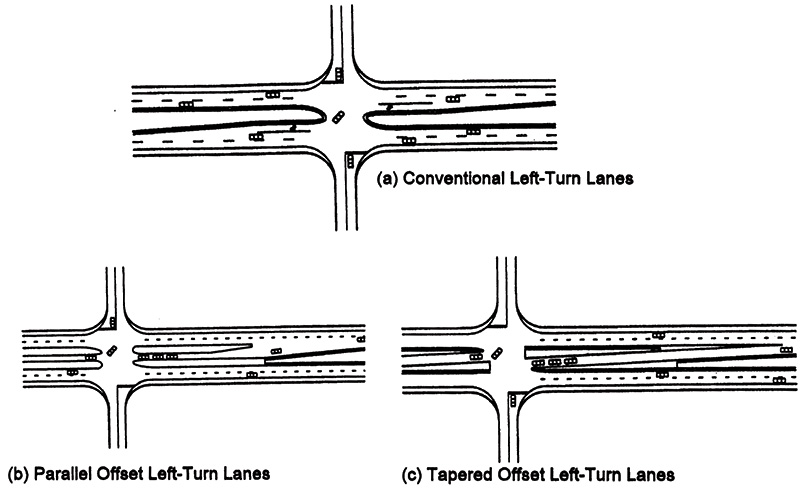
Figure 75. Alternative Left-Turn Treatments for Rural and Suburban Divided Highways (Bonneson et al., 1993)
For separation of the left-turn lane from through traffic in alternative designs such as those discussed above, the practitioner must choose between raised channelization and channelization accomplished through the use of pavement markings. As noted earlier, left-turn channelization separating through and turning lanes may, because of its placement, constitute a hazard when a raised treatment is applied, especially on high-speed facilities. Detection and avoidance of such hazards requires visual and response capabilities known to decline significantly with advancing age, supporting recommendations for treatments to improve the contrast for these channelizing features at intersections (see Design Element 3 — Channelization).
As discussed in some detail under Design Element 4 — Intersection Sight Distance, Staplin, et al. (1997) performed a laboratory study, field study, and sight distance analysis to measure driver age differences in performance under varying traffic and operating conditions, as a function of varying degrees of offset of opposite left-turn lanes at suburban arterial intersections. Research findings indicated that an increase in sight distance through positively offsetting left-turn lanes can be beneficial to left-turning drivers, particularly aging drivers. In the field study, where left-turn vehicles needed to cross the paths of two or three lanes of conflicting traffic (excluding parking lanes) at 90-degree, four-legged intersections, four levels of offset of opposite left-turn lane geometry were examined. These levels include: (a) 6-ft "partial positive" offset, (b) aligned (no offset) left-turn lanes, (c) 3-ft "partial negative" offset, and (d) 14-ft "full negative" offset. All intersections were located within a growing urban area where the posted speed limit was 35 mph. Additionally, all intersections were controlled by traffic-responsive semi-actuated signals, and all left-turn maneuvers were completed during the permissive left-turn phase at all study sites.
In the analysis of the field study lateral positioning data, it was found that the partial positive offset and aligned locations had the same effect on the lateral positioning behavior of drivers. Drivers moved approximately 5 ft to the left when there was a large negative offset, clearly indicating that sight distance was limited. There was a significant difference between the partial negative offset geometry and the partial positive offset or aligned geometries, suggesting a need for longer sight distance when opposite left-turn lanes are even partially negatively offset. The fact that aging drivers (and females) were less likely to position themselves (i.e., pull into the intersection) in the field studies highlights the importance of providing adequate sight distance for unpositioned drivers, for all left-turn designs. Vehicle positioning refers to the location within an intersection at which a left-turning vehicle waits for an acceptable gap in the opposing through traffic stream; specifically, at issue is the positioning behavior of drivers attempting to make a left turn through the conflicting through traffic while being opposed or blocked by at least one vehicle trying to make a left-turn maneuver from the opposite direction. The restriction of sight distance for an unpositioned versus a positioned driver at an intersection with aligned left-turn lanes is shown in Figure 76.
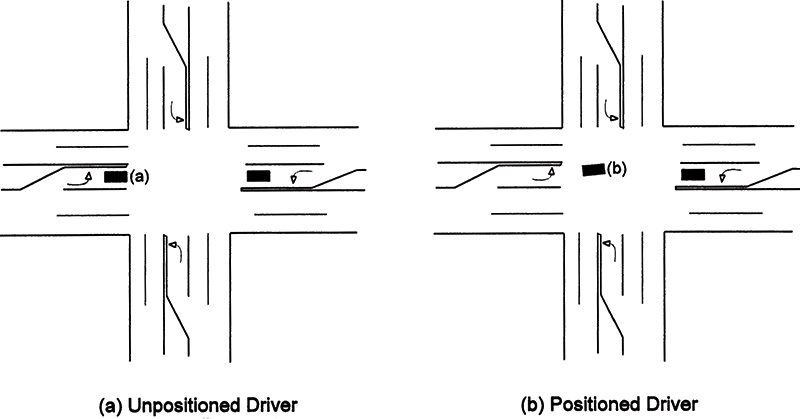
Figure 76. Sight Distance Restrictions for a Positioned and Unpositioned Left-Turning Driver at an Aligned Intersection with an Opposing Left-Turning Vehicle
Shechtman et al. (2007) compared older and younger driver performance at improved and unimproved intersections in a high-fidelity, virtual reality driving simulator to test the effectiveness of FHWA's recommendations for intersection designs to accommodate older road users. In this study, 19 drivers ages 25 to 45, and 20 drivers ages 65 to 85 viewed visual representations of actual intersections on urban and residential streets in Gainesville, FL, and made braking, accelerating, and steering responses using controls integrated into an actual vehicle. A driving evaluator sat in the car and recorded behavioral errors as subjects "drove" through 8 intersections. One of the improved intersections included left-turn lanes offset at 4 to 5 feet to improve the sight distance of oncoming vehicles by the left-turning driver. The comparison unimproved intersection included aligned left-turn lanes, which resulted in restricted sight distance. Both kinematic data (vehicle control responses during the turn phase including longitudinal and lateral accelerations, yaw, and speed) and behavioral data (driving errors including vehicle position, lane maintenance, speed, yielding, signaling, visual scanning, adjustment to stimuli/traffic signs, and left-turn gap acceptance) were recorded. Gap acceptance was also evaluated for left turns. Of the kinematic measures, only maximum yaw was reduced for the improved intersection, for both older and younger drivers, indicating better lateral control of the vehicle for the offset left-turn lanes compared to the aligned left-turn lanes. There were no differences in the other kinematic measures when comparing the two age groups. There were no differences in behavioral errors between the two intersections or between the two age groups. These findings suggest that both older and younger drivers may benefit from increased sight distance offered by offsetting left turn lanes, with better lateral control of their vehicles when negotiating these intersections.
Several issues were raised in the research conducted by Staplin et al. (1997) regarding the adequacy of the 1994 AASHTO and new intersection sight distance (ISD) models for a driver turning left from a major roadway. The researchers exercised alternative sight distance models, including the 1994 AASHTO Case V model using 2.0 s for perception-reaction time (PRT), a modified 1994 AASHTO model using a 2.5-s PRT, and a Gap Acceptance model proposed in NCHRP 383 by Harwood, et al. (1996). The new Gap Acceptance model relies on a critical gap value in place of PRT and maneuver time. A detailed description of the model parameters and output can be found in the FHWA report entitled Intersection Geometric Design and Operational Guidelines for Older Drivers and Pedestrians (Staplin et al., 1997). Of particular significance was the finding that the modified 1994 AASHTO model with the longer PRT of 2.5 s was the model most predictive of actual field operations. Also of significance was the dramatic decrease in required sight distance that occurred with the gap acceptance model compared with the traditional AASHTO model. Across all intersections and all design speeds, the required sight distance was approximately 23 percent less using the gap acceptance model. However, this was expected since the rationale behind the use of a gap acceptance model (cf. Harwood et al., 1996), in place of the 1994 AASHTO model, is the fact that drivers are commonly observed accepting shorter gaps than those implied by the 1994 AASHTO model. As discussed under Design Element 4, subsequent analyses established a recommendation for use of an 8.0-s gap size (plus 0.5 s for each additional lane crossed) to adjust the Gap Acceptance to accommodate aging driver needs for increased sight distance.
Regardless of which model is used to compute ISD for drivers turning left off a major roadway, a practical countermeasure to increase the sight distance is through positive offset of left-turn lanes. As shown in the study by Staplin et al. (1997), such designs result in significantly better performance on the part of all drivers, but especially for aging drivers. Prior work by McCoy et al. (1992) examined the issue of offset left-turn lanes, and developed an approach that could be used to compute the amount of offset that is required to minimize or eliminate the sight restriction caused by opposing left-turn vehicles.
This approach, incorporating the parameters represented in the intersection diagram shown earlier in Figure 72 (see Design Element 4 — Intersection Sight Distance), was applied to the intersections in the study by Staplin et al. (1997) to determine the amount of offset that would be required when using the modified 1994 AASHTO model (i.e., J = 2.5 s). The left-turn lane offsets required to achieve the minimum required sight distances calculated using this model are shown in Figure 77, in addition to the offsets required to provide unrestricted sight distance. Based on intersections examined in the study, the offset necessary to achieve unrestricted sight distance for opposing left-turning cars is 4.1 ft and for opposing left-turning trucks is 5.6 ft.
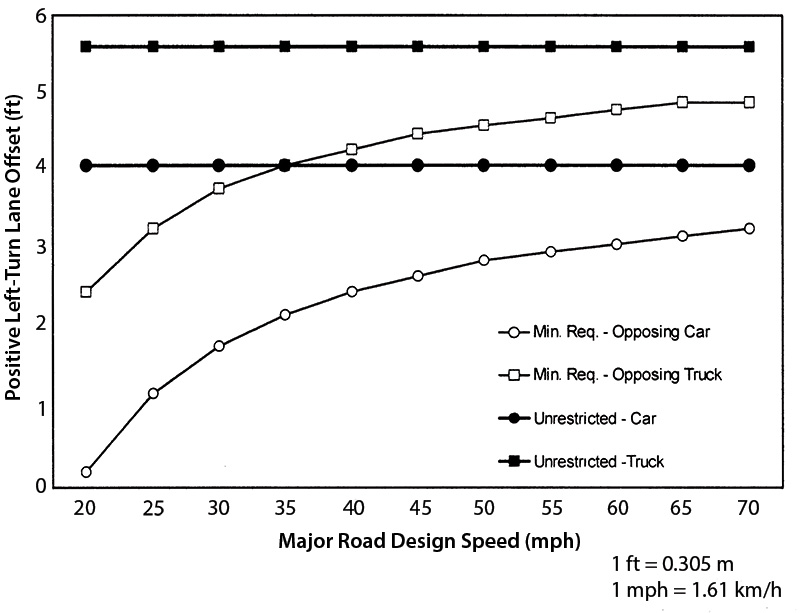
Figure 77. Left-Turn Lane Offset Design Values Necessary to Achieve Unrestricted Sight Distances Calculated with Either the Modified AASHTO Model (J = 2.5 s) or the Gap Acceptance Model (G = 8.0 s)
Finally, the potential for wrong-way maneuvers, particularly by aging drivers, at intersections with positive offset channelized left-turn lanes was raised during a panel meeting comprised of aging driver experts and highway design engineers, during the conduct of the research performed by Staplin et al. (1997). The concern expressed was that drivers turning left from the minor road may turn too soon and enter the channelized left-turn lane, instead of turning around both medians. Similar concern was raised by highway engineers surveyed by Harwood et al. (1995) during the conduct of NCHRP project 15-14(2). These authors reported that the potential for wrong-way movements by opposing-direction vehicles entering the left-turn roadway is minimal if proper signing and pavement markings are used.
Researchers studying wrong-way movements at intersections—particularly the intersection of freeway exits with secondary roads—have found that such movements resulted from left-turning vehicles making an early left turn rather than turning around the nose of the median, and have proposed and tested several countermeasures. Scifres and Loutzenheiser (1975) reported that indistinct medians are design elements that reduce a driver's ability to see and understand the overall physical and operational features of an intersection, increasing the frequency of wrong-way movements. They suggested delineation of the median noses to increase their visibility and improve driver understanding of the intersection design and function. Also, increasing the conspicuity of ONE WAY, WRONG WAY, and DO NOT ENTER signs by using larger-than-standard (MUTCD) size signs, and using retroreflective sheeting on these signs that provides for high brightness at the wide observation angles typical of the sign placements and distances at which these signs are viewed (e.g., 1.0+ degrees) will be of benefit to drivers, particularly those with age-related diminished visual and attentional capabilities. Parsonson and Marks (1979) found that the use of the two-piece, 23.5-ft arrow pavement marking (wrong-way arrow) was effective in preventing wrong-way entries onto freeway exit ramps in Georgia. Later work in this State found a benefit of pulling the nose back from the intersection, and extending the median line from the nose to the intersection using painted markings and raised retroreflectors; this treatment reduced the frequency of impacts with the median by turning vehicles, particularly trucks (per feedback provided by State engineers during a training workshop conducted by Handbook authors on August 6–7, 1998).
The discrimination at a distance of gross highway features, as opposed to the fine detail contained in a sign message, governs drivers' perceptions of intersection geometric elements. Thus, the conspicuity of such elements as curbs, medians, and obstacles, as well as all raised channelization, is of paramount importance in the task of safely approaching and choosing the correct lane for negotiating an intersection, as well as avoiding collisions with the raised surfaces. During the conduct of their driving task analysis, McKnight and Adams (1970a, 1970b) identified five driving tasks related specifically to the conspicuity of intersection geometric elements: (1) maintain correct lateral lane position; (2) survey pavement markings; (3) survey physical boundaries; (4) determine proper lane position for the intended downstream maneuver; and (5) search for path guidance cues. The visual/perceptual requirement common to the performance of these tasks is contrast sensitivity: for detecting lane lines, pavement word and symbol markings, curbs and roadway edge features, and median barriers.
Aging drivers' decreased contrast sensitivity, reduced useful field of view, increased decision time—particularly in response to unexpected events—and slower vehicle control movement execution combine to put these highway users at greater crash risk when approaching and negotiating intersections. The smaller the attentional demand required of a driver to maintain the correct lane position for an intended maneuver, the greater the attentional resources available for activities such as the recognition and processing of traffic control device messages and detection of conflict vehicles and pedestrians.
| Applications in Standard Reference Manuals | ||||
|---|---|---|---|---|
| MUTCD (2009) | AASHTO Green Book (2011) | Roadway Lighting Handbook (1978) | NCHRP 279 Intersection Channelization Design Guide (1985) | Traffic Engineering Handbook (2009) |
| Sect. 1A.13, Edge Line Markings, Island, & Object Marker Sects. 2C.63 through 2C.65 Sect. 3A.06 Sects. 3B.09, 3B.10, 3B.11, 3B.13, & 3B.23 Sect. 3G.01 Sect. 3H.01 Sects. 3I.01 through 3I.06 |
Pg. 2-39, Para. 3 Pg. 3-176, Paras. 3-4 Pgs. 4-17 through 4-19, Sect. on Curb Configurations Pg. 6-15, Para. 3 Pg. 7-32, Para. 3 Pg. 9-19, Para. 2 Pg. 9-18, Fig. 9-9B Pgs. 9-99 through 9-105, Sects. on Island Size and Designation & Island Delineation and Approach Treatment Pgs. 9-106 through 9-112, Sect. on Right-Angle Turns with Corner Islands Pg. 9-148, Sect. on Shape of Median End Pgs. 694-696, Figs. 9-55 through 9-58 Pg. 9-133, Paras. 5-6 Pgs. 9-134 through 9-136, Figs. 9-50 & 9-51 Pgs. 9-137, Sect. on Median End Treatment |
Pg. 2, 2nd col, Para. 1 Pg. 3, Para. 4 Pg. 4, 1st bullet Pg. 9, Sect. on Contrast Pg. 17, Form 1 Pg. 21, Table 1 Pg. 24, Example Form 1 Pgs. 29-30, Sect. on Adverse Geometry and Environment Warrant Pg. 31, Item, A |
Pg. 24, Para. 1 Pg. 35, Para. 2 & bottom left fig. Pg. 39, All figs. Pg. 66, 2nd col., Para. 1 Pgs. 69 & 75, Sects. on Traffic Islands & Guide-lines for Selection of Island Type Pg. 74, Fig. 4-31 Pg. 76, Item 1 Pgs. 102-103, Intersct. No. 8 |
Pg. 382, Sect. on Centerline and Edge Line Markings Pg. 573, Sect. on Marking of Curb Extensions and Edge Islands Pg. 391-392, Sect. on Older Drivers and Pedestrians |
A variety of conspicuity-enhancing treatments are mandated in current practice. The MUTCD (section 3B.10, Approach Markings for Obstructions) specifies that pavement markings shall be used to guide traffic away from fixed objects (such as median islands and raised channelization islands) within a paved roadway. Section 3B.23 (Curb Markings) states that retroreflective solid yellow markings should be placed on the curbs of islands that are located in the line of traffic flow where the curb serves to channel traffic to the right of the obstruction, and that retroreflective solid white markings should be used (on curbs) when traffic may pass on either side of the island. Section 3G.01 (Colored Pavements) describes the use of colored pavements as traffic control devices, where yellow shall be used for median islands and white for channelizing islands, and section 3I.03 (Island Marking Application) describes the use of pavement and curb markings; object markers; and delineators for island marking application. Supplementary treatments, and requirements for in-service brightness levels for certain elements contained in existing guidelines, are presently at issue.
The conspicuity of curbs and medians, besides aiding in the visual determination of how an intersection is laid out, is especially important when medians are used as pedestrian refuges. Care must be taken to ensure that pedestrian refuges are clearly signed and made as visible as possible to passing motorists.
Research findings describing driver performance differences directly affecting the use of pavement markings and delineation focus upon (age-related) deficits in spatial vision. In a pertinent laboratory study conducted by Staplin, Lococo, and Sim (1990), two groups of subjects (ages 19–49 and 65–80) viewing a series of ascending and descending brightness delineation targets were asked to report when they could just detect the direction of roadway curvature at the horizon (roadway heading)—left versus right—from simulated distances of 100 ft and 200 ft. Results showed that the older driver group required a contrast of 20 percent higher than the younger driver group to achieve the discrimination task in this study.
To describe the magnitude of the effects of age and visual ability on delineation detection/recognition distance and retroreflective requirements for threshold detection of pavement markings, a series of analyses using the Ford Motor Company PC DETECT computer model (Matle and Bhise, 1984) yielded the stripe contrast requirements shown in Table 18 (ADI Limited, 1991). PC DETECT is a headlamp seeing-distance model that uses the Blackwell and Blackwell (1971, 1980) human contrast sensitivity formulations to calculate the distance at which various types of targets illuminated by headlamps first become visible to approaching drivers, with and without glare from opposing headlights. The top 5 percent of 25-year-olds (the best-performing younger drivers) and bottom 5 percent of 75-year-olds (the worst-performing older drivers) were compared in this analysis.
| Driver age group/% accommodated | Worst-case glare | No glare |
|---|---|---|
| Age 25 / top5% | 0.11 | 0.05 |
| Age 75 / bottom5% | 7.21 | 3.74 |
Blackwell and Taylor (1969) conducted a study of surface pavement markings employing an interactive driving simulator, plus field evaluations. They concluded that driver performance —measured by the probability of exceeding lane limits—was optimized when the perceived brightness contrast between pavement markings and the roadway was 2.0. A study by Allen, O'Hanlon, and McRuer (1977) also concluded that delineation contrast should be maintained above a value of 2.0 for adequate steering performance under clear night driving conditions. In other words, because contrast is defined as the difference between target and background luminance, divided by the background luminance alone, these studies have asserted that markings must appear to be at least three times as bright as the road surface. Also, because these studies were not specifically focused on the accommodation of aging drivers—particularly the least capable members of this group—the contrast requirements defined in the 1991 modeling studies and analyses, as presented in Table 18, are accorded greater emphasis. Taking the indicated value for the least capable 5 percent of 75-year-olds into account, as well as the prior field evaluations, a contrast requirement of 3.0 for pavement markings appears most reasonable.
It is important to note that, whether luminance is measured in metric or English units [candelas per square meter (cd/m2) or footlamberts (fL)], contrast is a dimensionless number; thus the present recommendations as well as the calculation of contrast level are independent of the unit of measure.
Finally, inadequate conspicuity of raised geometric features at intersections has been brought to the attention of researchers during the conduct of several focus group studies involving aging drivers. Subjects reported difficulty knowing where to drive, due to missing or faded roadway lines on roadway edges and delineation of islands and turning lanes. They also reported hesitating during turns, because they did not know where to aim the vehicle (Staplin, Lococo, and Sim, 1990). In another focus group, subjects suggested that the placement of advance warning pavement markings be located as far in advance of an intersection as practicable (Council and Zegeer, 1992). Drivers ages 66–77 and older participating in focus group discussions conducted by Benekohal, et al. (1992), reported that intersections with too many islands are confusing because it is hard to find which island the driver is supposed to go around. Raised curbs that are unmarked are difficult to see, especially in terms of height and direction, and result in people running over them. These aging drivers stated that they would prefer to have rumble strips in the pavement to warn them of upcoming concrete medians and to warn them about getting too close to the shoulder. In other focus group discussions conducted to identify intersection geometric design features that pose difficulty for aging drivers and pedestrians (Staplin, et al., 1997), drivers mentioned that they have problems seeing concrete barriers in the rain and at night, and characterized barriers as "an obstruction waiting to be hit."
An inventory of the materials and devices commonly employed to delineate roadway edges, curbs, medians, and obstacles includes: retroreflective paint or tape, raised pavement markers (RPM's), post-mounted delineators (PMD's), object markers, and chevron signs.
Recommendations for this design element address the radius of the curb that joins the curbs of adjacent approaches to an intersection. The size of the curb radius affects the size of vehicle that can turn at the intersection, the speed at which vehicles can turn, and the width of intersection that must be crossed by pedestrians. If curb radii are too small, lane encroachments resulting in traffic conflicts and increased crash potential can occur. If the radii are too large, pedestrian exposure may be increased (although, if large enough, refuge islands may be provided). The procedures used in the design of curb radii are well detailed in the Green Book (AASHTO, 2011).
McKnight and Stewart (1990) identified the task of positioning a vehicle in preparation for turning as a critical competency. A significant problem identified in a task analysis to prioritize aging drivers' problems with intersections is carrying out the tight, right-turn maneuver at normal travel speed on a green light (Staplin, et al., 1994). The problems are somewhat moderated when right turns are initiated from a stop, because the turn can be made more slowly, which reduces difficulties with short radii. Aging drivers may seek to increase the turning radius by moving to the left before initiating the turn, often miscommunicating an intention to turn left and encouraging following drivers to pass on the right. Or, they may initiate the turn from the correct position, but swing wide into a far lane in completing the turn in order to lengthen the turning radius and thus minimize rotation of the steering wheel. Encroaching upon a far lane can lead to conflict with vehicles approaching from the right or, on multilane roads, oncoming drivers turning to their left at the same time. The third possibility is to cut across the apex of the turn, possibly dragging the rear wheels over the curb. Each of these shortcomings in lanekeeping can be overcome by a channelized right-turn lane or wider curb radii.
| Applications in Standard Reference Manuals | ||
|---|---|---|
| AASHTO Green Book (2011) | NCHRP 279 Intersection Channelization Design Guide (1985) | Traffic Engineering Handbook (2009) |
| Pgs. 9-83 through 9-92, Sects. on Effect of Curb Radii on Turning Paths & Effect of Curb Radii on Pedestrians Pg. 9-96, Paras. 1-2 Pgs. 9-141 through 9-149, Sect. 9.8.2 Control Radii for Minimum Turning Paths Pgs. 9-149 through 9-151, Sect. on Median Openings Based on Control Radii for Design Vehicles |
Pg. 1, 2nd bullet Pg. 6, Paras. 4-5 Pg. 10, Table 2-4 Pg. 20, Bottom fig. Pg. 21, 2nd col, Item 4 & Fig. 3-1 Pg. 22, 2nd fig from bottom of pg. Pg. 23, Bottom right fig. Pg. 26, Bottom fig. Pg. 35, Para. 2 Pg. 36, Middle fig. & associated notes Pg. 38, Middle fig. & associated notes Pgs. 66-69, Sects. on Corner Radius Design & Radius of Turn Pgs. 70-73, Figs. 4-27 through 4-29 Pg. 77, Fig. 4-32 Pg. 83, Sects. on Driveways Along Major Arterials and Collectors & Consideration of Pedestrians Pgs. 84-87, Figs. 4-37 through 4-39 Pgs. 93-94, Intersct. No. 2 Pgs. 96-97, Intersct. No. 4 Pgs. 122-125, Intersct. Nos. 18-19 Pgs. 128-129, Intersct. No. 20B Pgs. 132-135, Intersct. Nos. 22-23 |
Pg. 247, Sect. on Curb Radius, Paras. 5-6 Pg. 254, first bullet |
Chu (1994) found that relative to middle-aged drivers (ages 25–64), older drivers (age 65 and older) tend to drive larger automobiles and drive at slower speeds. Although large heavy cars are associated with a crash fatality rate that is less than one-quarter of that associated with the smallest passenger cars (Insurance Institute for Highway Safety, 1991) and are, therefore, a wise choice for older drivers who are more frail than their middle-aged counterparts, large vehicles have larger turning radii, which may exacerbate the problems older drivers exhibit in lanekeeping during a turn. Roberts and Roberts (1993) reported that common arthritic illnesses such as osteoarthritis, which affects more than 50 percent of the elderly population, and rheumatoid arthritis, affecting 1 to 2 percent, are relevant to the tasks of turning and gripping the steering wheel. A hand deformity caused by either osteoarthritis or rheumatoid arthritis may be very sensitive to pressure, making the driver unwilling to apply full strength to the steering wheel or other controls. In an assessment of 83 drivers with arthritis, Cornwell (1987) found that 83 percent of the arthritic group used both hands to steer, 7 percent used the right hand only, and 10 percent the left hand only; in this study, more than one-half of the arthritic group required steering modifications, either in the form of power steering or other assistive device such as a smaller steering wheel.
The Intersection Channelization Design Guide (Neuman, 1985) states that intersections on high-speed roadways with smooth alignment should be designed with sufficient radii to accommodate moderate- to high-speed turns. At other intersections, such as in residential neighborhoods, low-speed turns are desirable, and smaller corner radii are appropriate in these cases. Additionally, selection of a design vehicle is generally based on the largest standard or typical vehicle type that would regularly use the intersection. For example, a corner radius of 50 ft will accommodate moderate-speed turns for all vehicles up to WB-50 (combination truck/large semitrailer with an overall length of 55 ft). However, many agencies are designing intersections along their primary systems to accommodate a 70 ft, single trailer design vehicle (C-70). Table 4-8 (p. 66) of the Intersection Channelization Design Guide provides guidelines for the selection of a design vehicle. It further specifies in Table 4-9 the operational characteristics for various corner radii. For example, a corner radius of less than 5 ft is not appropriate even for P design vehicles (passenger cars), whereas a corner radius of 20–30 ft will accommodate a low-speed turn for P vehicles, and a crawl-speed turn for SU vehicles (single unit truck, 30 ft in length) with minor lane encroachment.
Of equal importance to the right-turning design vehicle in determining curb radii is a consideration of pedestrian crossing time, particularly in urban areas. Smaller corner radii (less than 30 ft) can decrease right-turn speeds and reduce open pavement area for pedestrians crossing the street. A consideration of vehicle turning speed and pedestrian crossing distance can contribute to the safe handling of vehicle/pedestrian crossing conflicts (Neuman, 1985). Hauer (1988) noted that "the larger the curb-curve radius, the larger the distance the pedestrian has to cover when crossing the road. Thus, for a sidewalk whose centerline is 6 ft from the roadway edge, a 15-ft corner radius increases the crossing distance by only 3 ft. However, a 50-ft radius increases this distance by 26 ft, or 7 s of additional walking time." Hauer further stated that the following are widely held concerns with the widening of curb radii: (1) the longer the crossing distance, the greater the hazard to pedestrians, even though there may be space for refuge islands when the corner radius is large enough; (2) larger curb radii may induce drivers to negotiate the right turn at a higher speed; and (3) the larger the radius, the wider the turn, which makes it more difficult for the driver and the pedestrian to see each other. For these reasons, the safety of aging persons at intersections, particularly pedestrians, may be adversely affected when large curb radii are provided.
In focus group discussions with 46 drivers ages 65–74 (young-old group) and 35 drivers age 75 and older (old-old group), 74 percent of drivers in each age group reported that tight intersection corner radii posed difficulty in maneuvering through the intersection for the following reasons: (1) there are visibility problem with sharp corners; (2) drivers sometimes hit curbs and median barriers; and (3) with sharp turns, trucks turning left into the adjacent opposing traffic lane end up face-to-face with drivers, requiring them to back up (Staplin, et al. 1997). Approximately 24 percent of the young-old drivers and 34 percent of the old-old drivers suggested that medium rounding is sufficient to facilitate turning maneuvers and is safer than very broadly rounded corners because the latter encourages high-speed turns.
In a design preference study using slides to depict varying radii of corner curb cuts, four alternative curb geometries were presented to 30 drivers ages 65–74 (young-old group) and 30 drivers age 75 and older (old-old group) (Staplin et al., 1997). The four alternative geometries (depicted in Figure 78) were: (1) a simple circular radius of 18 ft; (2) a simple circular radius of 12 m; (3) a simple circular radius of 48 ft; and (4) a three-sided/truncated curve with the center side measuring 54 ft. The alternatives were identically ranked by both groups of drivers: Alternative 3 was consistently preferred, Alternative 4 placed second, Alternative 2 placed third, and Alternative 1 was least preferred. Both young-old and old-old drivers in this study were most concerned about ease of turning, citing the better maneuverability and less chance of hitting the curb as their primary basis of response. The second most common—but also strongly weighted—reason for the preference responses of both groups related to the degree of visibility of traffic on intersecting roadways, possibly explaining the slight preference for Alternative 2 over Alternative 1. Alternatives 3 and 4 both are described by corner curb line geometries offering ease of turning and good visibility; however, isolated responses to the truncated corner geometry (Alternative 4) indicated concerns that providing too much room in the right-turn path might result in a lack of needed guidance information and could lead to a maneuver error, and that it could be harder to detect pedestrians with this design.
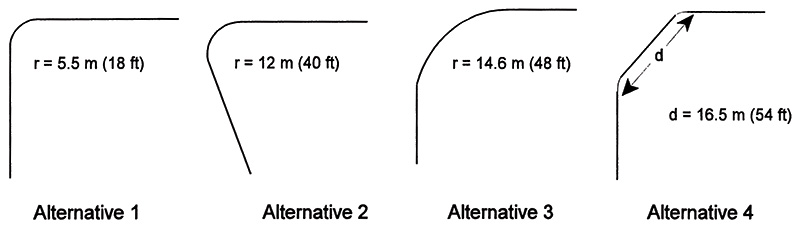
Figure 78. Alternative Curb Radii Evaluated in Laboratory Preference Study of Intersection Geometries (Staplin et al., 1997)
In a field study conducted as part of the same project, three intersections providing right-turn curb radii of 40 ft, 25 ft, and 15 ft were evaluated to examine the effects of curb radii on the turning paths of vehicles driven by drivers in three age groups. One hundred subjects divided across three age groups drove their own vehicles around test routes using the local street network in Arlington, VA. The three age groups were "young/middle-aged" (ages 25–45), which contained 32 drivers; "young-old" (ages 65–74), containing 36 drivers; and "old-old" (age 75 and older), containing 32 drivers. The speed limit was 35 mph and all intersections were located on major or minor arterials within a growing urban area. Data were only collected for turns executed on a green-signal phase.
Analysis of the free-flow speeds showed that all factors (age, gender, and geometry), and their interactions, were significant. Mean free-flow speeds were highest at the largest (40 ft) curb radius location, for all age groups. A consistent finding showed that the slowest mean free-flow speeds were measured at the 15 ft curb radius location for all age groups. Thus, larger curb radii increased the turning speeds of all drivers, with young/middle-aged and young-old drivers traveling faster than old-old drivers when making right turns.
Crash analyses have shown that aging drivers, ages 56–75 and age 76 and older, are overinvolved in left-turn maneuvers at signalized intersections, with failure to yield right-of-way or disregarding the signal the principal violation types (Staplin and Lyles, 1991; Council and Zegeer, 1992). Old-elderly drivers (age 75 and older) were more likely than younger drivers (ages 30–50) to be involved in left-turn crashes at urban signalized intersections, and both young-elderly (ages 65–74) and old-elderly were more likely to be involved in left-turn crashes at rural signalized intersections. In both cases, the crash-involved older drivers were more likely to be performing a left-turn maneuver than the younger drivers. In addition, Stamatiadis, Taylor, and McKelvey (1991) found that the relative crash involvement ratios for aging drivers were higher at two-phase (no turning phase) signalized intersections than for multiphase (includes turn arrow) signalized intersections. This highlights problems aging drivers may have determining acceptable gaps and maneuvering through traffic streams when there is no protective phase. Further, crash percentages increased significantly for aging drivers when an intersection contained flashing controls, as opposed to conventional (red, yellow, green) operations. In this analysis, the greatest crash frequency at signalized intersections occurred on major streets with five lanes, followed closely by roadways containing four lanes. These configurations were most often associated with low-speed, high-volume urban locations, where intersection negotiation requires more complex decisions involving more conflict vehicles and more visually distracting conditions. Not surprisingly, Garber and Srinivasan's (1991) analysis of 7,000 intersection crashes involving drivers ages 50–64 and age 65 and older, found that the provision of a protected left-turn phase will aid in reducing the crash rates of the elderly at signalized intersections.
The change in the angular size of a moving object, such as an approaching vehicle observed by a driver about to turn left at an intersection, provides information crucial to gap judgments (i.e., speed and distance). Age-related declines (possibly exponential) in the ability to detect angular movement have been reported. Aging persons may in fact require twice the rate of movement than younger persons to perceive that an object is approaching, given a brief (2.0 s) duration of exposure. Also, older persons participating in laboratory studies have been observed to require significantly longer intervals than younger persons to perceive that a vehicle was moving closer at constant speed: at 19 mph, decision times increased 0.5 s between ages 20 and 75 (Hills, 1975).
Compounding this age-related decline in motion perception, some research has indicated that, relative to younger subjects, older subjects underestimate approaching vehicle speeds (Hills and Johnson, 1980). Specifically, Scialfa, et al. (1991) showed that older adults tend to overestimate approaching vehicle velocities at lower speeds and underestimate at higher speeds, relative to younger adults. Staplin, Lococo, and Sim (1993), while investigating causes of aging driver over-involvement in turning crashes at intersections, did not find evidence of overestimation of time-to-collision by aging drivers in their perception of the closing distance between themselves and another vehicle approaching either head-on or on an intersecting path. However, a relative insensitivity to approach (conflict) vehicle speed was shown for older versus younger drivers, in that younger drivers adjusted their gap judgment of the "last safe moment" to proceed with a turn appropriately to take higher approach speeds into account, while older drivers as a group failed to allow a larger gap for a vehicle approaching at 60 mph than for one approaching at 30 mph. The interpretation of this and other data in this study was that aging drivers rely primarily or exclusively on perceived vehicle separation distance to reach maneuver "go/no go" decisions, reflecting a reduced ability to integrate time and distance information with increasing age. Thus, a principal source of risk at intersections is the error of an aging, turning driver in judging gaps in front of fast vehicles.
| Applications in Standard Reference Manuals | ||||
|---|---|---|---|---|
| MUTCD (2009) | AASHTO Green Book (2011) | NCHRP 500 – Volume 9 (2004) | NCHRP 279 Intersection Channelization Design Guide (1985) | Traffic Engineering Handbook (2009) |
| Figs. 3B-13b, c, d, 3B-24, & 3B-27 Sect. 1A.13, Approach, Intersection, Lane-Use Control Signal, Regulatory Sign, Sign Legend, & Traffic Control Signal, Table 2B-1 Sects. 2B.18 through 2B.22, 2B.52, 2B.53, 3B.08 & 3B.20 Sect. 4D.04 through 4D. 20, 4D.25 through 4D.31 Sects. 4M.02 through 4M.04 |
Pg. 3-176, Para. 4 Pgs. 9-15 through 9-19, sect. on Channelized Four-Leg Intersections Pg. 10-38, Para. 1 Pg. 10-39, Fig. 10-17 Pgs. 10-42 through 10-47, Sect. on Single-Point Diamond Interchanges |
Pgs. V-12-V-14, Sect. on Strategy 3.1 B2: Provide Advance Guide Signs and Street Name Signs (T) Pgs. V-18-V-19, Sect. on Strategy 3.1 B5: Provide More Protected Left-Turn Signal Phases at High-Volume Intersections (P) |
Pg. 1, Item 3, 4th bullet Pg. 3, 2nd col., Para. 3 Pg. 21, Fig. 3-1 Pg. 28, Top fig. Pg. 29, Top left fig. Pg. 34, Top fig. & associated notes Pg. 37, Top left fig. Pg. 48, Para. 5 & Table 4-3 Pg. 49, Paras. 1, 2, & 4 and 2nd col, item 2 Pg. 54, Fig. 4-16, bottom left photo Pg. 57, Sects. on Double Left-Turn Lanes— Guidelines for Use & Design of Double Left-Turn Lanes Pgs. 58-60, Figs. 4-20 & 4-21 Pgs. 100-101, Intersct. No. 7 Pgs. 104-119, Intersct. Nos. 9-16 Pgs. 132-135, Intersct. Nos. 22-23 Pg. 144, Intersct. No. 33 Pgs. 148-151, Intersct. Nos. 35-36 |
Pgs. 245-246 Pgs. 462-465, Sect. on Turn Lanes Pg. 413-415, Sect. on Left Turns Pgs. 632-634, Sect. on Turn Restrictions |
Aside from (conflict vehicle) motion detection, an additional concern is whether there are age differences in how well drivers understand the rules under which the turns will be made—that is, whether aging drivers have disproportionately greater difficulty in understanding the message that is being conveyed by the signal and any ancillary (regulatory) signs. If the signals and markings are not understood, at a minimum there may be delay in making a turn or, in the worst case, a crash could result if a protected operation is assumed where it does not exist.
A driver comprehension analysis conducted in a laboratory setting with drivers 30–60 years of age and older showed that green displays (those with the circular green indication alone, green arrow alone, or combinations of circular green and green arrow on the left-turn signal) were correctly interpreted with widely varying frequency, depending on the signals shown for the turning and through movements (Curtis, Opiela, and Guell, 1988). In most cases, performance declined as age increased; aging drivers were correct approximately half as often as the youngest drivers. Most driver errors, and especially aging driver errors, indicated signal display interpretations that would result in conservative behavior, such as stopping and/or waiting. Overall, green arrows were better understood than circular green indications. Conversely, red and yellow arrows were less comprehensible than circular red and circular yellow indications. Potentially unsafe interpretations were found for red arrow displays in protected-only operations. The yellow arrow display was more often treated as a last chance to complete a turn when compared with a circular yellow indication. Driver errors were most frequent in displays that involved flashing operations, and multiple faces with different colors illuminated on the left-turn signal head, and in particular, different colors on the turn and through signals.
More specifically, Curtis et al. (1988) found that the circular green indication under permissive control was correctly interpreted by approximately 60 percent of the subjects. For protected-only operations, the green arrow (with circular red for through movement) was correctly answered by approximately 75 percent of drivers. For protected/permissive operation, the circular green alone was correctly answered by only 50 percent of the respondents, while the green arrow in combination with the circular green had approximately 70 percent correct responses. When the circular green with the green arrow was supplemented by the R10-12 sign LEFT TURN YIELD ON GREEN ![]() , only 34 percent of drivers answered correctly. This test result suggests that the MUTCD recommended practice may result in some driver confusion, as test subjects answered correctly more often when the sign was not present, even when the effects of regional differences in familiarity with the sign were considered. Apparently reinforcing this notion, the Maryland State Highway Administration (MSHA, 1993) reported a higher rate of left-turn collisions at three intersections where the R10-12 sign was installed than at three intersections where the sign was not installed. Unfortunately, driver age was not a study variable; also, medians were present (only) at sites with the R10-12 signs, and differences between sites in terms of signal phasing, traffic volumes and delays, and alignment and other aspects of intersection geometry, though noted, were not described. Other researchers have found improved driver comprehension with the use of the R10-12 sign, compared to other messages informing drivers of the decision rule for protected/permissive operations, as described later in this section.
, only 34 percent of drivers answered correctly. This test result suggests that the MUTCD recommended practice may result in some driver confusion, as test subjects answered correctly more often when the sign was not present, even when the effects of regional differences in familiarity with the sign were considered. Apparently reinforcing this notion, the Maryland State Highway Administration (MSHA, 1993) reported a higher rate of left-turn collisions at three intersections where the R10-12 sign was installed than at three intersections where the sign was not installed. Unfortunately, driver age was not a study variable; also, medians were present (only) at sites with the R10-12 signs, and differences between sites in terms of signal phasing, traffic volumes and delays, and alignment and other aspects of intersection geometry, though noted, were not described. Other researchers have found improved driver comprehension with the use of the R10-12 sign, compared to other messages informing drivers of the decision rule for protected/permissive operations, as described later in this section.
When Hummer, Montgomery, and Sinha (1990) evaluated motorists' understanding of left-turn signal alternatives, they found that the protected-only signal was by far the best understood, permissive signals were less understood, and the protected/permissive the least understood. When a circular green for through traffic and a green arrow for left turns were displayed, the protected signal was clearly preferred over the permissive and protected/permissive signals, and the leading signal sequence was preferred more often than the lagging sequence. Respondents stated that the protected-only signal caused less confusion, was safer, and caused less delay than the permissive and protected/permissive signals. It should be noted, however, that while aging persons were in the sample of drivers studied, they made up a very small percentage (8 of 402) and differences were hard to substantiate.
Knoblauch, et al. (1995) examined the lack of understanding associated with a variety of protected and permissive left-turn signal displays. They found that many drivers, both younger and older, do not understand the protected/permissive signal phasing, and they suggested that efforts to improve motorist comprehension of left-turn signal phasing should be targeted at the entire driving population. In focus group discussions, many aging drivers reported that they avoid intersections that do not have a protected-only phase or those where the time allowance for left turns was too short. In addition, the situation where the green arrow eventually turns to a circular green was generally confusing and not appreciated by the aging participants. Among the recommendations made by the aging drivers were:
Provide as many protected left-turn opportunities as possible.
Standardize the sequence for the left-turn green arrow so that it precedes solid green or red.
Lengthen the protected left-turn signal.
Lengthen the left-turn storage lanes so that turning traffic does not block through traffic.
Make traffic signal displays more uniform across the United States, including the warning or amber phase.
Standardize the position and size of signals.
Provide traffic lights overhead and to the side at major intersections.
Paint a yellow line in the pavement upstream of the signal in a manner that, if the driver has not reached the line before the light has turned yellow, he/she cannot make it through before the red light.
Provide borders (backplates) around lights to minimize the effects of glare.
Eliminate holiday decorations located overhead at intersections, because they are often green and red and may be confusing near signal faces.
Bonneson and McCoy (1994) also found a decreased understanding of protected and permissive left-turn designs with increased age, in a survey conducted in Nebraska with 1,610 drivers. In this study, the overlap phase (left-turn green arrow and through circular green illuminated) was the least understood by drivers wishing to turn left, with only one-half of the respondents answering correctly; most of the respondents who erred chose the safer course of action, which was to wait for a gap in oncoming traffic. In terms of signal head location, 4 to 5 percent more drivers were able to understand the protected/permissive display when it was centered in the left-turn lane (exclusive) as opposed to having the head located over the lane line (shared). Although the difference was statistically significant, Bonneson and McCoy point out that the difference may be too small to be of practical significance. In terms of lens arrangement, significantly more drivers understood both the permissive indication and the protected/MUTCD indication (left-turn green arrow and through circular red) in vertical and horizontal arrangements than in the cluster arrangement. Comparisons between the protected/MUTCD indication and a modified protected indication (green arrow with no circular red), showed that for the horizontal protected/permissive designs, 25 percent more drivers were able to understand the protected indication when the circular red was not shown with the green arrow, and for the vertical and cluster protected/permissive designs, 12 percent more drivers understood the modified protected indication. The point is that from an operational perspective, hesitancy as a result of misunderstanding will decrease the level of service and possibly result in crash situations.
Noyce and Kacir (2002) conducted a survey of 2,465 drivers in 8 locations across the U.S. to determine driver understanding of simultaneous traffic signal indications in protected left turn displays. Drivers ranged in age from less than 25 to 65 and older, with 7 percent of the sample over age 65. The survey included 200 different scenarios, of which 68 contained protected left-turn indications. Drivers were shown photographs of left turn displays from various signalized intersections around the country. Each photograph was taken from approximately the driver's eye location as if the driver were positioned as the first left-turn vehicle in queue in an exclusive left-turn lane. Animated signal displays were created and replaced the existing signal displays in each photograph. Five-section protected and permissive left-turn (PPLT) displays in the protected phase illuminated both the green-arrow and through movement (green-ball or red-ball) indications as required by MUTCD. The four and three section displays presented only the green arrow. The drivers were asked to respond to the following question by selecting either GO, YIELD-wait for gap, STOP-then wait for gap, or STOP: "If you want to turn left, and you see the traffic signals shown, you would….". The time duration for each response was also recorded.
In the Noyce and Kacir (2002) study, age played a significant role in the percentage of correct responses when green arrow and red ball indications were shown simultaneously: for drivers less than 24 years of age, 75 percent of responses were correct, and for drivers over the age of 65, 62 percent of responses were correct. The majority of incorrect responses to the 5-section displays with the green arrow and red ball indications were 'stop, then wait for gap," demonstrating some confusion with the simultaneously illuminated indications. Compared to this, for the 65+ age group, when green arrow was shown with green ball, 86 percent of responses were correct, and when green arrow was shown without a green or red ball, 89 percent of responses were correct. When the green-arrow and red-ball indications were shown simultaneously in the 5-section signal display, driver understanding was lowest with the horizontal arrangement. The authors indicate that locating the green arrow to the right of the red-ball indication in a 5-section horizontal display arrangement appears to provide confusion. For the 5-section horizontal display with green arrow and red ball, only 49 percent of drivers age 65 and older gave the correct answer.
Regarding the response times to the signals in the Noyce and Kacir (2002) study, the average response increased with driver age. The 3- and 4-section displays showing only the green arrow, had average driver response times ranging from 3 s for the under-24 age group to 6 s for the over-65 group. However, the difference was more pronounced with the 5-section horizontal display showing a green arrow and red ball simultaneously; in this display, the under-24 age group had an average response time of 5 s, and the over-65 age group had an average response time of 10 s. The average response time for drivers over age 65 was 8 s for the 5-section cluster and vertical displays showing green-arrow and red-ball indications simultaneously. The average response time for the 5-section signal displays showing green-arrow and green-ball indications simultaneously was not different from that for the 3- and 4-section displays showing the green-arrow only indication.
The authors recommended that in a 5-section horizontal display, the green arrow and red ball should not be illuminated simultaneously.
An analysis of sign use by Bonneson an McCoy (1994) compared the exclusive cluster lens arrangement over the left-turn lane and exclusive vertical lens arrangement over the through lanes with and without the use of an auxiliary sign (LEFT TURN YIELD ON GREEN ![]() ). Overall, the results indicated that driver understanding of the display increased by about 6 percent when there was no sign, though a closer examination of these data revealed that the specific operation signaled by the display was critical. For the permissive indication, the sign appeared to help driver understanding, whereas during the overlap and protected indications it appeared to confuse drivers.
). Overall, the results indicated that driver understanding of the display increased by about 6 percent when there was no sign, though a closer examination of these data revealed that the specific operation signaled by the display was critical. For the permissive indication, the sign appeared to help driver understanding, whereas during the overlap and protected indications it appeared to confuse drivers.
Numerous studies have found that: (1) protected left-turn control is the safest, with protected/permissive being less safe than protected, but safer than permissive (Fambro and Woods, 1981; Matthais and Upchurch, 1985; Curtis et al., 1988); and (2) transitions from protected-only operations to protected/permissive operations experience crash increases (Cottrell and Allen, 1982; Florida Section of Institute of Transportation Engineers, 1982; Cottrell, 1985; Warren, 1985; Agent, 1987). According to Fambro and Woods (1981), for every left-turn crash during a protected phase, 10 would have occurred without protection. Before-and-after studies where intersections were changed from protected to permissive control have shown four- to seven-fold increases in left-turn crashes (Florida Section of Institute of Transportation Engineers, 1982; Agent, 1987).
Hallmark and Mueller (2004) conducted a crash analysis to evaluate the impact of different types of left-turn phasing on older and younger drivers at high-speed intersections in Iowa. The sample included 101 intersections with at least one intersecting roadway with a speed limit of 45 mph or higher. Data from 2001 to 2003 were included. The induced exposure method was used to determine crash rate for drivers in three different age groups: 14-24 years old, 25-64 years old, and 65 years and older. Crash rate was calculated by dividing the number of drivers that were credited with a crash in a certain age group by the estimated million entering vehicles (MEV) by approach for that age group. Poisson regression was used to model the relationship between left-turn crash rates with age group, type of phasing (protected, permissive, and protected/permissive), and other site characteristics including opposing volume. Older drivers had the highest left-turn crash rates of all age groups for all types of phasing. For older drivers as well as middle-aged drivers, crash rates were highest at the intersections with protected/permissive phasing, followed by permissive phasing. For the younger drivers, crash rates were highest with permissive phasing, followed by protected/permissive phasing. Protected left-turn phasing produced the lowest crash rates for all three age groups. Drivers may have difficulties with both protected/permissive and permissive phasing since left turns can be made during the permissive phase of both types of phasing. This may be the result of difficulties judging gaps. The high crash rate for protected/permissive phasing may also be a reflection of driver misunderstanding of protected/permissive signal displays. Protected/permissive phasing resulted in the most severe crashes for all age groups (as determined by a severity index) of the three phasing options. Further investigation into these results did not provide any insight into the reasons for the increased severity. Hallmark and Mueller (2004) indicated that left-turn volumes were not included in this study (hence the decision to use induced exposure); that may be one of the reasons why protected/permissive phasing performed worse compared to permissive phasing. Based on their study findings, the authors recommend protective phasing for use at high-speed intersections (e.g., those 45 mph or higher).
In a retrospective site-based review and crash analysis that included a detailed investigation of over 400 crashes involving drivers age 65 years and older at 62 sites in Australasia, the lack of separate traffic control for left-turn movements against oncoming traffic (i.e., no protected turn phase) contributed to 23 percent of the crashes (Oxley, et al., 2006).
Shechtman et al. (2007) found that both older and younger drivers may benefit from the implementation of protected left turn phasing at intersections, resulting in less need for hard accelerations to successfully maneuver across oncoming traffic at an intersection (particularly for older drivers), and better lateral control of their vehicles when negotiating intersections. They compared older and younger driver performance at improved and unimproved intersections in a high-fidelity, virtual reality driving simulator to test the effectiveness of FHWA's recommendations for intersection design to accommodate aging road users. In this study, 19 drivers ages 25 to 45, and 20 drivers ages 65 to 85 viewed visual representations of actual intersections on urban and residential streets in Gainesville, FL, and made braking, accelerating, and steering responses using controls integrated into an actual vehicle. A driving evaluator sat in the car and recorded behavioral errors as subjects "drove" through 8 intersections. One of the improved intersections was a signalized intersection with separate signals for each lane, with a leading protected left-turn phase indicated by a green arrow, and redundant upstream signing. The comparison unimproved intersection was signalized, but did not have separate signals for each lane, nor a protected left-turn phase or redundant signing. The simulator scenario was programmed so that gap acceptance at the unimproved intersection was tested as follows: drivers experienced oncoming traffic with one relatively short gap followed by more traffic and eventually a long gap without any oncoming traffic. Acceptance of the first gap required a rapid increase in speed for successful negotiation. There was no gap acceptance task at the improved intersection controlled by the protected left-turn phase. Both kinematic data (vehicle control responses during the turn phase including longitudinal and lateral accelerations, yaw, and speed) and behavioral data (driving errors including vehicle position, lane maintenance, speed, yielding, signaling, visual scanning, adjustment to stimuli/traffic signs, and left-turn gap acceptance) were recorded.
Of the kinematic measures recorded by Shechtman et al. (2007), maximum yaw and maximum forward acceleration were significantly reduced for the improved intersection, for both older and younger drivers, indicating better lateral control of the vehicle, and more stable forward acceleration. Maximum lateral acceleration approached significance with greater values for the unimproved intersection (indicating poorer lateral control during the turn). There were no differences in maximum speed between the improved and unimproved intersection. Older drivers had significantly higher forward acceleration than the younger drivers, indicating a "panicked" attempt to successfully drive through the gap in oncoming traffic at the unimproved intersection. There were no differences in behavioral errors between the two intersections or between the two age groups.
Williams, Ardekani, and Asante (1992) conducted a mail survey of 894 drivers in Texas to assess motorists' understanding of left-turn signal indications and accompanying auxiliary signs. Drivers older than age 65 had the highest percentage of incorrect responses (35 percent). Results of the various analyses are as follows: (1) the use of a green arrow for protected-only left turns produced better comprehension than the use of a circular green indication, even when the circular green indication was accompanied by an auxiliary sign; (2) for a five-section signal head configuration, the display of a green left-turn arrow in isolation produced better driver understanding than the simultaneous display of a circular red indication and a green left-turn arrow; (3) the LEFT TURN YIELD ON GREEN ![]() auxiliary sign was associated with the smallest percentage of incorrect responses, compared with the LEFT TURN ON GREEN AFTER YIELD sign, the PROTECTED LEFT ON GREEN sign, and the LEFT TURN SIGNAL sign; and (4) the percentage of incorrect responses was 50 percent lower in the presence of a circular red indication compared with a red arrow; the red arrow was often perceived to indicate that a driver may proceed with caution to make a permissive left turn.
auxiliary sign was associated with the smallest percentage of incorrect responses, compared with the LEFT TURN ON GREEN AFTER YIELD sign, the PROTECTED LEFT ON GREEN sign, and the LEFT TURN SIGNAL sign; and (4) the percentage of incorrect responses was 50 percent lower in the presence of a circular red indication compared with a red arrow; the red arrow was often perceived to indicate that a driver may proceed with caution to make a permissive left turn.
In another study conducted by Curtis et al. (1988), it was found that the Delaware flashing red arrow was not correctly answered by any subject. The incorrect responses indicated conservative interpretations of the signal displays which would probably be associated with delay and may also be related to rear-end collisions. Drivers interpreted the Delaware signal as requiring a full stop before turning, because a red indication usually means 'stop," even though the signal is meant to remind motorists to exercise caution but not necessarily to stop unless opposing through traffic is present. Hulbert, Beers, and Fowler (1979) found a significant difference in the percentage of drivers younger than age 49 versus those older than age 49 who chose the correct meaning of the red arrow display. Sixty-one percent of the drivers older than age 49 chose "no turning left" compared with 76 percent of those younger than age 49. Although other research has concluded that the left-turn arrow is more effective than the circular red in some left-turn situations in particular jurisdictions where special turn signals and exclusive turn lanes are provided (Noel, Gerbig, and Lakew, 1982), drivers of all ages will be better served if signal indications are consistent.
Hawkins, Womack, and Mounce (1993) surveyed 1,745 drivers in Texas to evaluate driver comprehension of selected traffic control devices. The sample contained 88 drivers age 65 and older. Three alternative signs describing the left-turn decision rule were evaluated: (1) R10-9, PROTECTED LEFT ON GREEN ARROW (in the Texas MUTCD but not the national MUTCD); (2) R10-9a, PROTECTED LEFT ON GREEN (in the Texas MUTCD but not the national MUTCD); and (3) R10-12, LEFT TURN YIELD ON GREEN ![]() . The R10-12 sign did the best job of the signs in the survey informing the driver of a permissive left-turn condition, with 74.5 percent choosing the desirable response. Of those who responded incorrectly, 13.6 percent responded that they would wait for the green arrow, and 4.3 percent made the dangerous interpretation that the left turn was protected when the circular green was illuminated. Incorrect responses were more often made by drivers age 65 and older.
. The R10-12 sign did the best job of the signs in the survey informing the driver of a permissive left-turn condition, with 74.5 percent choosing the desirable response. Of those who responded incorrectly, 13.6 percent responded that they would wait for the green arrow, and 4.3 percent made the dangerous interpretation that the left turn was protected when the circular green was illuminated. Incorrect responses were more often made by drivers age 65 and older.
The decisional processes drawing upon working memory crucial to safe performance at intersections may be illustrated through a study of alternative strategies for presentation of left-turn traffic control messages (Staplin and Fisk, 1991). This study evaluated the effect of providing advance left-turn information to drivers who must decide whether or not they have the right-of-way to proceed with a protected turn at an intersection. Younger (mean age of 37) and older (mean age of 71) drivers were tested using slide animation to simulate dynamic approaches to intersection traffic control displays, with and without advance cueing of the "decision rule" (e.g., LEFT TURN MUST YIELD ON GREEN ![]() ) during the intersection approach. Without advance cueing, the decision rule was presented only on a sign mounted on the signal arm across the intersection as per standard practice, and thus was not legible until the driver actually reached the decision point for the turning maneuver. Cueing drivers with advance notice of the decision rule through a redundant upstream posting of sign elements significantly improved both the accuracy and latency of all drivers' decisions for a "go/no go" response upon reaching the intersection, and it was of particular benefit to the older test subjects. Presumably, the benefit of upstream "priming" is derived from a reduction in the requirements for serial processing of concurrent information sources (sign message and signal condition) at the instant a maneuver decision must be completed and an action performed.
) during the intersection approach. Without advance cueing, the decision rule was presented only on a sign mounted on the signal arm across the intersection as per standard practice, and thus was not legible until the driver actually reached the decision point for the turning maneuver. Cueing drivers with advance notice of the decision rule through a redundant upstream posting of sign elements significantly improved both the accuracy and latency of all drivers' decisions for a "go/no go" response upon reaching the intersection, and it was of particular benefit to the older test subjects. Presumably, the benefit of upstream "priming" is derived from a reduction in the requirements for serial processing of concurrent information sources (sign message and signal condition) at the instant a maneuver decision must be completed and an action performed.
Stelmach, Goggin, and Garcia-Colera (1987) found that aging adults were particularly impaired when preparation was not possible, showing disproportionate response slowing when compared with younger subjects. When subjects obtained full information about an upcoming response, reaction time (RT) was faster in all age groups. Stelmach et al. (1987) concluded that aging drivers may be particularly disadvantaged when they are required to initiate a movement in which there is no opportunity to prepare a response. Preparatory intervals and length of precue viewing times are determining factors in age-related differences in movement preparation and planning (Goggin, Stelmach, and Amrhein, 1989). When preparatory intervals are manipulated in a way that aging adults have longer stimulus exposure and longer intervals between stimuli, they profit from the longer inspection times by performing better and exhibiting less slowness of movement (Eisdorfer, 1975; Goggin et al., 1989). Since aging drivers benefit from longer exposure to stimuli, Winter (1985) proposed that signs should be spaced farther apart to allow drivers enough time to view information and decide what action to take. Increased viewing time will reduce response uncertainty and decrease aging drivers' RT.
Differences in maneuver decisions reported by Staplin and Fisk (1991) illustrate both the potential problems aging drivers may experience at intersections due to working memory deficits, and the possibility that such consequences of normal aging can to some extent be ameliorated through improved engineering design practices. Staplin and Fisk (1991) also showed that aging drivers had higher error rates and increased decision latencies for situations where the left turn was not protected. In particular, the most problematic displays were those with only one steady illuminated signal face (circular green) accompanied by a sign that indicated that it was not safe to proceed into the intersection with the assumption of right-of-way (LEFT TURN YIELD ON GREEN ![]() ). A correct response to this combination depends on the inhibition of previously learned "automatic" responses; a signal element with one behavior (go) was incorporated into a traffic control display requiring another, conflicting behavior.
). A correct response to this combination depends on the inhibition of previously learned "automatic" responses; a signal element with one behavior (go) was incorporated into a traffic control display requiring another, conflicting behavior.
Several evaluations of a novel left-turn display for the permissive phase—the flashing yellow arrow (FYA)— have been conducted. Brehmer, et al. (2003) conducted a laboratory study using 2,465 drivers in 4 age groups: < age 24 (27%); 25-44 (44%); 45-65 (21%); and 66+ (7%). Photographs of existing signalized intersections were presented to drivers at driver license centers using laptop computers. Combinations of protected left-turn indications, permissive left-turn indications, through-movement indications, and protected/permissive left-turn signal display arrangements were shown against these background intersection scenes. Each driver was randomly presented with 30 of the 200 unique scenarios developed for the study. Subjects were instructed to use the computer keyboard to select which of four options was appropriate if the person wanted to turn left and saw the traffic signals presented. The four options were: (1) GO, (2) YIELD and wait for gap, (3) STOP then wait for gap, and (4) STOP. Measures of effectiveness included percent of correct responses to the study scenarios and response time. Response time data were collected as a surrogate measure of driver understanding (longer response times would connote lower levels of driver understanding). Aging drivers provided the fewest correct responses across all display combinations of all age groups: Age 66+ = 67.3% correct, age 45-65 = 71.1% correct; age 24-44 = 73.1% correct, age 24=72.2% correct. Drivers age 66+ had longer response times (2 to 4 seconds of additional time) compared to drivers less than age 24. For the permissive indications across all age groups, the circular green ball had the fewest correct responses at 50.4%, followed by the flashing red arrow (55.6% correct) and the flashing yellow arrow (56.6% correct). The flashing red ball had the highest correct response rate (63.8%), followed by the flashing yellow ball (61.7%). Response times were faster for the flashing permissive indications than for the solid indications, and circular indications were better understood than arrow indications. Drivers age 66+ had low correct response rates (29%) for the permissive circular green ball when shown with the red through indication. Seventy percent of drivers age 66+ responded correctly to the flashing circular red permissive left-turn indication. Although the correct response rate (across age groups) was higher for the flashing yellow arrow than for the steady green ball, there were 2 other indications that had even higher percent-correct response rates than the flashing yellow arrow: the flashing red ball and the flashing yellow ball.
More recently, Noyce, Bergh, and Chapman (2007) conducted a field study of crashes using 50 signalized intersections with at least 1 year of data after the implementation of flashing yellow arrow. Out of the 50 signalized intersections where the flashing yellow arrow was introduced, in 5 of the locations the phasing was permissive and the round green was replaced by flashing yellow arrow. Twenty-one of the signalized intersections had protected/permissive left-turn (PPLT) phasing, where the round green was replaced by flashing yellow arrow. In the remaining intersections, fully protected phasing was replaced by PPLT with a flashing yellow arrow. Crashes before the implementation of flashing yellow arrow was compared with crashes after the implementation of flashing yellow arrow. Safety was not improved at the intersections where fully protected phasing was replaced by PPLT phasing with flashing yellow arrow. These intersections experienced a change in phasing and hence, it is not possible to determine if flashing yellow arrow was effective. No conclusions could be made regarding the safety effect of replacing the green ball with flashing yellow arrow at the five intersections with permissive phasing. Safety was improved at the 21 intersections that operated on PPLT phasing where the green ball was replaced with the flashing yellow arrow. Although this study indicates that the flashing yellow arrow was effective in reducing crashes at PPLT locations, this result is based on a limited sample of intersections. It is also not clear if the empirical Bayes method used a reference group to account for bias due to regression to the mean and to account for changes in traffic volume. In addition, it is not clear if driver age was considered in this evaluation.
The FYA research noted above targets apparent deficits in the comprehension of the conventional green ball for permissive turning operations at intersections, which has been discussed elsewhere in this section. At the same time, concerns have been raised about confusion by aging motorists regarding the meaning of arrow signal indications elsewhere in this Handbook. Given the positive experience of some practitioners who are early adopters of this treatment, further FYA research is a high priority. Such investigations could well lead to a Handbook recommendation to adopt this practice, pending reliable evidence that shows a) comprehension rates that equal or exceed those of other viable substitutes for the steady green ball; and b) an absence of performance penalties or safety problems for "young-old" as well as "old-old" drivers upon their initial encounters with such displays, under naturalistic conditions. In particular, it is important to rule out the possibility that the FYA will be (mis)perceived as the timing out of a protected left turn phase, which could actually increase the potential for injurious angle crashes.
Next, Hummer, Montgomery, and Sinha (1991) evaluated leading and lagging signal sequences using a survey of licensed drivers in Indiana, an examination of traffic conflicts, an analysis of crash records, and a simulation model of traffic flow, to evaluate motorists' understanding and preference for leading and lagging schemes as well as determining the safety and delay associated with each scheme. Combinations of permissive and protected schemes included: (1) protected-only/leading, in which the protected signal is given to vehicles turning left from a particular street before the circular green is given to the through movement on the same street; (2) protected-only/lagging, in which the green arrow is given to left-turning vehicles after the through movements have been serviced; (3) protected/permissive, in which protected left turns are made in the first part of the phase and a circular green indication allows permissive turns later in the phase; and (4) protected/permissive, in which unprotected turns are allowed in the first part of the phase and protected left turns are accommodated later in the phase. The protected-only/leading and protected/permissive schemes are known as "leading," and the protected-only/lagging and permissive/protected are known as "lagging" schemes. Of the 402 valid responses received, 248 respondents preferred the leading, 59 preferred the lagging sequence, and 95 expressed no preference. The most frequent reasons given for preference of the leading sequence were: it is more like normal; it results in less delay; and it is safer. There are apparent tradeoffs here, however; the leading sequence was associated with a higher conflict rate with pedestrians and a higher rate of run-the-red conflicts (drivers turning left during the clearance interval for opposing traffic), while the intersections with a lagging sequence were associated with a significantly higher rate of indecision conflicts than the leading intersections due to violations in driver expectancy. Overall, it is judged that consistency in signal phasing across intersections within a jurisdiction, as well as across jurisdictions, should be a priority, and that use of a leading protected left-turn phase offers the most benefits. A discussion of countermeasures for the protection of pedestrians may be found in the material that presents the Rationale and Supporting Evidence for Design Element 15 – Pedestrian Crossings.
Upchurch (1991) compared the relative safety of 5 types of left-turn phasing using Arizona Department of Transportation crash statistics for 523 intersection approaches, where all approaches had a separate left-turn lane, 329 approaches had two opposing lanes of traffic, and 194 approaches had three opposing lanes. The five types of left-turn phasing included (1) permissive, (2) leading protected/permissive, (3) lagging protected/permissive, (4) leading protected-only, and (5) lagging protected-only. For the 495 signalized intersections in the State highway system, most samples represented a 4-year crash history (1983–1986). For the 132 signalized intersections in 6 local jurisdictions in Arizona, samples ranged from 4 months to 4 years, all between 1981 and 1989. When the crash statistics were stratified by various ranges of left-turn volume and various ranges of opposing volume (vehicles per day), the following observations and conclusions were made for sample sizes greater than five, eliminating any conclusions about lagging protected-only phasing:
Leading protected-only phasing had the lowest left-turn crash rate in almost every case. This was true in every left-turn volume range and every opposing volume range except one (19 out of 20 cases). Lagging protected/permissive was the exception for three opposing lanes and left-turn volumes of 0–1,000.
When there were two lanes of opposing traffic, lagging protected/permissive tended to have the worst crash rate.
When there were three lanes of opposing traffic, leading protected/permissive tended to have the worst crash rate.
When there were two lanes of opposing traffic, the order of safety (crash rate from best to worst) was leading protected-only, permissive, leading protected/permissive, and lagging protected/permissive. However, there was a small difference in the crash rate among the last three types of phasing.
When there were three lanes of opposing traffic, the order of safety (crash rate from best to worst) was leading protected-only, lagging protected/permissive, permissive, and leading protected/permissive.
Upchurch (1991) compared the crash experience of 194 intersections that had been converted from one type of phasing to another in a simple before-and-after design. For each conversion, four years of before-crash data and four years of after-crash data were used, where available. At approaches having two opposing lanes of traffic, the statistics for conversions from permissive to leading protected/permissive and vice versa reinforced each other, suggesting that leading protected/permissive is safer than permissive. At approaches having three opposing lanes of traffic, the statistics for conversions from leading protected-only to leading protected/permissive and vice versa reinforced each other, suggesting that leading protected-only is safer than leading protected/permissive.
Parsonson (1992) stated that a lagging left-turn phase should be used only if the bay provides sufficient storage, as any overflow of the bay during the preceding through-movement will spill into the adjacent through lane, blocking it. A lag should also be reserved for those situations in which opposing left-turn movements (or U-turns) are safe from the left-turn trap (or are prohibited). The "left-turn trap" occurs when the left-turning driver's right-of-way is terminated, while the opposing (oncoming) approach continues with a green arrow and an adjacent through movement. Thus, left-turning drivers facing a yellow indication are trapped; they believe that the opposing traffic will also have a yellow signal, allowing them to turn on the yellow or immediately after. Since the opposing traffic is not stopping, the turning driver is faced with a potentially hazardous situation. Locations where the left-turn trap is not a hazard include T-intersections, and those where the left turn (or U-turn) opposing the green arrow is prohibited or is allowed only on a green arrow (protected-only phasing). In addition, driver expectancy weighs heavily in favor of leading left turns, and driver confusion over lagging left turns results in losses in start-up time.
The right-turn-on-red (RTOR) maneuver provides increased capacity and operational efficiency at a low cost (Institute of Transportation Engineers [TEH], 1999). However, traffic control device violations and limited sight distances need to be addressed in order to reduce the potential for safety problems. TEH concluded that a significant proportion of drivers do not make a complete stop before executing an RTOR, and a significant portion of drivers do not yield to pedestrians. In a review of the literature on RTOR laws and motor vehicle crashes, Zador (1984) reported findings that linked RTOR to a 23 percent increase in all right-turning crashes, a 60 percent increase in pedestrian crashes, and a 100 percent increase in bicyclist crashes. Analysis of police crash reports in four States indicated that drivers who are stopped at a red light are looking left for a gap in traffic and do not see pedestrians and bicyclists coming from their right (Preusser, Leaf, DeBartolo, and Levy, 1982). Eldritch (1989) noted that, adding to the adverse effects RTOR has on pedestrian crashes, many motorists persist in making right turns on red even when there is a sign that prohibits the maneuver.
Data describing the safety impact of RTOR were provided by Compton and Milton (1994) in a report to Congress by the National Highway Traffic Safety Administration. Using the Fatality Analysis Reporting System (FARS) data and data from four State files for 1989–1992, it was concluded that RTOR crashes represented a small proportion of the total number of traffic crashes in the four States (0.05 percent) and of all fatal (0.03 percent), injury (0.06 percent), and signalized-intersection crashes (0.40 percent). FARS data showed that approximately 84 fatal crashes per year occurred involving a right-turning vehicle at an intersection where RTOR is permitted; however, because the status of the traffic signal indication is not available in this database, the actual number of fatal crashes that occurred when the signal was red is not known. Slightly less than one-half of these crashes involved a pedestrian (44 percent), 10 percent involved a bicyclist, and 33 percent involved one vehicle striking another. Although no data on the age of the drivers involved in RTOR crashes were provided, there are reasons for concern that increasing problems with this maneuver may be observed with the dramatic growth in the number of aging drivers in the United States.
| Applications in Standard Reference Manuals | |||
|---|---|---|---|
| MUTCD (2009) | AASHTO Green Book (2011) | NCHRP 279 Intersection Channelization Design Guide (1985) | Traffic Engineering Handbook (2009) |
| Sect. 1A.13, Intersection, Right-of-Way [Assignment], Sign Legend, & Traffic Control Signal (Traffic Signal) Table 2B-1 Sects. 2B.18 through 2B.22, 2B.46, 2B. 52 through 2B. 54 Sects. 3B.08 & 3B.21 Figs. 3B-13b and d, 3B-24, 3B-27 Sects. 4D.04 through 4D.17, 4D.22 through 4D.31 |
Pg. 3-176, Para. 4 Pg. 7-43, Paras. 3-5 Pgs. 9-15 through 9-19, sect. on Channelized Four-Leg Intersections Pg. 9-51, Para. 2 |
Pg. 3, 2nd col, Para. 2 Pg. 37, Para. 2 & top right fig. Pgs. 61-65, Sect. on Exclusive Right-Turn Lanes Pg. 100-101, Intersct. No. 7 Pgs. 106-113, Intersct. Nos. 10-13 Pgs. 124-125, Intersct. No. 19 Pgs. 132-135, Intersct. Nos. 22-23 Pgs. 148-149, Intersct. No. 35 |
Pgs. 245-246 Pgs. 462-465, Sect. on Turn Lanes Pg. 413-415, Sect. on Left Turns Pgs. 632-634, Sect. on Turn Restrictions |
The difficulties that aging drivers are likely to experience making right turns at intersections are a function of their diminishing gap-judgment abilities, reduced neck/trunk flexibility, attention-sharing deficits, slower acceleration profile, and their general reduction in understanding traffic control devices compared with younger drivers. Right-turning drivers face possible conflicts with pedestrians, and restrictions in the visual attention of aging drivers may allow pedestrian and vehicular traffic to go unnoticed. The fact that pedestrians may be crossing the side street, where they enter the path of the right-turning vehicle, places a burden upon the driver to search the right-turning path ahead. The result is the need to share attention between oncoming vehicles approaching from the left and pedestrians in the path to the right. Limitations in the range of visual attention, frequently referred to as "useful field of vision," further contribute to the difficulty of aging drivers in detecting the presence of pedestrians or other vehicles near the driver's path. Aging drivers, who may have greater difficulty maintaining rapid eye movements and associated head movements, are less likely to make correct judgments on the presence of pedestrians in a crosswalk or on their walking speed (Habib, 1980).
Researchers have identified that the right-turn maneuver is more problematic for aging drivers compared with young or middle-aged drivers, presumably as a result of age-related diminished visual, cognitive, and physical capabilities. Knoblauch, et al. (1995) conducted an analysis of right-angle, left-turning, right-turning, side-swipe, and rear-end crashes at intersections in Minnesota and Illinois for the time period of 1985–1987, comparing crash proportions and characteristics of "middle-aged" drivers ages 30–50, "young-elderly" drivers ages 65–74, and "old-elderly" drivers age 75 and older. Turning right accounted for 35.8, 39.3, and 42.9 percent, respectively, of the middle-aged, young-elderly, and old-elderly drivers' crashes at urban locations. It appears that, for right-turning crashes, the middle-aged driver is most likely crossing the intersection on a green signal and the older drivers are turning right on a red signal in front of the oncoming middle-aged driver. Similar patterns emerged from examination of the rural signalized-intersection pre-crash maneuvers, with middle-aged drivers most often traveling straight, and older drivers most often turning left or right. Looking at the contributing factors in angle and turning collisions for both rural and urban signalized locations, the middle-aged group was much more likely to be characterized by the police officer as having exhibited "no improper driving." This occurred in 65 percent of the crashes involving this age group, compared with 30.7 percent of the young-elderly, and 13.4 percent of the old-elderly. The two elderly groups were more likely to be cited for failing to yield (42.0 percent of the old-elderly, 31.9 percent of the young-elderly, and 10.9 percent of the middle-aged); disregarding the traffic control device (30.7 percent of the old-elderly, 22.0 percent of the young-elderly, and 10.3 percent of the middle-aged); and driver inattention (8.2 percent of the old-elderly, 8.9 percent of the young-elderly, and 6.4 percent of the middle-aged).
Knowledge testing has indicated that, compared with younger drivers, older drivers are less familiar with the meaning of traffic control devices and relatively new traffic laws (McKnight, Simone, and Weidman, 1982). "Newness" of traffic laws, in this regard, relates not to the period of time that has elapsed since the device or law was implemented, but the low frequency with which drivers come in contact with the situation. Aging drivers may not encounter right turn on red after stop (RTOR), no turn on red (NTOR), or red right-turn arrow situations on a daily basis, due to the significantly lower amount and frequency of driving in which they are engaged. The demonstrated lack of understanding for the red right-turn arrow (Hulbert, Beers, and Fowler, 1979) and increased violations associated with this display (Owolabi and Noel, 1985) would be of particular concern for aging road users, drivers and pedestrians alike.
Knoblauch et al. (1995) found that both drivers younger than the age of 65 and drivers age 65 and older failed to understand that they could turn right on a circular red after stopping in the right lane. Although the survey indicated that older drivers were more likely to stop and remain stopped (45 percent) than younger drivers (36 percent), the differences were not significant.
Staplin, et al. (1997) conducted a controlled field study to measure differences in drivers' RTOR behavior as a function of driver age and right-turn lane channelization. In this study, 100 subjects divided across three age groups were observed as they drove their own vehicles around test routes using the local street network in Arlington, Virginia. The three age groups were young/middle-aged (ages 25–45), young-old (ages 65–74), and old-old (age 75+). The percentage of drivers who made RTOR maneuvers at the four intersections was included as a measure of mobility.
Staplin et al. (1997) found that significantly fewer drivers in the old-old driver group attempted to make an RTOR (16 percent), compared with young/middle-aged drivers (83 percent) and young-old drivers (45 percent). Similarly, young/middle-aged drivers made an RTOR nearly 80 percent of the time when they had the chance to do so, compared with nearly 36 percent for the young-old drivers and 15 percent for the old-old drivers. Drivers made significantly fewer RTORs at the skewed channelized intersection than at the other three locations. Analysis of the percentage of drivers who made an RTOR without a complete stop showed that age, right-turn lane geometry, gender, and the age-by-geometry interaction were significant. Young/middle-aged drivers made an RTOR without a complete stop nearly 35 percent of the time, compared with nearly 25 percent for the young-old and 3 percent for the old-old drivers. Channelized intersections, with or without exclusive acceleration lanes, encouraged making an RTOR without a complete stop. The unchannelized and the skewed locations showed the lowest percentage of RTORs without a complete stop, and were not significantly different from each other. The three age groups showed significantly different performance. Old-old drivers almost always stopped before making an RTOR regardless of the right-turn lane geometry. In only 1 of 26 turns did an aging driver not stop before making an RTOR; this occurred at the channelized right-turn lane with an acceleration lane. At the unchannelized intersection (which was controlled by a STOP sign), 22 percent of the young/middle-aged drivers, 5 percent of the young-old drivers, and none of the old-old drivers performed an RTOR without a stop. Where an acceleration lane was available, 65 percent of the young/middle-aged drivers continued through without a complete stop, compared with 55 percent of the young-old drivers and 11 percent of the old-old drivers. The increased mobility exhibited by the younger drivers at the channelized right-turn lane locations (controlled by YIELD signs) was not exhibited by old-old drivers, who stopped in 19 of the 20 turns executed at the channelized locations. In summary, with increases in driver age, the likelihood of RTOR decreases to a very low level for the present cohort of old-old drivers, but when these individuals do engage in this behavior, they are virtually certain to come to a complete stop before initiating the maneuver. Therefore, the emphasis is to ensure adequate sight distance for the aging turning driver, to provide sign and signal indications that are most easily understood by this group, and to prompt these motorists to devote adequate attention to pedestrians who may be in conflict with their turning maneuver.
Zegeer and Cynecki (1986) found that offsetting the stop line—moving the stop line of adjacent stopped vehicles back from the intersection by 6 to 10 ft—was effective in providing better sight distance to the left for RTOR motorists. It also reduced the RTOR conflicts with other traffic and resulted in more RTOR vehicles making a full stop behind the stop line. The offset stop line was recommended as a countermeasure for consideration at RTOR-allowed sites that have two or more lanes on an approach and heavy truck or bus traffic, or unusual geometrics.
Zegeer and Cynecki (1986) also found that a novel sign (circular red symbol with NO TURN ON RED, shown in Figure 79) was more effective than the standard black-and-white NO TURN ON RED (R10-11a) sign, especially when implemented near the signal. This countermeasure resulted in an overall reduction in RTOR violations and pedestrian conflicts. They offered that the circular red symbol on the sign helps draw drivers' attention to it, particularly as intersections are associated with a preponderance of signs and information, and recommended that it should be added to the MUTCD as an alternate or approved as a replacement to the current R10-11a design. Increasing the size of the standard NO TURN ON RED sign from its present size of 24 x 30 in to 30 x 36 in reduced the proportion of violations at most of the test sites. Finally, Zegeer and Cynecki (1986) found that an electronic NO TURN ON RED blank-out sign was found to be slightly better than the standard MUTCD sign in terms of reducing violations, and it was effective in increasing RTOR maneuvers when RTOR was appropriate, thereby reducing vehicle delay. Although the sign is more expensive than standard signs and pavement markings, the authors concluded it may be justified in situations where pedestrian protection is critical during certain periods (i.e., school zones) or during a portion of the signal cycle when a separate, opposing left-turn phase may conflict with an unsuspecting RTOR motorist.
Figure 79. Novel Sign Tested as a Countermeasure to Reduce RTOR Violations and Pedestrian Conflicts (Zegeer and Cynecki, 1986)
The MUTCD (2009) specifies that the lettering on street name signs should be at least 6 in for upper-case letters and 4.5 in for lower-case letters, and that larger letters should be used for street name signs that are mounted overhead. It provides an option for using 4-in upper-case lettering and 3-in lower-case lettering on street name signs that are posted on local roads with speed limits 25 mph or less. Burnham (1992) noted that the selection of letter size for any sign must evaluate the needs of the user, which are continuously changing as a function of changes in automotive technology, the roadway system, and the population itself. For example, Phoenix, Arizona, a city with a large aging driver population, has been using "jumbo" street name signs at signalized intersections since 1973. These signs are 16 in high and use 8 in capital letters (Rural and Urban Roads, 1973). It is estimated that by the year 2020, 17 percent or more of the population will be older than 65 years of age, and by the year 2030, 1 in 5 Americans will be older than age 65 (U.S. Bureau of the Census, 1996). The ability to read street signs is dependent on visual acuity as well as divided attention capabilities, both of which decline significantly with advancing age.
Aging drivers participating in focus groups and completing questionnaires for traffic safety researchers over the past two decades have consistently stated that larger street signs with bigger lettering and standardization of sign placement overhead would make driving an easier task (Yee, 1985; Gutman and Milstein, 1988; Cooper, 1990; Staplin, Lococo, and Sim, 1990; Benekohal, et al., 1992; Knoblauch, et al., 1995). Problems with placement included signs that were either obstructed by trees, telephone poles, billboards, or large trucks, or placed too close to or across the intersection rather than on the near side. Aging drivers stated that they needed more advance notice regarding upcoming cross streets and larger street-name signs placed overhead, to give them more time to make decisions about where to turn. Also noted were difficulties reading traffic signs with too much information in too small an area, and/or with too small a typeface, which results in the need to slow down or stop to read and respond to the sign's message. May (1992) noted that providing sufficient time to allow motorists to make appropriate turning movements when approaching cross streets can improve safety and reduce congestion, and that consistent street signing across political jurisdictions can be helpful in this regard, as well as presenting an orderly, predictable picture of the region to tourists, business people, and residents.
A decade later, Eck and Winn (2002) conducted a survey of 172 individuals between the age of 50 and 91 (mean age of 73.3). The overall objective was to assess the understanding by West Virginia's aging drivers of traffic control devices and roadway design features associated with unsignalized at-grade intersections on high speed divided roadways. A survey was administered in 15 senior centers in counties with high-speed roads within their boundaries. One of the survey items asked participants to pick from a list the factor that presented the greatest difficulty for them in trying to find a side road when traveling on a divided highway. Just over 20 percent indicated that finding a side road was not a problem for them. The most frequent factor was "fast moving traffic on my rear bumper," by 24 percent of the respondents, followed by "road sign name that is too small to read" by just over 20 percent of the participants. This finding underscores the need for larger lettering on street name signs, the use of overhead street name signs, and advance placement of street name signs.
| Applications in Standard Reference Manuals | ||
|---|---|---|
| MUTCD (2009) | AASHTO Green Book (2011) | NCHRP 500 – Volume 9 (2004) |
| Sect. 1A.14, Abbreviations Sects. 2A.07, 2A.08, 2A.11, 2A.14, 2A.17, 2D.01 through 2D.06, 2D.43 & 2E.29 |
Pg. 2-39, Para. 3 Pg. 3-176, Paras. 1-2 |
Pgs. V-8-V-16, Sects. on Strategy 3.1 B1 through Strategy 3.1 B3 |
Taoka (1991) discussed 'spare glance" duration in terms of how drivers allocate their visual search time among different tasks/stimuli. The tasks ranged from side/rearview mirror glances during turning to reading roadway name signs. Although specific results were not differentiated by age, Taoka asserted that 85th percentile glance times at signs (about 2.4 s) were likely too long, as 2.0 s is the maximum that a driver should divert from the basic driving task. Since aging drivers are more apt to be those drivers taking longest to read signs, these results imply that they will commonly have problems dividing attention between searching for/reading signs and the basic driving task. Malfetti and Winter (1987) observed that aging drivers exhibited excessive vehicle-braking behavior whenever a signal or road sign was sighted. This was categorized as an unsafe behavior, because it is confusing and disruptive to following traffic when the lead vehicle brakes for no apparent reason. These researchers obtained many descriptions of aging drivers who stopped suddenly at unexpected times and in unexpected places, frequently either within the intersection or 40 ft before the intersection to read street signs.
The visibility of retroreflective signs must be considered with regard to their dual requirements of detection and legibility. The sign components affecting detection are sign size, color, shape, brightness, and message or content design. External factors affecting sign detection include its placement (e.g., left, right, or overhead), the visual complexity of the area, and the contrast of the sign with its background. The component parts of retroreflective signs that determine legibility fall into two major classes of variables: character and message. Character variables include the variables related to brightness—i.e., contrast, luminance, color, and contrast orientation—as well as font, letter height, letter width, case, and stroke width. Message variables address the visibility issues of spacing and include interletter, interword, interline, and copy-to-border distances.
Most studies of sign legibility report legibility distance and the letter height of the stimulus; dividing the former measure by the latter defines the "legibility index" (LI), which can serve as a common denominator upon which to compare different studies. Forbes and Holmes (1939) used the LI to describe the relative legibility of different letter styles. Under daytime conditions, series B, C, and D were reported to have indexes of (33 ft/in, 42.5 ft/in, and 50 ft/in), respectively. Forbes, Moskowitz, and Morgan (1950) found the wider, Series E letters to have an index of 55 ft/in. Over time the value of 50 ft/in of letter height became the nominal, though arbitrary and disputed, standard. The LI is important to the size requirement determination for a sign in a specific application. Based on the physical attributes of the aging driver population, the then-standard of 50 ft of legibility for every 1 in of letter height (corresponding to a visual acuity of 20/25) exceeded the visual ability of approximately 40 percent of the drivers between ages 65 and 74. The MUTCD (2009) section 2A.13, which provides guidance for determining sign letter heights, indicates that sign letter heights should be determined based on 1 inch of letter height per 30 ft of legibility distance; this shift is certainly desirable considering the human factors issues addressed in this chapter.
Mace (1988), in his work on minimum required visibility distance (MRVD) for highway signs, noted the following relationships:
![]()
or
![]()
Either the letter size or the LI may be manipulated to satisfy the MRVD requirement, which specifies the minimum distance at which a sign should be read for proper driver reaction.
Olson and Bernstein (1979) suggested that aging drivers should not be expected to achieve a LI of 50 ft/in under most nighttime circumstances. The data provided by this report gives some expectation that 40 ft/in is a reasonable goal under most conditions. A 40 ft/in standard can generally be effective for aging drivers, given contrast ratios greater than 5:1 (slightly higher for guide signs) and luminance greater than 10 cd/m2 for partially reflectorized signs. With regard to the effect of driver age on legibility, Olson, Sivak, and Egan (1983) concluded that older drivers require more contrast between the message and the sign's background than younger drivers to achieve the same level of comprehension. They also noted that legibility losses with age are greater at low levels of background luminance. A reduction in legibility distance of 10 to 20 percent should be assumed when signs are not fully reflectorized. (It should be noted that the MUTCD (2009) includes text in section 2A.07 that states that regulatory, warning, and guide signs shall be retroreflective or illuminated to show the same shape and color by both day and night, unless specifically stated otherwise in the MUTCD text discussion of a particular sign or group of signs. Section 2D.03 further states that all messages, borders, and legends on guide signs shall be retroreflective, and all backgrounds shall be retroreflective or illuminated.) Also, higher surround luminance improved the legibility of signs more for aging drivers and reduced the negative effects of excessive contrast. In general, the LI for aging drivers is 70 to 77 percent of the LI for younger drivers. The average LI for aging drivers is clearly below the nominal value of 50 ft/in of letter height. The means for aging drivers are generally between 40 ft/in and 50 ft/in; however, the 85th percentile values reported are between 30 ft/in and 40 ft/in (Sivak, Olson, and Pastalan, 1981; Kuemmel, 1992; Mace, Garvey, and Heckard, 1994). Mace (1988) concluded that a most conservative standard would provide drivers with 2 minutes of arc, which corresponds to 20/40 vision and a 30 ft/in LI.
In a laboratory simulation study, Staplin et al. (1990) found that older drivers (ages 65–80) demonstrated a need for larger letter sizes to discern a message on a guide sign, compared with a group of younger drivers (ages 19–49). To read a one-word sign, older drivers required a mean letter size corresponding to 2.5 minutes of visual angle (or a Snellen acuity of 20/50), compared with the mean size required by younger drivers of 1.8 minutes of visual angle (or Snellen acuity of 20/35). Character size requirements increased for both age groups when the message contained four words, to 3.78 minutes of visual angle (acuity equivalent of 20/75) for the older drivers, and to 2.7 minutes of visual angle (acuity equivalent of 20/54) for the younger drivers. The main effect of age for the word and message legibility measure was highly significant. Staplin et al. (1990) concluded that for standard highway signing, an increase in character size in the range of 30 percent appears necessary to accommodate age-related acuity differences across the driving population.
Tranchida, Arthur, and Stackhouse (1996) conducted a field study using aging drivers who drove the research laboratory's vehicle at nighttime, to determine the legibility distances of street-name signs as a function of sheeting type. The subjects included nine males ages 68 to 74, and nine females ages 62 to 83. The four sheeting types were: Type IX, Type VII, Type III, and Type I (American Society for Testing and Materials, 2001). Intersections of three levels of complexity were used: high complexity/ high traffic activity (e.g., large intersection in downtown business area); intermediate complexity/intermediate traffic activity (e.g., small intersection area in suburban small business/apartment area); and low complexity/low traffic activity (e.g., residential area of single-family homes). All intersections were lighted. Street-name signs with invented names (Strike, Strong, Stress, Straw, Story, and Storm) were created using Series C letters, with a 6-in uppercase "S", followed by 4.5-in lowercase letters. There were no borders on the street name signs. The signs were placed on the far side of the intersection, either on the right or the left side, and the drivers' task was to read aloud the street name as soon as it was legible to them, as they approached at a speed of 20 mph. The vehicle was a two-door sedan with automatic transmission, power steering, and power brakes.
The mean legibility distances across the three intersections and two street sides were as follows for the four sheeting types: Type VII=170 ft; Type IX=172 ft; Type III=142 ft; and Type I=130 ft. Legibility distances were always longer for signs placed on the right side of the street than for those placed on the left. The mean legibility distances for the signs mounted on the right side of the road and corresponding luminances of the sheeting at the legibility distances are as follows: Type VII=205 ft) and 4.392 cd/m2; Type IX=201 ft and 7.369 cd/m2; Type III=177 ft and 1.1314 cd/m2; and Type I=174 ft and 0.9671 cd/m2. Sheeting Types VII and IX performed similarly, and produced significantly longer legibility distances than both Type III and Type I sheeting. However, Types VII and Type IX provided significantly longer legibility distances only for the intersections with high complexity viewing conditions. There was no significant benefit in legibility distance for Type VII and Type IX sheeting at the two streets making up the low complexity intersection and on one street that was less traveled and less visually complex than the other in the intermediate complexity intersection.
These results suggest that at visually complex intersections with exaggerated demands for divided attention, the use of retroreflective sheeting that provides increased legibility distance would be of clear benefit to aging drivers. Sheeting that provides for high retroreflectance overall, and particularly at wide observation angles typical when viewing street-name signs, would best meet this need. The anticipated benefit is that fewer glances will need to be directed toward the sign to determine the legend, and more effort can be devoted to vehicle control and visual search for traffic and pedestrian conflicts.
The use of mixed-case letters on overhead street name signs was studied by Garvey, Gates, and Pietrucha (1997). Based on this research, it was recommended that for any approach with a 35 mph or lower speed limit, an overhead street name sign should have 8-in uppercase and 6-in lowercase letters. For approaches with a speed limit above 35 mph, an overhead street name sign should contain 10-in uppercase and 8-in lowercase letters. This recommendation is based on the need for street name signs to be legible for 5.5-s before the intersection, which allows for a 1.5-s alerted perception-reaction time to read a sign and initiate a response (Johannson and Rumar, 1971), plus a 4.0-s interval to complete a combined speed reduction and tracking task (McGee, et al., 1979). Street name signs should therefore be readable at 300 ft at speeds of 35 mph, and at 450 ft at 55 mph.
In an earlier study, Garvey, Meeker, and Pietrucha (1996) found a 12 to 15 percent increase in recognition distance for mixed-case text over all upper case legends under both daytime and nighttime conditions. However, this result was for recognition of words that drivers already knew would appear on the signs. Because the reading of street name signs is often a recognition task, rather than a pure legibility task, the reading distance of street name signs will be higher than would be predicted on driver visual acuity alone. At the same time, street name legends provide useful information only when they can be read and understood by motorists. This fact underscores the focus on manipulations of those characteristics of sign legends that can increase reading distance. The rationale for mixed-case letters is reported above; the case for enhancements of street name letter fonts follows. Another obvious manipulation, of course, is simply the size of the letters themselves.
Garvey, Pietrucha, and Meeker (1997) investigated an experimental font in two controlled field studies, using drivers ages 65 to 83. To accurately describe this research, it is necessary to use a trademarked name; however, this does not imply an endorsement of this product by the U.S. Government. Also, until this font undergoes the procedures required for MUTCD approval (rule making process), a recommendation cannot be made to use a non-standard font on standard highway signs. Garvey at al. (1997) compared the recognition distances and legibility distance of words displayed in mixed-case Clearview® font with those displayed in Standard Highway Series D uppercase font, and mixed-case Standard Highway Series E(M) font. The Clearview® font was developed to have open, wider spaces within a letter, to eliminate the effects of irradiation/halation that is caused by bright, bold stroke widths that "bleed" into a character's open spaces, rendering it illegible. Since each Clearview® character has more openness than the Standard Highway font, the intercharacter spacing is smaller. Clearview® spacing results in words that take up 10.8 percent less space than Standard Highway fonts, such that a 12 percent increase in Clearview® character height results in words equal in sign space to words presented in the Standard fonts. The Clearview® font was produced in a regular version, with visual proportions similar to the Standard FHWA Series E(M) font, as well as in a condensed version, with visual proportions similar to the Standard FHWA Series D font. Two sizes of the Clearview® font were displayed: Clearview® 100 (fonts matched to Standard Highway font height) and Clearview® 112 (fonts 112 percent of Standard Highway font letter height, but equal in overall sign size to Standard Highway font). The fonts tested are described in Table 23. The Clearview® fonts will be referred to as Clear Condensed 100, Clear Condensed 112, Clear 100, and Clear 112 throughout the remainder of this section. White words were created with either encapsulated lens (ASTM Type III: RA=250 cd/lux/m2) material or microprismatic sheeting designed for short-distance brightness (RA=430 cd/lux/m2), and were displayed on a green sign panel measuring 4 ft2. Each sign contained three place names, each containing six letters (from the same font). The study was conducted using one subject at a time, who was seated in the front passenger's seat of a vehicle driven by the experimenter. For each test run, the vehicle was started at a point 1,000 ft from the sign.
| Font Name | Case | Letter Height |
|---|---|---|
| Clear Condensed 100 | mixed case | Upper Case: 5 in Lower Case: 3.9 in loop height |
| Clear Condensed 112 | mixed case | Upper Case: 5.6 in Lower Case: 4.4 in |
| Standard Highway Series D | Uppercase | 5 in |
| Standard Highway Series E(M) | mixed case | Upper Case: 5 in Lower Case: 3.9 in loop height |
| Clear 100 | mixed case | Upper Case: 5 in Lower Case: 3.9 in loop height |
| Clear 112 | mixed case | Upper Case: 5.6 in Lower Case: 4.4 in |
For the word recognition study, the experimenter read aloud the place name that the subject was to look for on a sign. As the experimenter drove toward the sign at approximately 5 to 10 mph, the subject's task was to tell the experimenter when he or she could determine where the place name was located on the sign: top, middle, or bottom. The distance from the sign at which the subject answered correctly was recorded as the recognition distance. Twelve aging drivers (mean age = 70.9 years) completed the word recognition study during the day, and another 12 aging drivers (mean age = 74.8 years) completed the study at nighttime.
A new set of 24 subjects was recruited for the legibility study, with half completing the study during daytime (mean age = 71.3 years) and half at nighttime (mean age = 73.9 years).
For the word legibility study, subjects were presented with only one word on a sign, and were required to read the word. Legibility distance was recorded at the point where subjects correctly read the word.
Results of the word recognition study indicated that during the daytime, there were no significant differences between either the Clear 100 or Clear 112 and the Series E(M) fonts. However, when comparing the Clear Condensed 100 and Clear Condensed 112 to the Series D font, the mixed-case fonts produced significantly longer recognition distances (14 percent greater) than the all uppercase Standard Highway font. At nighttime, the Clear 100 font did not produce recognition distances significantly different from those obtained with the Standard E(M) font, however, the Clear 112 font produced significantly greater recognition distances (16 percent greater) than the Standard E(M) font. The Clear 112 and Clear Condensed 112 fonts produced significantly longer recognition distances than the all-uppercase Series D font. Under both daytime and nighttime, there were no significant effects of material brightness, for the word recognition study. The mean daytime and nighttime recognition distances for the six fonts are displayed in Table 24.
| Font Name | Daytime Recognition Distance (ft) | Nighttime Recognition Distance (ft) |
|---|---|---|
| Clear Condensed 100 | 394 | 282 |
| Clear Condensed 112 | 440 | 344 |
| Standard Highway Series D | 384 | 282 |
| Clear 100 | 433 | 338 |
| Clear 112 | 472 | 387 |
| Standard Highway Series E(M) | 449 | 331 |
The results of the word legibility study conducted during the daytime indicated that the microprismatic sheeting produced a 4 percent improvement in legibility distance, compared to the encapsulated lens sheeting. There was no significant interaction between font and material, however. Looking at the effects of font on legibility distance, there was no significant difference in the daytime legibility distances obtained with the Series E(M) font and the Clear 100 and Clear 112 fonts. There was also no significant difference in legibility distance between the Series D font and the Clear 112 and Clear Condensed 112 fonts. However, the all uppercase Series D font showed significantly longer legibility distances than the Clear Condensed 100 font.
At nighttime, there was a significant interaction effect between font and sheeting material, such that the Clear 112 font produced significantly longer legibility distances (22 percent longer) than the Series E(M) font, using the encapsulated lens sheeting. The microprismatic sheeting showed the same trend (although not significant), with the Clear 112 font producing 11 percent longer legibility distances than the Series E(M). There were no differences between the all uppercase Series D font and the same-size, mixed-case Clear fonts (i.e., Clear 112 and Clear Condensed 112). However, the Series D font produced significantly longer legibility distances than the Clear Condensed 100 font at night. The legibility distances obtained for the six fonts studied under daytime and nighttime are shown in Table 25.
| Font Name | Daytime Legibility Distance (ft) | Nighttime Legibility Distance (ft) |
|---|---|---|
| Clear Condensed 100 | 187 | 148 |
| Clear Condensed 112 | 220 | 194 |
| Standard Highway Series D | 223 | 207 |
| Clear 100 | 220 | 197 |
| Clear 112 | 230 | 246 |
| Standard Highway Series E(M) | 223 ft | 197 ft |
Garvey, Pietrucha, and Meeker (1997) state that guide signs are read using both legibility and recognition criteria, depending on the familiarity of a traveler with the location words used on the signs. A driver who is looking for a particular word on a sign will be able to read it at a farther distance that a driver who has no idea of what might be on the sign. In the legibility task, the larger letters used with the all-uppercase Series D font produced greater legibility distances than the smaller mixed case Clear 100 Condensed font. But when the mixed-case font was increased to take up the same sign area as the Series D font (Clear Condensed 112), the legibility distances for the mixed-case and uppercase fonts were the same. In the recognition task, for which Garvey, Pietrucha, and Meeker (1998) state more closely represents real-world behavior, the same-size, mixed-case fonts performed significantly better than the all uppercase Series D font. And, even the mixed-case font that took up less sign space performed as well as the all-uppercase, Series D font, in terms of word recognition. The authors explain that uppercase words look like blurry rectangles when viewed from a distance. Mixed-case font, on the other hand, produces words with a recognizable overall shape, due to the ascending and descending elements in each letter. The data from this study indicate that if the size of mixed-case words on a sign is matched to the size of words presented in all uppercase font, the mixed-case font provides equal legibility distance and superior recognition distance.
Next, the MUTCD states that street-name signs should be placed at least on diagonally opposite corners so that they will be on the far right-hand side of the intersection for traffic on the major street. Burnham (1992) noted that signs located over the highway are more likely to be seen before those located on either side of the highway. In this regard, Zwahlen (1989) examined detection distances of objects in the peripheral field versus line-of-sight detection and found that average detection distances decrease considerably as the peripheral visual detection angle increases. Placement of street-name signs overhead places the sign in the driver's forward line of sight, eliminating the need for the driver to take his/her eyes away from the driving scene, and reduces the visual complexity of the sign's surround, but under some sky conditions (e.g., backlit by the sun at dawn and dusk) the sign may be unreadable. Thus, overhead street-name signing should be a supplement to standard roadside signing.
The use of an advance street name plaque (W16-8) with an advance warning crossroad, side road, or T-intersection sign (W2-1, W2-2, W2-3, and W2-4) provides the benefit of additional decision and maneuver time prior to reaching the intersection. Section 2C.46 of the MUTCD (2009) indicates the use of such supplemental street-name signs on intersection warning signs as an option (e.g., an advance street name plaque may be installed above or below an Intersection Warning Sign). The use of advance street name plaques on advance warning signs has been successful in Phoenix, AZ (Rural and Urban Roads, 1973); the size of the lettering on these signs is 8 in (200 mm). Midblock street-name signs provide the same benefit, and are described as an option in section 2D.36 of the MUTCD.
Finally, noting Mace's (1988) conclusions supporting a legibility index as conservative as 30 ft/in to accommodate aging drivers, and the practical limitations of increasing sign panel size, a justification emerges for eliminating the border on street name signs to permit the use of larger characters. The MUTCD (2009) section 2A.14 states that, "Unless otherwise provided, each sign illustrated in this Manual shall have a border of the same color as the legend, at or just inside the edge." In section 2D.43 (Street Name Signs), the MUTCD states that, "Regardless of whether green, blue, or brown is used as the background color for Street Name (D3-1 or D3-1a) signs, the legend (and border, if used) shall be white. For Street Name signs that use a white background, the legend (and border, if used) shall be black." The border on street name signs is presumed to enhance the conspicuity of the sign panel at intersections, where visual complexity and driving task demands may be relatively high. However, the aspect of conspicuity at issue here is 'search conspicuity" rather than "attention conspicuity;" as demonstrated by Cole and Hughes (1984), a sign is noticed at significantly greater distance when a driver expects its presence and knows where to look for it. This is the case with street name signs at intersections. Detecting the presence of street name signs isn't the problem—reading them is. Thus, a strong argument can be made that any marginal reduction in conspicuity that may result from eliminating sign borders will be more than offset by the resultant gains in legibility produced by larger characters in the sign legend.
Drivers approaching an unsignalized intersection must be able to detect the presence of the intersection and then detect, recognize, and respond to the intersection traffic control devices present at the intersection. Next, drivers must detect potential conflict vehicles, pedestrian crosswalk locations, and pedestrians at or near the intersection. Proper allocation of attention has become more difficult, as drivers are overloaded with more traffic, more signs, and more complex roadway configurations and traffic patterns, as well as more complex displays and controls in newer vehicles (Dewar, 1992). The presence of large commercial signs near intersections has been associated with a significant increase in crashes at stop-controlled intersections (Holahan, 1977).
Age-related deficits in vision and attention are key to developing recommendations for improved stop control and yield control at intersections. Researchers examining the State crash records of 53 aging drivers found that those with restrictions in their "useful field of view," a measure of selective attention and speed of visual processing, had 15 times more intersection crashes than those with normal visual attention (Owsley, et al., 1991). A follow-up study with a sample of 300 drivers demonstrated that visual attention deficits could account for up to 30 percent of the variance in intersection crash experience (Ball, et al., 1993). Additional relevant findings may be cited from a simulator study of peripheral visual field loss and driving impairment which also examined the actual driving records of the study participants (Szlyk, Severing, and Fishman, 1991). It was found that visual function factors, including acuity as well as visual field measures, could account for 26 percent of the variance in real-world crashes. Also, greater visual field loss was associated in the simulator data with greater distance traveled ("reaction distance") before responding to a peripheral stimulus (e.g., a STOP sign).
A considerable body of evidence exists documenting the difficulties of aging driver populations in negotiating stop-controlled intersections. Specifically, analyses of crash and violation types at these sites highlight the aging driver's difficulty in detecting, comprehending, and responding to signs within an appropriate timeframe for the safe completion of intersection maneuvers.
Statistics on Iowa fatal crashes show that during 1986–1990, running STOP signs was a contributing circumstance in 297 fatal crashes which killed 352 people; drivers age 65 and older accounted for 28 percent of the fatal crashes, and drivers younger than age 25 were involved in 27 percent of the fatal crashes (Iowa Department of Transportation, 1991). Stamatiadis, Taylor, and McKelvey (1991) found that at stop-controlled urban intersections, the percentage of drivers age 75 and older involved in right-angle crashes was more than double that of urban signalized intersections. Malfetti and Winter (1987), reporting on the unsafe driving performance of drivers age 55 and older, noted that aging drivers frequently failed to respond properly or respond at all to road signs and signals; descriptions of their behavior included running red lights or STOP signs and rolling through STOP signs. Some aging persons' behavior at STOP signs and signals seemed to indicate that they did not understand why they needed to wait when no other traffic was coming. Brainan (1980) used in-car observation to gain firsthand knowledge and insight into aging people's driving behavior. Drivers in the 70 and older age group showed difficulty at two of the STOP signs on the test route; their errors were in failing to make complete stops, poor vehicle positioning at STOP signs, and jerky and abrupt stops. Campbell, Wolfe, Blower, Waller, Massie, and Ridella (1990), looking at police reports of crossing crashes at unsignalized intersections, found that aging drivers often stopped and then pulled out in front of oncoming traffic, whereas younger drivers more often failed to stop at all. Further evidence of unsafe behaviors by aging drivers was provided in a study by McKnight and Urquijo (1993). Their data consisted of 1,000 police referral forms from the motor vehicle departments of California, Maryland, Massachusetts, Michigan, and Oregon; the forms included observations of incompetent behavior exhibited by aging drivers who were stopped for a violation by law enforcement personnel or were involved in a crash. The specific behaviors contributing to the contact between the aging driver and the police officer included failing to yield right-of-way or come to a complete stop at a STOP sign, and failing to stop or yield to other traffic; taken together, these behaviors contributed to significant numbers of crashes (74) and violations (114).
| Applications in Standard Reference Manuals | ||||
|---|---|---|---|---|
| MUTCD (2009) | AASHTO Green Book (2011) | NCHRP 500 – Volume 9 (2004) | NCHRP 279 Intersection Channelization Design Guide (1985) | Traffic Engineering Handbook (2009) |
| Sect. 1A.13, regulatory sign Tables 2B-1 & 2C-4 Sects. 2B.03 through 2B.12, 3B.16 & 2C.36 |
Pgs. 3-2 through 3-6, Sect. 3.2.2 Stopping Sight Distance Pg. 9-30, Fig.9-15 Pgs. 9-36 through 9-50, Sects. on Case B-Intersections with Stop Control on the Minor Road & Case C—Intersections with Yield Control on the Minor Road Pg. 9-180, Para. 2 Pg. 10-90, Sect. on At-grade terminals Pg. 10-105, Para. 1 |
Pgs. V-8-V-11, Sect. on Strategy 3.1 B1: Provide Advance Warning Signs (T) | Pg. 9, Figs. 2-5 & 2-7 Pg. 10, Table 2-4, 4th bullet Pg. 21, Fig. 3-1 |
Pgs. 357, Sects. on Regulatory Signs Pg. 381, Sect. on Stop and Yield Lines Pgs. 629-630, Sects. on Yield Control and Stop Control Pgs. 110-111, Sect. on Traffic Characteristics at Unsignalized Intersections Pg. 391-392, Sect. on Older Drivers and Pedestrians |
Data from 124,000 two-vehicle crashes (54,000 crashes at signalized intersections and 70,000 crashes at unsignalized intersections) showed that drivers younger than age 25 and older than age 65 were overinvolved in crashes at both types of intersections (Stamatiadis et al. 1991). However, the overinvolvement of aging drivers in unsignalized intersection crashes was more pronounced than it was for signalized intersection crashes. Although the total number of crashes was reduced at unsignalized intersections that contained signs when compared with unsigned intersections, the crash involvement ratios of aging drivers were higher at signed intersections than at unsigned intersections. At unsignalized intersections, the highest percentage of fatalities resulted from right-angle collisions (25 percent). In terms of the frequency of injury at unsignalized intersections, rear-end crashes were the most frequent cause (35 percent), followed by right-angle crashes (18 percent), other-angle crashes (10 percent), and head-on/left-turn crashes (8 percent). The leading violation types for all aging drivers in descending order were failure to yield right-of-way, following too closely, improper lane usage, and improper turning. At unsignalized intersections, aging drivers showed the highest crash frequency on major streets with two lanes in both directions (a condition most frequently associated with high-speed, low-volume rural roads), followed by roads with four lanes, and those with five lanes in both directions. These configurations were most often associated with low-speed, high-volume urban locations, where intersection negotiation involves more complex decisions involving more conflict vehicles and more visually distracting conditions.
Cooper (1990) utilized a database of all 1986 police-attended crashes in British Columbia, in an effort to compare the crash characteristics of aging drivers with those of their younger counterparts. While 66.5 percent of crashes involving drivers ages 36–50 occurred at intersections, the percentage increased to 69.2 percent, 70.7 percent, and 76.0 percent for drivers ages 55–64, 65–74, and 75 and older, respectively. Overall, the two oldest groups identified in this analysis were significantly more crash involved at STOP/YIELD sign locations and less involved at either uncontrolled or signal-regulated locations. In follow-on questionnaires administered to a sample of drivers in each age group studied, intersection negotiation was mentioned by the aging drivers as second in difficulty to problems changing lanes. About 20 percent of the aging drivers mentioned not stopping properly at STOP signs. Vehicle maneuvering prior to the crash was a key variable for drivers over age 65, and in particular, for left turns at uncontrolled or STOP/YIELD sign-controlled intersections. Drivers ages 36–50 experienced only 10.9 percent of their crashes while turning left at this type of intersection, compared with 13.0, 15.4, and 19.5 percent of drivers ages 55–64, 65–74, and 75 and older, respectively.
Council and Zegeer (1992) conducted an analysis of intersection crashes occurring in Minnesota and Illinois for the time period of 1985–1987 to highlight crash types, situations, and causes of crashes, in an effort to increase the knowledge of how aging drivers react at intersections. For all the analyses, comparisons were made between a "young-old" group (ages 65–74), an "old-old" group (age 75 or older), and a "middle-aged" comparison group (ages 30–50). Their findings regarding driver age differences in collision types, pre-crash maneuvers, and contributing factors are described below.
With respect to collision type at stop-controlled intersections, analysis of the data showed little difference in the proportion of crashes involving left-turning vehicles at either urban or rural locations when the older groups were compared with the middle-aged group. There was, however, a significant over-involvement for both groups of older drivers in right-angle collisions, both in urban and in rural locations. At urban intersections, right-angle collisions accounted for 56.1 percent of the middle-aged driver crashes, compared with 64.7 percent of the young-old, and 68.3 percent of the old-old driver crashes. These percentages increase for all groups at rural intersections—61.3, 68.6, and 71.2 percent, respectively for middle-aged drivers, young-old drivers, and old-old drivers. Data for yield-controlled intersections showed older drivers over-contributing to left-turn collisions in urban areas and to angle collisions in both urban and rural areas.
Regarding pre-crash maneuvers at stop-controlled intersections, for both rural and urban locations, right-angle collisions were the most frequent collisions, and middle-aged drivers were more likely to be traveling straight or slowing/stopping than the two older groups. The older drivers were more likely to be turning left or starting from a stop than their younger counterparts. The pattern is similar for left-turning crashes. For rear-end collisions, the old-old drivers were more likely to be going straight (thus being the striking vehicle), and the middle-aged and young-old drivers were more likely to be stopped or slowing. For the few right-turning collisions at urban stop-controlled intersections, the middle-aged drivers were going straight and the old-old drivers were more likely to be turning left or right or starting from a stop. Rural stop-controlled locations showed the same patterns of pre-crash maneuvers among the three age groups.
Finally, breakdowns of contributing factors for the urban and rural stop-controlled intersections showed that the middle-aged drivers exhibited a higher proportion of no improper driving behavior, while the young-old and old-old drivers were more often cited for failure-to-yield, disregarding the STOP sign, and driver inattention. When starting from a stop, however, the old-old drivers had a lower probability of being cited for improper driving. When cited, the old-old group was more likely to have disregarded the STOP sign than the other two driver groups. The young-old drivers as well as the old-old drivers more frequently failed to yield than the middle-aged drivers.
For left turns, the middle-aged drivers again were more frequently found to have exhibited "no improper driving." The two older driver groups were most frequently cited with failure-to-yield. There was no difference in the number of drivers in each age group who disregarded the STOP sign. For going-straight situations, the middle-aged driver was found to have exhibited no improper driving behavior twice as often as the young-old driver and almost three times as often as the old-old driver. Failing to yield, disregarding the STOP sign, and inattention were most often cited as the contributing factor for the two older groups.
Signing countermeasures to improve safe operation by aging drivers at stop- and yield-controlled intersections follow.
Greene, et al. (1996) noted that the MUTCD provides for the possibility of enlarging STOP signs where greater emphasis or visibility is required. They proposed an enlargement from 30 x 30 in to 36 x 36 in at well-traveled intersections or at intersections of small country lanes with State highways. This would also be appropriate at intersections where there is a high incidence of STOP-sign running. Further, Swanson, Dewar, and Kline (1994) reported that aging drivers participating in focus group discussions in Calgary, Alberta, Canada; Boise, Idaho; and San Antonio, Texas indicated a need for bigger and brighter STOP signs.
Mace and Pollack (1983) noted that conspicuity is not an observable characteristic of a sign but a construct which relates measures of perceptual performance with measures of background, motivation, and driver uncertainty. In this regard, conspicuity may be aided by multiple treatments or advance signing as well as changes in size, contrast, and placement. They noted that STOP signs following a STOP AHEAD (W3-1a) sign are more conspicuous not only to aging drivers but to everyone, because expectancy has been increased.
The need for appropriate levels of brightness to ensure conspicuity and timely detection by drivers of highway signs, including STOP and YIELD signs, was addressed in FHWA-sponsored research to establish minimum retroreflectivity requirements for these devices (minimum maintained levels, as opposed to new or in-service levels). Mace developed a model to derive the retroreflectivity levels necessary for adequate visibility distance, taking into account driver age and visual performance level, as well as the driver's response requirements (action versus no action) to the information presented on a given sign when encountered in a given situation (city, highway) with an assumed operating speed (ranging from 10 mph to 65 mph), for signs of varying size and placement (shoulder, overhead). This work is reported by Ziskind, et al. (1991), who conducted laboratory and controlled field studies using 200 younger and older drivers (ages 16 to 70+) to determine the minimum visibility requirements for traffic control devices. Taking speed and sign application into account, the recommended (minimum maintained, below which the sign should be replaced) retroreflectivity for STOP signs resulting from this research ranged between 10 cd/lux/ m2 up to 24 cd/lux/ m2 for the sign background (red) area, with significantly higher values for the sign legend. For the YIELD sign, the recommended minimum maintained levels ranged between 24 and 39 cd/lux/ m2. These units, in cd/lux/m2, or coefficient of retroreflection (RA) express the efficiency with which the material is able to return incident light at a given geometry between the sign, the vehicle, and the driver. A retroreflectometer is used to obtain these data in the field; reflectivity of a material is measured at specific angles. The observation angle is the angle between the headlamps, the sign, and the driver's eye. The RA measurements provided by FHWA are all measured at a 0.2 degree observation angle, which corresponds roughly to a viewing distance of 700 ft, for a right shoulder-mounted sign on a straight road viewed from a passenger sedan. This is important, because in general, as a vehicle approaches a sign, the observation angle becomes larger, reaching 1.0 degrees at 300 ft, which is roughly legibility distance. Knowing the RA of a material at 0.2 degrees does not automatically predict its reflectivity at a closer distance (larger observational angle). Because both the STOP and YIELD signs are so extensively overlearned by drivers, their comprehension is believed to be associated with the icon, i.e., their unique shape and coloration. Thus, the brightness of the sign's background area is most critical, because these devices will typically be recognized and understood as soon as they are detected (the conspicuity distance), rather than closer in (legibility distance).
Mercier, et al. (1995) conducted a laboratory study using younger and older drivers to measure the minimum luminance thresholds for traffic sign legibility, to accommodate varying percentages of the driving population. The purpose of the study was to evaluate the proposed minimum retroreflectivity values derived using CARTS (Computer Analysis of the Retroreflectance of Traffic Signs) that uses a mathematical model to study the relationships between driver variables, vehicle variables, sign variables, and roadway variables (Paniati and Mace, 1993). This model uses MRVD (Minimum Required Visibility Distance), which is the shortest distance at which a sign must be visible to enable a driver to respond safely and appropriately, and includes the distance required for a driver to detect the sign, recognize the message, decide on a proper action, and make the appropriate maneuver before the sign moves out of the driver's view. Paniati and Mace's minimum in-service values (below which sign replacement is indicated) were reported to accommodate an unknown level between 75 to 85 percent of all drivers (see Table 27).
| Sign Size (in) | Speed (mph) | Minimum Retroreflectivity (cd/lux/m2) |
|---|---|---|
| 30 | ≥45 | 70 (white) 14 (red) |
| 30 | ≤40 | 40 (white) 8 (red) |
| 36 | ≥45 | 60 (white) 12 (red) |
| 36 | ≤40 | 35 (white) 7 (red) |
| 48 | ≥45 | 50 (white) 10 (red) |
| 48 | ≤40 | 30 (white) 6 (red) |
The subjects in the Mercier et al. (1995) study included 10 drivers ages 16 to 34; 10 drivers ages 35 to 44; 10 drivers ages 45 to 54; 10 drivers ages 55 to 64; 13 drivers ages 65 to 74; and 10 drivers age 75 or older. All subjects had a visual acuity of at least 20/40. Subjects viewed 25 scaled signs at two distances to simulate minimum required visibility distances (MRVD) traveling at 30 mph and 55 mph. Among the signs tested were white-on-red regulatory signs. Illumination levels were manipulated using 20 neutral density filters ranging from 0.02 to 3.0. Type I engineering grade sheeting was used for all signs.
Retroreflectance values were calculated based on the luminance levels needed to accommodate 67, 85, and 95 percent of the population of U.S. drivers. Mercier et al. (1995) concluded that the values recommended by Paniati and Mace (1993), reproduced in Table 27 for the white on red signs, are sufficient to accommodate a high percentage of drivers, with the exception of a few signs, which includes the YIELD sign. The 95th percentile driver could not be accommodated by the minimum retroreflectivity suggested for the YIELD sign measuring 30 in, for MRVD at both 30 and 55 mph. The authors point out that increasing brightness for this sign does not increase legibility for aging drivers; instead, a redesign of the sign or an enlargement would be needed to enable aging drivers to resolve the level of detail required for recognition.
Next, there has been increasing interest in the use of durable fluorescent sheeting for highway signs, because of its increased conspicuity over standard highway sign sheeting, under daytime conditions. Highway signs with fluorescent sheeting have been found to be more conspicuous and can be detected at a further distance than signs with standard sheeting of the same color. In addition, the color of fluorescent signs is more frequently recognized correctly at farther distances than standard sheeting of the same color (Jenssen, et al., 1996; Burns and Pavelka, 1995). Of particular interest, however, are findings reported by Burns and Pavelka (1995) for a field study conducted at dusk (15 min after sunset), without the use of vehicle headlights. In this study, 14 drivers ages 19 to 57 (median age = 40 years) viewed signs with fluorescent red sheeting and signs with standard red sheeting at a distance of 98 ft. The signs with fluorescent red sheeting were detected by 90 percent of the participants; only 23 percent were able to detect the standard red signs. In terms of correct color recognition, 49 percent were able to correctly recognize the color of the fluorescent red signs at dusk from a distance of 90 ft, compared to 12 percent who correctly identified the standard red signs as red. Luminance measurements of the targets and the background were taken for these north-facing signs at dusk, so that luminance contrast ratios could be calculated. The luminance contrast ratio (Lt-Lb/Lb, or the luminance of the target minus the luminance of the background, divided by the luminance of the background) for the fluorescent red signs was 0.7, and the luminance contrast ratio for the standard red signs was 0.3. The results of this study suggest that the use of fluorescent red sheeting on STOP signs would serve to increase their conspicuity both under daytime and low luminance conditions, and would be of particular benefit to aging drivers, who suffer from decreases in contrast sensitivity and have greater difficulty quickly isolating and attending to the most relevant targets in a cluttered visual background. When additional studies quantify the performance gains for aging road users, recommendations for relatively widespread use of fluorescent sheeting keyed to specific characteristics of stop- and yield-controlled intersections are likely to emerge. Present recommendations for applications of fluorescent sheeting are limited to the special cases of controlling prohibited movements on freeway ramps (see Chapter 3) and for passive control systems at highway-rail grade crossings (see Chapter 6).
A two-way stop requires a driver to cross traffic streams from either direction; this poses a potential risk, because cross traffic may be proceeding rapidly and drivers may be less prepared to accommodate to errors made by crossing or turning drivers. Most critically, drivers proceeding straight through the intersection must be aware of the fact that the cross-street traffic does not stop, and that they must yield to cross-street vehicles from each direction before proceeding through the intersection. Aging drivers are disproportionately penalized by the late realization of this operating condition, due to the various sources of response slowing noted earlier. Studies of cross-traffic signing to address this problem have shown qualified but promising results in a number of jurisdictions (Gattis, 1996). Although findings indicate that conversion of two-way to four-way stop operations may be more effective in reducing intersection crashes than the use of cross-traffic signing, there are obvious tradeoffs for capacity from this strategy. However, data from crash analyses in Arkansas, Oregon, and Florida reported by Gattis (1996) showed significant reductions in right-angle crashes after cross-traffic signing was installed at problem intersections. Until fairly recently, there was no standard sign design to convey this message; Ligon, Carter, and McGee (1985) identified a number of alternate wordings used in different States. In addition, a warrant for use of a cross-traffic sign applied in the State of Illinois may be reviewed in the Gattis (1996) article. The MUTCD (2009) indicates in section 2C.59 that a CROSS TRAFFIC DOES NOT STOP plaque (W4-4p) may be used in combination with a STOP sign when engineering judgment indicates that conditions are present that are causing or could cause drivers to misinterpret the intersection as an all-way stop.
Picha, et al. (1996) conducted a survey of 2,129 drivers in five States (California, Minnesota, Mississippi, Pennsylvania, and Texas) to evaluate driver understanding of right-of-way conditions and preference for supplemental signs at two-way, stop-controlled intersections. The majority of the respondents (59 percent) were between ages 25 and 54; however, 22 percent were age 65 or older. The mail survey presented nine supplemental sign designs (three word messages, three symbol messages, and three word-plus-symbol messages), and respondents were asked to choose the preferred sign in each category that best conveyed the right of way conditions at a two-way, stop-controlled intersection, and then to choose the most preferred design of the three. The sign most often preferred (by 84 percent of the sample) was the CROSS TRAFFIC DOES NOT STOP word message with a horizontal double-headed arrow symbol. When asked whether a supplemental sign was needed at all two-way, stop-controlled intersections to tell drivers who has the right-of-way (a diagram was provided with the question), 44 percent of the drivers responded "yes," 50 percent "no," and 6 percent "not sure." Picha et al. (1996) provided a list of conditions that may lead a driver to misinterpret an intersection to be all-way stop controlled, which would justify a supplemental sign treatment. In addition to intersections converted from four-way to two-way stop control, these include:
The intersection of two single-jurisdictional roadways (e.g., two state-maintained roadways) in a rural or isolated area.
Intersections with similar average daily traffic (ADT) volumes on all approaches, but less than the minimum volumes that would warrant the installation of a traffic signal. Typical volumes ranging from 5,000 to 10,000 ADT will not likely meet signal warrants, but could justify a supplemental treatment.
Intersections with a high conflict frequency and rate, i.e., 20 to 25 conflicts per day (all conflicts combined) or a rate of at least 4 conflicts per 1,000 entering vehicles.
Intersections with a right-angle crash frequency in the range of three to five (or more) per year. Such a condition may not necessarily meet traffic signal warrants.
A system of roadway intersections (at-grade) that is not consistent with respect to traffic control schemes.
Intersections with similar high speeds (i.e., greater than 50 mph on all approaches.
Intersections with similar cross-sectional elements (number and width of lanes, shoulders, grades, drainage) on all approaches.
The issue of driver expectancy, a key predictor of performance for aging motorists, was addressed in a study by Agent (1979) to determine what treatments would make drivers more aware of a stop-ahead situation. Agent concluded that at rural sites, transverse pavement striping should be applied approximately 1,200 ft in advance of the STOP sign to significantly reduce approach speeds. Later research (Agent, 1988) recommended the following operational improvements at intersections controlled by STOP signs: (1) installing additional advance warning signs; (2) modifying warning signs to provide additional notice; (3) adding stop lines to inform motorists of the proper location to stop, to obtain the maximum available sight distance; (4) installing rumble strips, transverse stripes, or post delineators on the stop approach to warn drivers that they would be required to stop; and (5) installing beacons. Although Agent emphasized that beacons do not eliminate the problem of drivers who disregard the STOP sign, flashing beacons used in conjunction with STOP signs at isolated intersections or intersections with restricted sight distance have been consistently shown to be effective in decreasing crashes by increasing driver awareness and decreasing approach speeds (California Department of Public Works, 1967; Cribbins and Walton, 1970; Goldblatt, 1977; King, et al., 1978; Lyles, 1980).
With regard to the crash reduction effectiveness of rumble strips placed on intersection approaches, Harwood (1993) reported that rumble strips can provide a reduction of at least 50 percent in the types of crashes most susceptible to correction, including crashes involving running through a STOP sign. They can also be expected to reduce vehicle speed on intersection approaches and to increase driver compliance with STOP signs. In an evaluation conducted by the Virginia Department of Highways and Transportation (1981a) where rumble strips were installed at stop-controlled intersections, the total crash frequency was reduced by 37 percent, fatal crashes were reduced by 93 percent, injury crashes were reduced by 37 percent, and property-damage-only crashes were reduced by 25 percent. In this study, 39 of the 141 crashes in the before period were classified as being types susceptible to correction by rumble strip installation, particularly rear-end crashes and ran-STOP-sign crashes. The crash rate for these crash types was reduced by 89 percent. Carstens and Woo (1982) found that primary highway intersections where rumble strips were installed experienced a statistically significant reduction in the crash rate in the first year or two following their installation, both at four-way and T-intersections. The crash rate at the 21 study intersections decreased by 51 percent for total crashes and by 38 percent for ran-STOP-sign crashes. Carstens and Woo found no statistically significant change in crash rate at 88 intersections on secondary roads where rumble strips were installed. They concluded that rumble strips are more effective at primary highway intersections than secondary road intersections for the following reasons: (1) primary highways serve a higher proportion of drivers who are unfamiliar with the highway; (2) trips tend to be longer on primary highways so that fatigue and the monotony of driving may play a more important role than on secondary roads; (3) traffic volumes are higher on primary highways, so the number of potential conflicts is greater; and (4) the geometric layout of primary highway intersections is often more complex than that of secondary road intersections. These researchers also found that rumble strips may be more effective in reducing nighttime crashes at unlighted intersections than at lighted intersections. Harwood (1993) reported that several highway agencies commented that it was important to avoid the temptation to use rumble strips where they are not needed; if every intersection had rumble strips on its approach, rumble strips would soon lose their ability to focus the attention of the motorist on an unexpected hazard.
Before concluding this discussion, certain aspects of YIELD sign operations deserve mention. A YIELD sign facilitates traffic flow by preventing unnecessary stops and allowing drivers to enter the traffic flow with minimum disruption of through traffic. Most YIELD signs are posted where right-turning drivers can approach the cross street at an oblique angle. Such configurations benefit elderly drivers in carrying out the turning maneuver by avoiding the tight radii that characterize right-angle turns. However, in several respects, intersections regulated by YIELD signs place greater demands upon drivers than those employing other controls, in terms of gap selection, difficulty with head turning, lane-keeping, and maintaining or adjusting vehicle speed. The angle of approach to the street or highway being entered ranges from the near perpendicular to the near parallel. The closer the angle is to the parallel, the further the driver must turn his/her head to detect and to judge the speed and distance of vehicles on the road to be entered. Many elderly drivers are unable to turn their heads far enough to get a good look at approaching traffic, while the need to share attention with the road ahead necessarily limits the gap search to 1 or 2 s. Some drivers are reduced to attempting to judge distance and gaps by means of the outside mirror. The inability to judge gaps in this manner often results in the driver reaching the end of the access lane without having identified an appropriate gap. The driver in this situation comes to a complete stop and then must enter the cross street by accelerating from a stopped position. The difficulty in judging gaps may lead to aborted attempts to enter the roadway, leaving the aging driver vulnerable to following drivers who direct their attention upstream and fail to notice that a vehicle has stopped in front of them. The need to share attention between two widely separated points results in eyes being off the intended path for lengthy periods. The diversion of attention, along with movement of the upper torso, hampers the aging driver's ability to maintain directional control.
McGee and Blankenship (1989) reported that intersections converted from stop to yield control are likely to experience an increase in crashes, especially at higher traffic volumes, at the rate of one additional crash every 2 years. In addition, converted yield-controlled intersections have a higher crash rate than established yield-controlled intersections. They note that while yield control has been found to be as safe as stop control at very low volumes, the safety impacts are not well established for higher volume levels. Agent and Deen (1975) reported that rural road crash types at yield-controlled intersections are different from those at stop-controlled intersections. At YIELD signs, more than half of the crashes were rear-end collisions, while more than half of the crashes at STOP signs were angle collisions.
As a driver approaches an intersection with the intention of traveling straight through, or turning onto an intersecting roadway, he/she must first determine whether the currently traveled lane is the proper one for executing the intended maneuver. This understanding of the downstream intersection geometry is accomplished by the driver's visual search and successful detection, recognition, and comprehension of pavement markings (including stripes, symbols, and word markings); regulatory and/or advisory signs mounted overhead, in the median, and/or on the shoulder in advance of the intersection; and other geometric feature cues such as curb and pavement edge lines, pavement width transitions, and surface texture differences connoting shoulder or median areas. Uncertainty about downstream lane assignment produces hesitancy during the intersection approach; this in turn decreases available maneuver time and diminishes the driver's attentional resources available for effective response to potential traffic conflicts at and near intersections.
Aging drivers' decreased contrast sensitivity, reduced useful field of view, increased visual search and decision times—particularly in response to unexpected events—and slower vehicle control during movement execution combine to put these highway users at greater crash risk when approaching and negotiating intersections. Contrast sensitivity and visual acuity are the visual/perceptual requirements necessary to detect pavement markings and symbols and to read lane control signs and word and symbol pavement markings. The early detection of lane control devices, by cueing the driver in advance that designated lanes exist for turning and through maneuvers, promotes safer and more confident performance of any required lane changes. This is because the traffic density is lighter, there are more available gaps, and there are fewer potential conflicts with other vehicles and pedestrians the farther away from the intersection the maneuver is performed. Of course, even the brightest delineation and pavement markings will not be visible to an operator unless an adequate sight distance (determined by horizontal and vertical alignment) is available.
In an effort to analyze the needs and concerns of aging drivers, the Illinois Department of Transportation sponsored a statewide survey of 664 drivers, followed up by focus group meetings held in rural and urban areas (Benekohal, et al. 1992). Within this sample, the following four age categories were used for statistical analyses: ages 66–68, ages 69–72, ages 73–76, and age 77 and older. Comparisons of responses from drivers ages 66–68 and age 77 and older showed that the older group had more difficulty following pavement markings, finding the beginning of the left-turn lane, driving across intersections, and driving during daytime. Similarly, the level of difficulty for reading street signs and making left turns at intersections increased with increasing driver age. Turning left at intersections was perceived as a complex driving task, made more difficult when channelization providing visual cues was absent and only pavement markings designated which lane ahead was a through lane and which was a turning lane. The processes of lane location, detection, and selection must be made upstream at a distance where a lane change can be performed safely. Late detection by aging drivers will result in erratic maneuvers such as lane weaving close to the intersection (McKnight and Stewart, 1990).
More than half of 81 aging drivers participating in another set of focus group discussions stated that quite often they suddenly find themselves in the wrong lane, because (1) they have certain expectations about lane use derived from intersections encountered earlier on the same roadway, (2) the advance signing is inadequate or lacking, or (3) the pavement markings are covered by cars at the intersection (Staplin, et al., 1997). The biggest problem with turn-only lanes reported by group participants was that there is not enough warning for this feature. The appropriate amount of advance notice, as specified by these drivers, ranged from 5 car lengths to 1 mi. Sixty-four percent of the participants said that multiple warning signs are necessary when the right lane becomes a turn-only lane, with the need for an initial sign 20 to 30 s away, and a second sign 10 s away from the turn location. The remaining participants said that these distances should be increased.
| Applications in Standard Reference Manuals | |||
|---|---|---|---|
| MUTCD (2009) | AASHTO Green Book (2011) | NCHRP 279 Intersection Channelization Design Guide (1985) | Traffic Engineering Handbook (2009) |
| Sect. 1A.13, approach Table 2B-1 Sects. 2B.19 through 2B.27, 2B.42 through 2B.48,Sects. 2B.51 through 2B.55, Fig. 2B-4 Sects. 3A.01, 3A.02, 3A.06, & 3B.05 Figs. 3B-13 Sect. 3B.20 Figs. 3B-18, 3B-23, 3B-24, & 3B-27 |
Pgs. 5-13 through 5-14, Sects. on Width of Traveled Way & Parking Lanes Pg. 6-13, Para. 5 Pg. 7-31, Para. 6 Pgs. 9-10 through 9-19, Sects. 9.3.1 and 9.3.2 Three-Leg Intersections & Four-Leg Intersections Pg. 9-131 through 9-133, sect. on Guidelines for Design of Left-Turn Lanes Pgs. 9-11 and 9-13, Figs. 9-4 and 9-5 Pgs. 9-124 through 9-125, Sect. 9.7.1 General Design Considerations Pgs. 9-124 through 9-40, Sect. 9.7 Auxiliary Lanes Pgs. 9-176 through 9-179, Sect. 9.11.1 Intersection Design Elements with Frontage Roads Pgs. 9-180 through 9-181, Sect. 9.11.3 Bicycles Pgs. 9-182 through 9-183, Sect. 9.11.7 Midblock Left Turns on Streets with Flush Medians |
Pg. 1, Item 2, 3rd bullet Pg. 19, Middle fig. Pg. 21, 2nd col., item 1 Pg. 24, Para. 1 & top fig. Pg. 32, Bottom fig. Pg. 34, Para. 1 & two figs. Pg. 35, Top right fig. Pg. 36, Para. 1 & top & bottom figs. Pg. 37, Para. 2 & top two figs. Pgs. 47-48, Sect. on Warrants/ Guide-lines For Use of Left-Turn Lanes Pg. 51, Fig. 4-12 Pg. 57, Sects. on Double Left-Turn Lanes—Guidelines for Use & Guidelines for Implementation of COTWLTL Pg. 59, Fig. 4-20 Pgs. 61-63, Sect. on Exclusive Right-Turn Lanes Pgs. 92-97, Intersct. Nos. 2 & 4 Pgs. 99-119, Intersct. Nos. 6-16 Pgs. 132-139, Intersct. Nos. 22-24 & 29 Pgs. 142-144, Intersct. Nos. 31-33 Pgs. 146-153, Intersct. Nos. 34-37 |
Pg. 243, 2nd & 7th Principles Pg. 391-392, Sect. on Older Drivers and Pedestrians |
Even greater consensus was shown in this study regarding sign location for lane assignment. Seventy-nine percent of the group reported that overhead lane-use signs are far more effective than roadside-mounted signs for this type of warning. Several participants suggested that a combination of roadside and overhead signs, in addition to roadway markings, would be beneficial. Although roadway markings were deemed helpful, 84 percent of all participants stated that they are useless in isolation from signs, because they are usually at the intersection and are obscured by traffic, and they are frequently worn and faded. The result is that drivers end up in the wrong lane and must go in a direction they had not planned for, or they try to change lanes at a point where it is not safe to do so. Thus, a general conclusion from this study is that overhead signing posted in advance of, as well as at, an intersection provides the most useful information to drivers about movement regulations which may be difficult to obtain from pavement marking arrows when traffic density is high or when pavement markings are obscured by snow or become faded, or where sight distance is limited.
In an early study conducted by Hoffman (1969), the installation of overhead lane-use control signs in advance of six intersections in Michigan contributed to a reduction in the total number of crashes by 44 percent in a 1-year period, and a reduction in the incidence of crashes caused by turning from the wrong lane by 58 percent. Later, older drivers (as well as their younger counterparts) were shown to benefit from redundant signing (Staplin and Fisk, 1991). In addition to redundant information about right-of-way movements at intersections, drivers should be forewarned about lane drops, shifts, and merges through advance warning signs, and ideally these conditions should not occur close to an intersection. Advance route or street signing as well as reassurance (confirmatory) signing/route marker assemblies across the intersection will aid drivers of all ages in deciding which lane will lead them to their destination, prior to reaching the intersection.
The 2009 MUTCD specifies in section 2B.19 that Intersection Lane Control signs should be mounted overhead, except where the number of through lanes for an approach is two or less, where the Intersection Lane Control signs (R3-5 through R3-8) may be overhead or ground mounted. The Mandatory Movement Lane Control signs (R3-5, R3-5a, R3-7, and R3-20) are required to be located where the regulation applies. The Optional Movement Lane Control Sign (R3-6) is required to be located in advance of and/or at the intersection where the regulation applies. The section on Advance Intersection Lane Control signs (sign series R3-8, section 2B.22), states that when used, these signs should be placed at an adequate distance in advance of the intersection so that road users can select the appropriate lane (e.g., in advance of the tapers or at the beginning of the turn lane). Where three or more approach lanes are available to traffic, Advance Intersection Lane Control signs, if used, shall be post-mounted in advance of the intersection and shall not be mounted overhead. Section 3B.20 indicates that where through lanes become mandatory turn lanes, lane-use arrow markings shall be used and shall be accompanied by standard signs.
Although pavement markings have obvious limitations (e.g., limited durability when installed in areas exposed to heavy traffic, poor visibility on wet roads, and obscuration by snow in some regions), they have the advantage of presenting information to drivers without distracting their attention from the roadway.
Finally, the Institute of Transportation Engineers identified several features to enhance the operation of urban arterial trap lanes (through lanes that terminate in an unshadowed mandatory left- or right-turn regulation): (1) signing that gives prominent advance notice of the unexpected mandatory turn regulation, followed by a regulatory sign at the point where the mandatory turn regulation takes effect, followed by a third sign at the intersection itself if there are intervening driveways from which motorists might enter the lane; (2) supplemental pavement markings which consist of a double-width broken lane line beginning at the advance warning sign and extending to the first regulatory sign; (3) a pavement legend in the trap lane; and (4) overhead signing. Candidates for these remedial treatments include left-turn trap lanes on roadways with high volumes, high speeds, poor approach visibility, and complex geometrics (Foxen, 1986).
Traffic signals are power-operated signal displays used to regulate or warn traffic. They include displays for intersection control, flashing beacons, lane-directional signals, ramp-metering signals, pedestrian signals, railroad-crossing signals, and similar devices. Warrants for traffic signals are thoroughly described in the MUTCD. The decision to install a traffic signal is based on an investigation of physical and traffic flow conditions and data, including traffic volume, approach travel speeds, physical condition diagrams, crash history, and gap and delay information (Wilshire, 1992). The MUTCD incorporates the intensity, light distribution, and chromaticity standards from the following Institute of Transportation Engineers (TEH) standards for traffic signals: Vehicle Traffic Control Signal Heads, TEH Standard No ST-008B (TEH, 1985b); Pedestrian Traffic Control Signal Indications, TEH Standard No. ST-011B (TEH, 1985a); Traffic Signal Lamps, TEH Standard No. ST-010 (TEH, 1986); Lane-Use Traffic Control Signal Heads (TEH,1980); Vehicle Traffic Control Signal Heads: Light Emitting Diode (LED) Circular Signal Supplement, TEH Standard No. ST-052 (TEH, 2005); and Vehicle Traffic Control Signal Heads: Light Emitting Diode Vehicle Arrow Traffic Signal Supplement, TEH Standard No. ST-054 (TEH, 2008). Standards for traffic signals are important because it is imperative that they attract the attention of every driver, including aging drivers and those with impaired vision who meet legal requirements, as well as those who are fatigued or distracted, or who are not expecting to encounter a signal at a particular location. It is also necessary for traffic signals to meet motorists' needs under a wide range of conditions including bright sunlight, nighttime, in adverse weather, and in visually cluttered surroundings.
| Applications in Standard Reference Manuals | |||
|---|---|---|---|
| MUTCD (2009) | AASHTO Green Book (2011) | NCHRP 500 – Volume 9 (2004) | Traffic Engineering Handbook (2009) |
| Sect. 1A.13, flashing & traffic control signal (traffic signal) Sects. 4A.02, 4D.01, 4D.04, through 4D.31, 4E.03 through 4E.13, 4I.02, 4J.02, 4M.03, & 4L.01 MUTCD references to TEH standards ST-008B, ST-011B, ST-010 & Lane-Use Traffic Control Signal Heads |
Pg. 2-62, Para. 2 Pgs. 3-76, Paras. 2-4 Pg. 6-19, Sect. on Traffic Control Devices Pgs. 7-43 through 7-44, Sect. on Traffic Control Devices Pg. 9-19, Paras. 2 & 3 & Fig. 9-9 on pg. 9-18 Pg. 9-51, Sect. on Case D-Intersections with Traffic Signal Control Pg. 9-180, Paras. 3 & 4 Pg. 10-38, Para. 1 Pg. 10-105, Para. 1 |
Pgs. V-17-V-18, Sect. on Strategy 3.1 B4: Provide All-Red Clearance Interval at Signalized Intersection (T) | Chapter 12 |
To date, studies of traffic signal performance have not typically included observer age as an independent variable. Available evidence suggests, however, that aging individuals have reduced levels of sensitivity to intensity and contrast, but not to color. Fisher (1969) reported that as a person ages, the ocular media yellows and has the effect of enhancing the contrast between a red signal and a sky background. However, this effect is more than offset by increasing light scatter within the eye, which diminishes contrast. Aging drivers need increased levels of signal luminance and contrast in certain situations to perceive traffic signals as efficiently as 20- to 25-year-old drivers; however, higher signal intensities may cause disability glare. Fisher and Cole (1974), using data from Blackwell (1970), suggested that aging drivers may require 1.5 times the intensity at 50 years of age and 3 times the intensity at 70 years of age, and protanopes (individuals with a color-vision deficiency resulting in partial or full insensitivity to red light) may require a fourfold increase. They noted that while increased intensity will ensure that aging observers see the signal, the reaction time of aging drivers will be longer than for younger drivers. To compensate for this, it would appear necessary to assume a longer required visibility distance, which would result in an increase in the signal intensity required. However, Fisher (1969) also suggested that no increase in signal intensity is likely to compensate for increasing reaction time with age. It therefore deserves emphasis that the goal of increased response times for aging drivers, requiring longer visibility distances, can also be provided by ensuring that the available signal strength (peak intensity) is maintained through a wide, versus a narrow, viewing angle. This makes signal information more accessible over longer intervals.
It is generally agreed that the visibility issues associated with circular signals relate to the following factors: minimum daytime intensity, intensity distribution, size, nighttime intensity, color of signals, backplates, depreciation (light loss due to lamp wear and dirt on lenses), and phantom (apparent illumination of a signal in a facing sun). To place this discussion in context, it should also be noted that traffic signal recommendations for different sizes, colors, and in-service requirements have, in large part, been derived analytically from one research study conducted by Cole and Brown (1966).
In establishing minimum daytime intensity levels for (circular) traffic signals, the two driver characteristics that are considered with regard to the need to adjust peak intensity requirements are color anomalies and driver age. Cole and Brown (1968) determined that the optimum red signal intensity is 200 cd for a sky luminance of 10,000 cd/m2, and an adequate signal intensity for this condition would be 100 cd. Cole and Brown (1966, 1968) defined "optimum" as "a signal intensity that provides a very high probability of recognition and which also evokes the shortest response times from the observer." In their research, very high probability was defined as 95 to 100 percent probability of detection. An "adequate signal," although not likely to be missed, results in driver reaction time that is slower than for a signal of "optimum" intensity.
The number of foreign and domestic highway organizations that specify a minimum standard for peak daytime traffic signal intensity is larger than the number of research studies upon which those standards are based. In fact, all of the standards including those for 8-in (200-mm) and 12-in (300-mm) signals, those for red, yellow, and green signals, and those for new and in-service applications are derived from a single requirement for a red traffic signal, established from the work of Cole and Brown (1966). The conclusion of this laboratory study was that a red signal with an intensity of 200 cd should invoke a "certain and rapid response" from an observer viewing the signal at distances up to 328 ft even under extremely bright ambient conditions. This conclusion was based on experiments in which the background luminance was 5,142 cd/m2. The results were linearly extrapolated to a background luminance of 10,000 cd/m2 which yielded the 200-cd recommendation. Janoff (1990) concluded that a value of 200 cd minimum intensity for a red signal will suffice for observation distances up to 328 ft and vehicle speeds up to 50 mph, based on analytic, laboratory, and controlled field experiments performed by Adrian (1963); Boisson and Pages (1964); Rutley, Christie, and Fisher (1965); Jainski and Schmidt-Clausen (1967); Cole and Brown (1968); Fisher (1969); and Fisher and Cole (1974). Fisher and Cole (1974) cautioned against using a value less than 200 cd, to ensure that aging drivers and drivers with abnormal color vision will see the signal with certainty and with "reasonable speed."
For green signals, Fisher and Cole (1974) indicated that the ratio of green to red intensity should be 1.33:1, based on laboratory and controlled field research by Adrian (1963), Rutley et al. (1965), Jainski and Schmidt-Clausen (1967), and Fisher (1969), and the ratio of yellow to red should be 3:1, based on research performed by Rutley et al. (1965) and Jainski and Schmidt-Clausen (1967). Janoff (1990) noted that the evidence to support these ratios is somewhat variable, and support of these recommendations is mixed. Table 30, from Janoff (1990), presents the peak intensity requirements of red, green, and yellow traffic signals for 200-mm (8-in) signals for normal-speed roads and for 12-in signals for high-speed roads; the values presented exclude the use of backplates and ignore depreciation. A normal-speed road, in this context, includes speeds up to 50 mph, distances up to 328 ft, and sky luminances up to 10,000 cd/m2. A high-speed road is defined as one with speeds up to 62 mph, distances up to 787 ft, and sky luminances up to 10,000 cd/m2. Janoff also noted that although signal size is included, research performed by Cole and Brown (1968) indicated that signal size is not important because traffic signals are point sources rather than area sources and only intensity affects visibility. Thus, the required intensity can be obtained by methods other than increasing signal size (i.e., by using higher intensity sources in 8-in signals).
| Signal Size | Signal Color | ||
|---|---|---|---|
| Red | Green | Yellow | |
| 8 in (200 mm) | 200 | 265 | 600 |
| 12 in (300 mm) | 895 | 1,190 | 2,685 |
The specification of standard values for peak intensity is important because the distribution of light intensity falls off with increasing horizontal and vertical eccentricity in the viewing angle. Janoff (1990) summarized the peak intensity standards of TEH, Commission Internationale de l'Éclairage (CIE), the British Standards Organization, and standards organizations of Australia, Japan, and South Africa. The U.S. (TEH) standard provides different recommendations for each of the three colors for each signal size. The recommendations are as follows: for red, 157 cd for 8-in signals and 399 cd for 12-in signals; for green, 314 cd for 8-in signals and 798 cd for 12-in signals; and for yellow, 726 cd for 8-in signals and 1,848 cd for 12-in signals. Australia recommends the same peak intensity for red and green (200 cd for 8-in signals and 600 cd for 12-in signals), and a yellow intensity equal to three times the red intensity. The CIE recommends the same peak intensity for all three colors (200 cd for 8-in signals and 600 cd for 12-in signals), but acknowledges that actual intensity differences between colors result due to the differential transmittance of the colored lenses (1:1.3 for red to green and 1:3 for red to yellow). Japan recommends 240 cd for all three colors. Great Britain recommends a peak intensity of 475 cd for 8-in red and green signals, and 800 cd for 12-in red and green signals. The range for red signals among all of these standards is from 157 cd (TEH) to 475 cd (British Standards Organization). The 157 cd is from research by Cole and Brown. The modal value of 200 cd, specified by Australia, South Africa, and the CIE, is based upon a depreciation factor of 33 percent.
Only two research reports provide intensity requirements for green and/or yellow signals based upon empirical data. Adrian (1963) used a subjective scale and threshold detection criteria in a study that tested red and green signals at different background luminances. He concluded that the intensity requirements for green were 1.0 and 1.2 times that of red for the subjective and threshold studies, respectively. Jainski and Schmidt-Clausen (1967) tested the ability of observers to detect the presence of a red, amber, or green spot, which was either 2 minutes or 1 degree, against varying background luminances. Their results found that green required 1.0 and 2.5 times that of red, and yellow required 2.5 and 3.0 times that of red, for 1 degree and 2 minutes, respectively. Using these results, most standards set requirements for green and yellow to be 1.3 and 3.0 times that of red, respectively. The CIE standard discusses the fact that the ratios of 1.3 and 3.0 for green and yellow appear to reflect the differences in the transmissivity of the varying color lenses.
Information on signal intensity requirements that will accommodate road users with age-related vision deficiencies is provided by NCHRP Project 5-15, Visibility Performance Requirements for Vehicular Traffic Signals. This investigation includes a series of laboratory and field studies to determine performance-based signal requirements for traffic signal intensity, intensity distribution, and related photometric parameters using a subject population that oversamples aging drivers (Freedman, Flicker, Janoff, Schwab, and Staplin, 1997). What NCHRP 5-15 makes clear is that the 200 cd intensity requirement for red 200 mm (8-in) signals that appears most prominently in the literature cited above (e.g., Janoff, 1990) is the maintained, in-service performance level for signals in visually simple to moderately complex environments. For more highly complex visual environments, the intensity recommendation for the red signal is approximately doubled. The NCHRP 5-15 recommendation for maintained intensity levels also establishes a need for in-service intensity performance measurement.
Holowachuk, Leung, and Lakowski (1993) conducted a laboratory study to evaluate the effects of color vision deficiencies and age-related diminished visual capability on the visibility of traffic signals. Subjects ranged in age from 18 to 80 and older, and included 64 individuals with normal color vision and 51 subjects who were color-vision deficient. A laboratory simulation apparatus was used to present photographs taken of seven signal head assemblies at intersections at distances of 164 and 328 ft. The photographs were taken at intersections in the Vancouver area within simple and complex environments. Each subject viewed 48 photographs shot during daylight conditions and 38 photographs shot at nighttime. Subjects' reaction times to recognize the color of the "on" signal were measured, as was the accuracy of response. The basic highway signal head used by the Ministry of Transportation and Highways in British Columbia consists of a 12-in red light, a 8-in amber light, and a 8-in green light arranged vertically with a yellow backplate. This 'standard highway" signal plus six other off-the-shelf signal-head designs were used in the study (see Table 31).
| Name | Abbreviation | Lens Size (in)* | Backplate | Other Features |
|---|---|---|---|---|
| No Backplate | NO BP | Red 8, Amber 8, Green 8 | No | N/A |
| Base Line | Baseline | Red 8, Amber 8, Green 8 | Yes | N/A |
| Modified Backplate | Mod BP | Red 8, Amber 8, Green 8 | Yes | Backplate with 2-in reflective border |
| Standard Highway | Std Hwy | Red 12, Amber 8, Green 8 | Yes | N/A |
| 12-in LED | LED | Red 12 (LED), Amber 8, Green 8 | Yes | 12-in red LED signal |
| 12-in Red, Green, Amber | 12 RYG | Red 12, Amber 12, Green 12 | Yes | N/A |
| 12-in Shape Coded | Shape Coded | Red 12, Amber 12, Green 12 | Yes | Red Square Amber Diamond Red Circle |
*Note: 12-in lens uses 150-Watt bulb; 8-in lens uses 69-Watt bulb.
Results indicated that color-vision-deficient drivers had significantly longer reaction times than drivers with normal color vision, and aging drivers had longer reaction times compared to younger drivers. Of particular importance is that the reaction times of the normal color vision drivers over age 50 (n=15) compared closely to those of color-vision-deficient drivers (n=50). Regarding signal design, for daytime conditions, the no backplate assembly produced the longest reaction times for both the normal color vision and the color-vision deficient drivers. Reaction times for the larger and brighter lenses (shape coded and 12 RYG) were the shortest, for both groups of subjects. For nighttime conditions, the signal assemblies showed few differences in reaction time for subjects with normal color vision. Reaction times were shortest for the shape coded and 12 RYG assemblies; however the baseline assembly and the No Backplate assemblies produced the longest reaction times. For the color-vision-deficient group, the reaction times for the shape-coded, 12 RYG, and the Modified Backplate assemblies were distinctly shorter than those for the Baseline and No Backplate assemblies. Nighttime reaction times were much longer than daytime reaction times for the subjects with color vision deficiencies. Signal light colors were identified more incorrectly for night conditions than for day conditions. This difference was greatest for the aging color-vision-deficient drivers (n=22).
Overall, findings indicated that the reaction times for all subjects were the shortest for signal designs with larger 12-in lenses and higher luminances (150-W bulbs). There was no significant difference in reaction times between the shape-coded and the 300 RYG, for the normal subjects or for the color-vision deficient subjects. The next-best performing signal design was the Modified Backplate. The signal assembly with no backplate produced the longest reaction times. Based on these findings, a before and after safety evaluation was conducted with the larger signal head, consisting of a 12-in red light, a 12-in amber light, and a 12-in green light, all with 150-W lamps and a yellow backboard with an additional 2-in reflective border (Sayed, Abdelwahab, and Nepomuceno, 1998). The signal head design was tested at 10 urban intersections in British Columbia, that were originally equipped with the standard signal head design consisting of a 12-in 150-W red light, an 8-in 69-W amber light, and an 8-in 69-W green light, with a yellow backboard. Crash frequency and severity were analyzed at the treatment sites 1 year before the treatment and 2 years after the treatment. Another 10 sites similar to the treatment sites were selected as comparison sites, to adjust for time trend effect. An empirical Bayes before and after safety analysis indicated that the improved signal head design had a significant effect in reducing the overall frequency and severity of crashes at the treatment sites. Crashes were reduced by approximately 24 percent, and injury and fatal crashes were reduced by approximately 16 percent. These results indicated that increasing traffic signal visibility through the improvement of signal head design is an effective countermeasure in reducing both the frequency and severity of traffic crashes at signalized intersections.
Some research has indicated that the dimming of signals at night may have advantages, while also reducing power consumption. Freedman, Davit, Staplin, and Breton (1985) conducted a laboratory study and controlled and observational field studies to determine the operational, safety, and economic impact of dimming traffic signals at night. Results indicated that drivers behaved safely and efficiently when signals were dimmed to as low as 30 percent of TEH recommendations. Previously, however, Lunenfeld (1977) cited the considerable range of night background luminances that may occur in concluding that in some brightly lit urban conditions, or where there is considerable visual noise, daytime signal brightness is needed to maintain an acceptable contrast ratio. The TEH standard does not differentiate between day and night intensity requirements. The CIE has recommended that intensities greater than 200 cd or less than 25 cd be avoided at night and advises a range of 50 to 100 cd for night, except for high-speed roads where the daytime values are preferred. While the option for dimming on a location-by-location basis should not be excluded, from the standpoint of aging driver needs, there is no compelling reason to recommend widespread reduction of traffic signal intensity during nighttime operations.
It is common practice to try to enhance the visibility of signals by placing a large, black backplate around the signals. The backplate, rather than the sky, becomes the background of the signals, enhancing the contrast. Regarding backplate size, no recommendation is contained in the TEH standard. The CIE (1988), however, recommends that all signals use backplates of a size (width) of three times the diameter of the signal.
Researchers have postulated further safety gains by adding a 1-inch to 3-inch yellow retroreflective strip around the perimeter to "frame" the backplate. In theory, by drawing drivers' attention to the backplate, their attention to the signal will be similarly enhanced. In other words, this represents an attempt to heighten signal conspicuity, while the backplate itself improves signal visibility. Sayed, de Leur, and Pump (2005) conducted a before-after study of crash experience at 17 signalized intersections in British Columbia, Canada, using auto insurance claims data. An empirical Bayes analysis, which included a comparison group to control for trend effects and a reference group to adjust for regression to the mean, indicated a nearly 15% drop in the number of crash claims following introduction of the enhanced-conspicuity backplates. The types of collisions (either before or after the backplate treatment was introduced) were not revealed in this report (i.e. it is unknown whether rear end crashes or more injurious angle crashes figured more prominently in these data). In addition, there is no discussion of driver age in the study results. Thus, while this practice has gained adherents in a number of jurisdictions, reliable evidence of its benefit for aging road users is still pending. However, FHWA has named backplates with retroreflective borders as a Proven Safety Countermeasure to reduce red-light-running crashes for all drivers (Office of Safety, 2012). Retroreflective backplate borders are included as an option in the 2009 MUTCD and have been implemented statewide in Ohio and Nebraska.
As a practical matter, the use of a backplate also serves to compensate, in part, for the effects of depreciation, since a backplate reduces the required intensity by roughly 25 percent (Cole and Brown, 1966) while depreciation increases the requirement by the same amount. Guidelines published by the CIE (1988) include an allowance of 25-percent transmissivity for depreciation due to dirt and aging (a 33-percent increase in intensity for new installations). The 200-cd requirement for red signals, as noted earlier, must be met after the depreciation factor has been taken into account.
Regarding signal size, section 4D.07 of the MUTCD specifies that the two nominal diameter sizes for vehicular signal lenses are 8 in and 12 in, and requires that 12-in lenses be used at all new signal locations with only a few exceptions. Existing 8-inch circular signal indications may be retained for the remainder of their useful service life. Researchers at the Texas Transportation Institute proposed that the larger 12-in lens should be used to improve the attention-getting value of signals for aging drivers (Greene, et al., 1996). Use of the large lens also provides motorists with more time to determine the signal color and to make the correct response.
A final issue with respect to signal performance and aging drivers is the change intervals between phases, and the assumptions about perception-reaction time (PRT) on which these calculations are based. At present, a value of 1.0 s is assumed to compute change intervals for traffic signals, a value which, according to Tarawneh (1991), dates back to a 1934 Massachusetts Institute of Technology study on brake-reaction time. Tarawneh examined findings published by proponents of both "parallel" and 'sequential" (serial) models of driver information processing, seeking to determine the best estimator for aging individuals of a PRT encompassing six different component processing operations: (1) latency time (onset of stimulus to beginning of eye movement toward signal); (2) eye/head movement time to fixate on the signal; (3) fixation time to get enough information to identify the stimulus; (4) recognition time (interpret signal display in terms of possible courses of action); (5) decision time to select the best response in the situation; and (6) limb movement time to accomplish the appropriate steering and brake/accelerator movements.
Tarawneh's (1991) review produced several conclusions. First, the situation of a signal change at an intersection is among the most extreme, in terms of both the information-processing demand and subjective feelings of stress that will be experienced by many aging drivers. Second, the most reasonable interpretation of research to date indicates that the best "mental model" to describe and predict how drivers respond in this context includes a mix of concurrent and serial-and-contingent information-processing operations. In this approach, the most valid PRT estimator will fall between the bounds of values derived from the competing models thus far, also taking into account age-related response slowing for recognition, decision-making, and limb movement. After a tabular summary of the specific component values upon which he based his calculations, Tarawneh (1991) called for an increase in the current PRT value used to calculate the length of the yellow interval (derived from tests of much younger subjects) from 1.0 s to 1.5 s to accommodate aging drivers.
A contrasting set of results was obtained in a FHWA-sponsored study of traffic operations control for older drivers (Knoblauch, et al., 1995). This study compared the decision/response times and deceleration characteristics of older drivers (ages 60–71 and older) with those of younger drivers (younger than age 60) at the onset of the amber signal phase. Testing was conducted using a controlled field test facility, where subjects drove their own vehicles. Subjects were asked to maintain speeds of 30 mph and 20 mph for certain test circuits. The duration of the yellow signal was 3.0 s before turning to red. On half of the trials, the signal changed from green to yellow when the subject was 3.0 to 3.9 s from the signal, and on the remaining trials, when the subject was 4.0 to 4.9 s away from the signal. For three of the circuits, subjects were asked to brake as they normally would and to stop before reaching the intersection, if they chose to do so. During a fourth circuit, they were asked to brake to a stop, if they possibly could, if the light changed from green to yellow. Response times were measured for the drivers who stopped, from the onset of the yellow phase to the time the brake was applied.
Results of the Knoblauch et al. (1995) study showed no significant differences in 85th percentile decision/response times between younger and older drivers when subjects were close to the signal at either approach speed. The 85th percentile decision time of younger subjects was 0.39 s at 20 mph and 0.45 s at 30 mph. For older drivers, these times were 0.51 and 0.53 s, for 20 mph and 30 mph, respectively. When subjects were further from the signal at amber onset, older drivers had significantly longer decision/response times (1.38 s at 20 mph and 0.88 s at 30 mph) than the younger drivers (0.50 s at 20 mph and 0.46 s at 30 mph). The authors suggested that the significant differences between older and younger drivers occurred when the subjects were relatively far from the signal, and that some older subjects will take longer to react and respond when additional time is available for them to do so. Thus, they concluded that the older drivers were not necessarily reacting inappropriately to the signal. In terms of deceleration rates, there were no significant differences, either in the mean or 15th percentile values, between the older and younger subjects. Together, these findings led the authors to conclude that no changes in amber signal phase timing are required to accommodate aging drivers.
Taking the review and study findings of Tarawneh (1991) and Knoblauch et al. (1995) into consideration, an approach that retains the 1.0-s PRT value as a minimum for calculating the yellow change interval seems appropriate; but, to acknowledge the significant body of work documenting age-related increases in PRT, the use of a 1.5-s PRT is well justified when engineering judgment determines a special need to take aging drivers' diminished capabilities into account. A treatment for an all-red clearance interval logically follows, with length determined according to the TEH (1992).
One of the main purposes of lighting a roadway at night is to increase the visibility of the roadway and its immediate environment, thereby permitting the driver to maneuver more safely and efficiently. The visibility of an object is that property which makes it discernible from its surroundings. This property depends on a combination of factors; principally, these factors include the differences in luminance, hue, and saturation between the object and its immediate background (contrast); the angular size of the object at the eye of the observer; the luminance of the background against which it is seen; and the duration of observation.
Of all the highway safety improvement projects evaluated by FHWA (1996), using data from 1974 to 1995 where before- and after-exposure data were available, intersection illumination was associated with the highest benefit-cost ratio (26.8) in reducing fatal and injury crashes. The link between reduced visibility and highway safety is conceptually straightforward. Low luminance contributes to a reduction in visual capabilities such as acuity, distance judgment, speed of seeing, color discrimination, and glare tolerance, which are already diminished capabilities in aging drivers.
| Applications in Standard Reference Manuals | |||
|---|---|---|---|
| MUTCD (2009) | AASHTO Green Book (2011) | NCHRP 500 – Volume 9 (2004) | Roadway Lighting Handbook (1978) |
| Sect. 1A.13, sign illumination Sects. 2A.07, 2D. 03, 2E.06, & 3I.04 Sect. 4B.04 Sects. 6D.01 & 6D.03 Sect. 6F.81 and 6F. 82 Sect. 6G.14 and 6G. 19 Table 6H-2 Figs. 6H-12, 6H-40, 6H-41 Sects. 8A.06 |
Pgs. 3-172 through 3-173, Sect. 3.6.3 Lighting Pg. 3-176, Para. 3 Pgs. 5-22, Sect. 5.3.8 Street and Roadway Lighting Pg. 6-19, Sect. 6.3.8 on Roadway Lighting Pg. 7-52, Sect. 7.3.17 Lighting Pg. 9-181, Sect. 9.11.5 Lighting at Intersections |
Pgs. V-21-V-22, Sect. on Strategy 3.1 B7:Improve Lighting at Intersections, Horizontal Curves, and Railroad Grade Crossings (T) | Pgs. 16-27, Sects. on Analytical Approach to Illumination Warrants, Informational Needs Approach to Warrants, & Warrants for Rural Intersection Lighting Pgs. 29-30 Sect. on Adverse Geometry and Environment Warrant Pgs. 42-45, Sect. on Summary of Light Sources Pgs. 53-56, Sect. on Classification of Luminaire Light Distributions Pg. 71, 5th bullet Pg. 94, Sect. on Coordination of the Arterial Lighting System and Traffic Controls Pg. 96, Sect. on Intersection Lighting Pgs. 98-99, Sect. on Rural Intersection Lighting Pgs. 120-129, Sect. on Illumination Design Procedure Pgs.187-200, Sect. on Maintaining the System |
A recent NCHRP report shows that intersection lighting can reduce total nighttime crashes by 21 percent and nighttime injury crashes by 27 percent. On the basis of day-night crash distributions, this translates into a 4 percent reduction in total crashes at an intersection where lighting is added and a 5 percent reduction in all injury crashes. (Harkey et al., 2008) These results are based on a meta-analysis of 38 studies, including 14 conducted in the U.S. (Elvik and Vaa, 2004) and review by an expert panel as part of the referenced NCHRP study.
The Commission Internationale de l'Éclairage (1990) reports that road crashes at night are disproportionately higher in number and severity compared with crashes during the daytime. Data from 13 Organization for Economic Cooperation and Development countries showed that the proportion of fatal nighttime crashes ranged between 25 and 59 percent (average value of 48.5 percent). In this evaluation of 62 lighting and crash studies, 85 percent of the results showed lighting to be beneficial, with approximately one-third of the results statistically significant.
In 1990, drivers (without regard to age) in the United States experienced 10.37 fatal involvements per 100 million mi at night and 2.25 fatal involvements per 100 million mi during the day (Massie and Campbell, 1993). In their analysis, the difference between daytime and nighttime fatal rates was found to be more pronounced among younger age groups than among older ones, with drivers ages 20–24 showing a nighttime rate that was 6.1 times the daytime rate, and drivers age 75 and older showing a nighttime rate only 1.1 times the daytime rate. The lower percentage of nighttime crashes of aging drivers may be due to a number of factors, including reduced exposure—aging drivers as a group drive less at night—and a self-regulation process whereby those who do drive at night are the most fit and capable to perform all functional requirements of the driving task (National Highway Traffic Safety Administration, 1987).
A specific driving error with high potential for crash involvement is wrong-way movements. Analyses of wrong-way movements at intersections frequently associate these driving errors with low visibility and restricted sight distance (Vaswani, 1974, 1977; Scifres and Loutzenheiser, 1975) and note that designs that increase the visibility of access points to divided highways and treatments that improve drivers' understanding of proper movements at these locations have been found to reduce the potential for crashes.
Inadequate night visibility, where the vehicle's headlights are the driver's primary light source, was reported by Vaswani (1977) as a factor that makes it more difficult for drivers to determine the correct routing at intersections with divided highways. Similarly, Woods, Rowan, and Johnson (1970) reported that locations where highway structures, land use, natural growth, or poor lighting conditions reduce the principal sources of information concerning the geometry and pavement markings are associated with higher occurrences of wrong-way maneuvers. Crowley and Seguin (1986) reported that drivers over the age of 60 are excessively involved in wrong-way movements on a per-mile basis. Suggested countermeasures include increased use of fixed lighting installations. Lighting provides a particular benefit to aging drivers by increasing expectancy of needed vehicle control actions, at longer preview distances. It has been documented extensively in this Handbook that an aging driver's ability to safely execute a planned action is not significantly worse than that of a younger driver. The importance of fixed lighting at intersections for aging drivers can therefore be understood in terms of both the diminished visual capabilities of this group and their special needs to prepare farther in advance for unusual or unexpected aspects of intersection operations or geometry. Targets that are especially critical in this regard include shifting lane alignments; changing lane assignments (e.g., when a through lane changes to turn-only operation); a pavement width transition, particularly a reduction across the intersection; and, of course, pedestrians.
Detectability of a pedestrian is generally influenced by contrast, motion, color, and size (Robertson, Berger, and Pain, 1977). If a pedestrian is walking at night and does not have good contrast, color contrast, or size relative to other road objects, an increase in contrast will significantly improve his/her detectability. This is one effect of street lighting. Extreme contrasts as well as dark spots are reduced, giving the driver and the pedestrian a more "even" visual field. The effectiveness of fixed lighting in improving the detectability of pedestrians has been reported by Pegrum (1972); Freedman, et al. (1975); Polus and Katz (1978); and Zegeer (1991).
While age-related changes in glare susceptibility and contrast threshold are currently accounted for in lighting design criteria, there are other visual effects of aging that are currently excluded from visibility criteria. Solid documentation exists of age-related declines in ocular transmittance (the total amount of light reaching the retina), particularly for the shorter wavelengths (cf. Ruddock, 1965); this suggests a potential benefit to aging drivers of the "yellow tint" of high-pressure sodium highway lighting installations. The aging eye experiences exaggerated intraocular scatter of light—all light, independent of wavelength (Wooten and Geri, 1987)—making these drivers more susceptible to glare. Diminished capability for visual accommodation makes it harder for aging observers to focus on objects at different distances. Pupil size is reduced among aging individuals through senile miosis (Owsley, 1987), which is most detrimental at night because the reduction in light entering the eye compounds the problem of light lost via the ocular media, as described above.
The loss of static and dynamic acuity—the ability to detect fine detail in stationary and moving targets—with advancing age is widely understood. Although there are pronounced individual differences in the amount of age-related reduction in static visual acuity, Owsley (1987) indicated that a loss of about 70 percent in this capability by age 85 is normal. Among other things, declines in acuity can be used to predict the distance at which text of varying size can be read on highway signs (Kline and Fuchs, 1993), under a given set of viewing conditions.
There are a number of other aspects of vision and visual attention that relate to driving. In particular, saccadic fixation, useful field of view, detection of motion in depth, and detection of angular movement have been shown to be correlated with driving performance (see Bailey and Sheedy, 1988, for a review). As a group, however, these visual functions do not appear to have strong implications for highway lighting practice, with the possible exception of the "useful field of view." It could be argued that it would be advantageous to provide wider angle lighting coverage to increase the total field of view of aging drivers. High-mast lighting systems can increase the field of view from 30 degrees to about 105 degrees (Hans, 1993). Such wide angles of coverage might have advantages for aging drivers in terms of peripheral object detection. However, because high-mast lighting systems tend to sacrifice target contrast for increased field of view, opinion is divided about their application at intersections. Traditionally, field of view has not been considered as a parameter that needs to be optimized in lighting system design for intersection applications.
Rockwell, Hungerford, and Balasubramanian (1976) studied the performance of drivers approaching four intersection treatments, differentiated in terms of special reflectorized delineators and signs versus illumination. A significant finding from observing 168 test approaches was that the use of roadway lighting significantly improved driving performance and earlier detection of the intersection, compared with the other treatments (e.g., signing, delineation, and new pavement markings), which showed smaller improvements in performance.
Finally, it must be emphasized that the effectiveness of intersection lighting depends upon a continuing program of monitoring and maintenance by the local authority. Guidelines published by AASHTO (1984) identify depreciation due to dirt on the luminaires and reduced lumen output from the in-service aging of lamps as factors that combine to decrease lighting system performance below design values. Maintained values in the range of 60 to 80 percent of initial design values are cited as common practice in this publication. With a particular focus on the needs of aging drivers for increased illumination relative to younger motorists, to accommodate the age-related sensory deficits documented earlier in this discussion, a recommendation logically follows that lighting systems be maintained to provide service at the 80 percent level—i.e., the upper end of the practical range—with respect to their initial design values.
A nationwide review of fatalities during the year 1985, and injuries during the period of 1983–1985, showed that 39 percent of all pedestrian fatalities and 9 percent of all pedestrian injuries involved persons age 64 and older (Hauer, 1988). While the number of injuries is close to the population distribution (approximately 12 percent), the number of fatalities far exceeds the proportion of aging pedestrians. The percentages of pedestrian fatalities and injuries occurring at intersections were 33 percent and 51 percent, respectively (Hauer, 1988). People age 70 and older have the highest pedestrian death rate – 2.7 per 100,000 people vs. 1.5 per 100,000 people for those younger than 70 (IIHS, 2007). Crash types that predominantly involve aging pedestrians at intersections are as follows (Blomberg and Edwards, 1990):
| Applications in Standard Reference Manuals | ||||
|---|---|---|---|---|
| MUTCD (2009) | AASHTO Green Book (2011) | Roadway Lighting Handbook (1978) | NCHRP 279 Intersection Channelization Design Guide (1985) | Traffic Engineering Handbook (2009) |
| Sect. 1A.13, crosswalk, crosswalk lines, & pedestrian Tables 2A-1 & 2C-2 through 2C-3 Sects. 1A.15, 2B.51 through 2B.54, 2C.50, 3B.15 & 3B.18 Figs. 3B-17, 3B-19, 3B-20, Sect. 3B.20 Sect. 3G.01 Sect. 4A.02 Sects. 4C.05 & 4D.03 Sect. 4D.07 through 4D.11 Sects. 4E.01 through 4E.13 Fig. 4E-1 Sect. 7A.03 Fig. 7A-1 Table 7B-1 Sects. 7B.11 & 7B.12 Fig. 7B-1 Sects. 7C.02, 7D.01 through 7D.05 |
Pgs. 2-78 through 2-81, Sect. 2.6 The Pedestrian Pg. 4-49, Para. 2 Pg. 5-15, Sect. on Bicycle/ Pedestrian Facilities Pg. 6-16, Sect. on Bicycle/ Pedestrian Facilities Pgs. 7-41 through 7-42, Sect. 7.3.9 Bicycle and Pedestrian Facilities Pgs. 9-83 through 9-92, Sects. on Effect of Curb Radii on Turning Paths and Effect of Curb Radii on Pedestrians Pg. 9-98, Sect. on Refuge Islands Pg. 9-181, Sect. 9.11.4 Pedestrians |
Pg. 2, 2nd col., Para. 1 Pg. 9, Sect. on Contrast Pg. 18, Form 2 Pgs. 21-22, Tables 1-2 Pgs. 27-30, Sect. on Warrants for Application of Specialized Crosswalk Illumination Pg. 45, Para. 3 Pg. 71, 3rd bullet Pgs. 94-9, Sects. on Coordination of the Arterial Lighting System and Traffic Controls & Pedestrian Lighting on Arterials |
Pg. 1, Item 3, 2nd bullet Pg. 6, Table 2-2 Pg. 9, Fig. 2-4 Pg. 11, Bottom left photo Pg. 21, Item 9 & Fig. 3-1 Pg. 27, Bottom left fig. Pg. 33, Bottom right fig. Pg. 38, Para. 1 & top two figs. Pg. 39, Entire pg. Pg. 40, Fig. 4-1 Pg. 42, 2nd col., item 3 Pg. 61, 2nd col, Paras. 2-3 & item 2 Pg. 66, Paras. 1 & 4 & item 4 Pg. 67, 2nd col, Paras. 1-2 Pg. 68, Fig. 4-26 Pg. 69, 2nd col., Para. 4 Pgs. 70-72, Figs. 4-27 & 4-28 Pg. 75, Paras. 4-5, Table 4-10, & 2nd col, Para. 1 Pg. 76, Item 4 & Table 4-11 Pgs. 96-97, Intersct. No. 4 Pgs. 104-105, Intersct. No. 9 Pgs. 150-151, Intersct. No. 36 |
Pgs. 18-23, Sect. on Pedestrians Pg. 29, Para. 5 Pgs. 252-254, Sect. on Pedestrian Facilities Pg. 404, Para. 1 Pgs. 369-370, Sect. on Crossing Warning Signs Pg. 153, Sect. on Non-Motorist Safety Pgs. 381-382, Sect. on Crosswalks Pgs. 421-422, Sect. on Pedestrian Signal Heads Pg. 450, Sect. on Pedestrian Countdown Signals |
Earlier analyses of over 5,300 pedestrian crashes occurring at urban intersections indicated that a significantly greater proportion of pedestrians age 65 and older were hit at signalized intersections than any other group (Robertson, Berger, and Pain, 1977).
Age-related diminished capabilities, which may make it more difficult for aging pedestrians to negotiate intersections, include decreased contrast sensitivity and visual acuity, reduced peripheral vision and "useful field of view," decreased ability to judge safe gaps, slowed walking speed, and physical limitations resulting from arthritis and other health problems. Aging pedestrian problem behaviors include a greater likelihood to delay before crossing, to spend more time at the curb, to take longer to cross the road, and to make more head movements before and during crossing (Wilson and Grayson, 1980).
Older and Grayson (1972) reported that although aging pedestrians involved in crashes looked more often than the middle-aged group studied, over 70 percent of the adults struck by a vehicle reported not seeing it before impact. Job, et al. (1992) found that pedestrians over age 65 looked less often during their crossings than did younger pedestrians. In a survey of aging pedestrians (average age of 75) involved in crashes, 63 percent reported that they failed to see the vehicle that hit them, or to see it in time to take evasive action (Sheppard and Pattinson, 1986). Knoblauch, et al. (1995) noted that difficulty seeing a vehicle against a (complex) street background may occur with vehicles of certain colors, causing them to blend in with their background. This is especially problematic for aging persons with reduced contrast sensitivity, who require a higher contrast for detection of the same targets than younger individuals, and who also have greater difficulty dividing attention between multiple sources and selectively attending to the most relevant targets. In addition, the loss of peripheral vision increases an aging pedestrian's chances of not detecting approaching and turning vehicles from the side.
Reductions in visual acuity make it more difficult for aging pedestrians to read the crossing signal. In a survey of aging pedestrians in the Orlando, Florida area, 25 percent of the participants reported difficulty seeing the crosswalk signal from the opposite side of the street (Bailey, et al., 1992). Aging pedestrians wait for longer gaps between vehicles before attempting to cross the road. In one study, approximately 85 percent of the pedestrians age 60 and older required a minimum gap of 9 s before crossing the road, while only 63 percent of all pedestrians required this minimum gap size duration (Tobey, Shungman, and Knoblauch, 1983). The decline in depth perception may contribute to aging persons' reduced ability to judge gaps in oncoming traffic. It may be concluded from these studies that aging pedestrians do not process information (presence, speed, and distance of other vehicles) as efficiently as younger pedestrians, and therefore require more time to reach a decision. Other researchers have observed that aging pedestrians do not plan their traffic behavior, are too trusting about traffic rules, fail to check for oncoming traffic before crossing at intersections, underestimate the speed of approaching vehicles, and follow other pedestrians without first checking for conflicts before crossing (Jonah and Engel, 1983; Mathey, 1983).
With increasing age, there is a concurrent loss of physical strength, joint flexibility, agility, balance, coordination and motor skills, and stamina. These losses contribute to slower walking speeds and difficulty negotiating curbs. In addition, aging persons often fall as a result of undetected surface irregularities in the pavement and misestimation of curb heights. This results from a decline in contrast sensitivity and depth perception. In an assessment of 81 aging residents (ages 70–97) to examine susceptibility to falling, 58 percent experienced a fall in the year following clinical assessment (Clark, Lord, and Webster, 1993). Impaired cognition, abnormal reaction to any push or pressure, history of palpitations, and abnormal stepping were each associated with falling. Knoblauch, et al. (1995) reported that locating the curb accurately and placing the foot is a matter of some care, particularly for the elderly, the very young, and those with physical disabilities.
The studies discussed below define the types of crashes in which aging pedestrians are most likely to be involved, and under what conditions the crashes most frequently occur. In addition, the specific geometric characteristics, traffic control devices (including signs, signals, and markings), and pedestrian signals that seem to contribute to aging pedestrians' difficulties at intersections are discussed. Zegeer and Zegeer (1988) stressed the importance of "tailoring" the most appropriate traffic control measures to suit the conditions at a given site. The effect of any traffic control measure is highly dependent on specific locational characteristics, such as traffic conditions (e.g., volumes, speeds, turning movements), pedestrian volumes and pedestrian mix (e.g., young children, college students, aging adults, persons with physical disabilities), street width, existing traffic controls, area type (e.g., rural, urban, suburban), site distance, crash patterns, presence of enforcement, and numerous other factors.
Harrell (1990) used distance stood from the curb as a measure of pedestrian risk for intersection crossing. Observations of 696 pedestrians divided among three age groups (age 30 and under, ages 31–50, and age 51 and older) showed that the oldest group stood the farthest from the curb, that they stood even farther back under nighttime conditions, and that aging females stood the farthest distance from the curb. The author used these data to dispel the findings in the literature that aging pedestrians are not cognizant of the risks of exposure to injury from passing vehicles. Similarly, it may be argued that this behavior keeps them from detecting potential conflict vehicles and makes speed and distance judgments more difficult for them, while limiting their conspicuity to approaching drivers who might otherwise slow down if pedestrians were detected standing at the curbside at a crosswalk.
A study of pedestrian crashes conducted at 31 high-pedestrian crash sections in Maryland between 1974 and 1976 showed that pedestrians age 60 and older were involved in 53 (9.6 percent) of the crashes, and children younger than age 12 showed the same proportions. The pedestrians age 60 and older accounted for 25.6 percent of the fatal crashes. Compliance with traffic control devices was found to be poor for all pedestrians at all study locations; it was also found that most pedestrians keyed on the moving vehicle rather than on the traffic and pedestrian control devices. Only when the traffic volumes were so high that it was impossible to cross did pedestrians rely on traffic control devices (Bush, 1986).
Garber and Srinivasan (1991) conducted a study of 2,550 crashes involving pedestrians that occurred in the rural and urban areas of Virginia to identify intersection geometric characteristics and intersection traffic control devices that were predominant in crashes involving aging pedestrians. Crash frequency by location and age for the crashes within the cities showed that while the highest percentage of crashes involving pedestrians age 59 and younger occurred within 150 ft from the intersection stop line, the highest percentage of crashes for pedestrians age 60 years and older (51.8 percent) occurred within the intersection.
Knoblauch, et al. (1995) reported that, compared with younger pedestrians, aging adults are overinvolved in crashes while crossing streets at intersections. In their earlier analysis of the national Fatal Analysis Reporting System (FARS) data for the period 1980–1989, 32.2 and 35.3 percent of the deaths for pedestrian ages 65–74 and age 75 and older, respectively, occurred at intersections (Reinfurt, et al., 1992). This compared with 22 percent or less for the younger age groups. Analysis of the North Carolina motor vehicle crash file for 1980–1990 displayed somewhat smaller percentages, but showed the trend of increasing pedestrian crashes at intersections as age increased. Further analysis of the North Carolina database showed that pedestrians age 65 and older as well as those ages 45–64 experienced 37 percent of their crashes on roadways with four or more lanes. This compares with 23.7 percent for pedestrians ages 10–44 and 13.6 percent for those age 9 and younger. The highest number of pedestrian-vehicle crashes occurred when the vehicle was going straight (59.7 percent), followed by a vehicle turning left (17.2 percent), and a vehicle turning right (13.3 percent). Right-turn crashes accounted for 18.9 percent of crashes with pedestrians ages 65–74, compared with 14.2 percent for pedestrians age 75 and older. The oldest pedestrian group was the most likely to be struck by a left-turning vehicle; they accounted for 23.9 percent of the crashes, compared with 18.1 percent of those ages 65–74 and 15.8 percent of those ages 45–64.
Knoblauch, et al. (1995) conducted a study to determine if pedestrian comprehension of and compliance with pedestrian signals could be improved by installing a placard that explained the three phases of pedestrian signals. They used findings from: (1) a focus group and workshop conducted in Baltimore, Maryland, with 13 participants ages 19–62 and (2) questionnaires administered to 225 individuals ages 19–80 and older at four Virginia Department of Motor Vehicles offices to determine the most effective message content and format for a pedestrian signal education placard. The newly developed placard was installed at six intersections in Virginia, Maryland, and New York. Observational studies of more than 4,300 pedestrians during 600 signal cycles found no change in pedestrian signal compliance. However, results from questionnaires administered to 92 subjects at Departments of Motor Vehicles in Virginia, Maryland, and New York indicated a significant increase in understanding of the phases of the pedestrian signal. The authors concluded that although pedestrian crossing behavior is more influenced by the presence or absence of traffic than the signal indication, the wording on the placard was based on quantitative procedures using a relatively large number of subjects and should be used where signal educational placards are installed. The wording of the educational placard recommended by Knoblauch, et al. (1995) for one-stage and two-stage crossings is shown in Figure 80. The MUTCD has adopted similar wording, which is shown as part of Recommendation C of Design Element 16.
Figure 80. Recommended Wording For Educational Placards For One-Stage And Two-Stage Crossings (Knoblauch et al., 1995)
Zegeer and Cynecki (1986) tested a LOOK FOR TURNING VEHICLES pavement marking in a crosswalk, as a low-cost countermeasure to remind pedestrians to be alert for turning vehicles, including right-turn-on-red (RTOR) vehicles. Results showed an overall reduction in conflicts and interactions for RTOR vehicles and also for the total number of turning vehicles. Even with an RTOR prohibition, approximately 20 percent of motorists committed an RTOR violation when given the opportunity (Zegeer and Cynecki, 1986). Of those violations, about 23.4 percent resulted in conflicts with pedestrians or vehicles on the side street.
Zegeer, Opiela, and Cynecki (1982) conducted a crash analysis to determine whether pedestrian crashes are significantly affected by the presence of pedestrian signals and by different signal timing strategies. They found no significant differences in pedestrian crashes between intersections that had standard-timed (concurrent walk) pedestrian signals compared with intersections that had no pedestrian signals. Concurrent or standard timing provides for pedestrians to walk concurrently (parallel) with traffic flow on the WALK signal. Vehicles are generally permitted to turn right (or left) on a green light while pedestrians are crossing on the WALK interval. Other timing strategies include early release timing, late release timing, and exclusive timing. In early release timing—also termed a "leading pedestrian interval"—the pedestrian WALK indication is given before the parallel traffic is given a green light, allowing pedestrians to get a head start into the crosswalk before vehicles are permitted to turn. In late release timing, the pedestrians are held until a portion of the parallel traffic has turned. Exclusive timing is a countermeasure where traffic signals are used to stop motor vehicle traffic in all directions simultaneously for a phase each cycle, while pedestrians are allowed to cross the street. "Barnes Dance" or 'scramble" timing is a type of exclusive timing where pedestrians may also cross diagonally in addition to crossing the street. Exclusive timing is intended to virtually eliminate turning traffic or other movements that conflict with pedestrians while they cross the street. In the Zegeer et al. (1982) analysis, exclusive-timed locations were associated with a 50 percent decrease in pedestrian crashes for intersections with moderate to high pedestrian volumes when compared with both standard-timed intersections and intersections that had no pedestrian signals. However, this timing strategy causes excessive delays to both motorists and pedestrians. Aging road users (age 65 and older) recommended the following pedestrian-related countermeasures for pedestrian signs and signals, during focus group sessions held as a part of the research conducted by Knoblauch, et al. (1995): (1) reevaluate the length of pedestrian walk signals due to increasingly wider highways, (2) implement more Barnes Dance signals at major intersections, and (3) provide more YIELD TO PEDESTRIANS signs in the vicinity of heavy pedestrian traffic.
Several studies have been conducted to determine whether regulatory signing aimed at turning motorists could reduce conflicts with pedestrians. Zegeer, Opiela, and Cynecki (1983) found that the regulatory sign YIELD TO PEDESTRIANS WHEN TURNING was effective in reducing conflicts between turning vehicles and pedestrians. They recommended that this sign be added to the MUTCD as an option for use at locations with a high number of pedestrian crashes involving turning vehicles. Zegeer and Cynecki (1986) found that the standard NO TURN ON RED sign with the supplementary WHEN PEDESTRIANS ARE PRESENT message was effective at several sites with low to moderate right-turn vehicle volumes. However, it was less effective when RTOR volumes were high. It was therefore recommended that the supplemental message WHEN PEDESTRIANS ARE PRESENT be added to the MUTCD as an accepted message that may be used with an NTOR sign when right-turn volume is light to moderate and pedestrian volumes are light or occur primarily during intermittent periods, such as in school zones. The supplemental message when added to the NTOR sign with the circular red symbol reduced total pedestrian conflicts at one site and increased RTOR usage (as desired, from 5.7 percent to 17.4 percent), compared with full-RTOR prohibitions. It was recommended that the supplemental message be added to the MUTCD for the NTOR sign with the circular red symbol, under low to moderate right-turn vehicle volumes and light or intermittent pedestrian volumes.
In the late 1990s, Abdulsattar, Tarawneh, and McCoy (1996) found that the TURNING TRAFFIC MUST YIELD TO PEDESTRIANS sign was effective in significantly reducing pedestrian-vehicle conflicts during right turns. The sign was installed at six marked crosswalks in Nebraska, where right-turn vehicle-pedestrian conflict data were collected before and after its installation in an observational field study. For the six study crosswalks combined, a conflict occurred in 51 percent of the observations in the before period, but in only 38 percent of the observations during the after period. The reductions in pedestrian-vehicle conflicts across the observation sites ranged from 15 to 30 percent, and were statistically significant.
The type of markings used to define a crosswalk can also make a difference in driver compliance. Fitzpatrick, et al (2010) investigated the relative daytime and nighttime visibility of three crosswalk marking patterns: transverse lines, continental, and bar pairs. The conclusions from their study were as follows:
The detection distances to continental and bar pairs are statistically similar. The detection distances to continental and bar pairs are statistically different from transverse markings.
For the existing midblock locations, a general observation is that the continental marking was detected at about twice the distance upstream as the transverse marking during daytime conditions. This increase in distance reflects 8 s of increased awareness of the crossing for a 30-mph operating speed.
The results of the appearance ratings of the markings on a scale of A to F mirrored the findings from the detection distance evaluation. Participants preferred the continental and bar pairs markings over the transverse markings.
Participants gave the continental and bar pairs markings similar ratings during both the day and night. However, the transverse marking ratings differed based on the light level. The participants gave slightly better ratings, although still worse than continental or bar pairs markings, for transverse markings during the nighttime as compared to the daytime. The lower ratings during daylight conditions could be due to sun glare or shadow issues mentioned by the participants.
Considering pedestrian walking times, section 4E.06 of the MUTCD (2009) indicates that a pedestrian change interval consisting of a flashing UPRAISED HAND (symbolizing DONT WALK) signal indication shall begin immediately following the WALKING PERSON (symbolizing WALK) signal indication. The pedestrian clearance time should be sufficient to allow a pedestrian crossing in the crosswalk who left the curb or shoulder at the end of the WALKING PERSON (symbolizing WALK) signal indication to travel at a walking speed of 3.5 feet per second to at least the far side of the traveled way or to a median of sufficient width for pedestrians to wait. The MUTCD further states that, "where pedestrians who walk slower than 3.5 ft per second, or pedestrians who use wheelchairs, routinely use the crosswalk, a walking speed of less than 3.5 ft per second should be considered in determining the pedestrian clearance time."
Aging pedestrian walking speed has been studied by numerous researchers. TEH (1999) reports walking speeds obtained by Perry (1992) for physically impaired pedestrians. Average walking speeds for pedestrians using a cane or crutch were 2.62 ft/s; for pedestrians using a walker, 2.07 ft/s; for pedestrians with hip arthritis, 2.24 to 3.66 ft/s; and for pedestrians with rheumatoid arthritis of the knee, 2.46 ft/s. Sleight (1972) determined that there would be safety justification for use of walking speeds between 3.0 to 3.25 ft/s, based on the results of a study by Sjostedt (1967). In this study, average adults and the elderly had walking speeds of 4.5 ft/s; however, 20 percent of the aging pedestrians crossed at speeds slower than 4.0 ft/s. The 85th percentile aging pedestrian walking speed in that study was 3.4 ft/s. A 1982 study by the Minnesota Department of Transportation found that the average walking speed of aging pedestrians was 3.0 ft/s. In a study conducted in Florida, it was found that a walking speed of 2.5 ft/s would accommodate 87 percent of the aging pedestrians observed (TEH, undated). Weiner (1968) found an average rate for all individuals of 4.22 ft/s, and of 3.7 ft/s for women only. A Swedish study by Dahlstedt (undated), using pedestrians age 70 and older, found that the 85th percentile comfortable crossing speed was 2.2 ft/s.
Interviews and assessments were conducted with 1,249 persons age 72 and older from the New Haven, CT community of Established Populations for Epidemiologic Studies of the Elderly, to determine walking speeds and self-reported difficulty with crossing the street as pedestrians (Langlois, et al., 1997). The study population excludes persons in nursing homes or hospitals. In a telephone interview, 11.4 percent indicated that they had difficulty crossing the street. Reasons provided included insufficient time to cross and difficulty with right-turning vehicles. The mean walking speed for those reporting difficulty crossing the street was 1.25 ft/s, and for those reporting no difficulty was 1.94 ft/s. Only 7.3 percent of the population had measured walking speeds 3 ft/s, and less than 1 percent had walking speeds of 4.0 ft/s.
Hoxie and Rubenstein (1994) measured the crossing times of older and younger pedestrians at a 71.69-ft wide intersection in Los Angeles, CA, and found that aging pedestrians (age 65 and older) took significantly longer than younger pedestrians to cross the street. In this study, the average walking speed of the older pedestrians was 2.8 ft/s, with a standard deviation of 0.56 ft/s); the average speed of the younger pedestrians was 4.2 ft/s, with a standard deviation of 0.56 ft/s). Of the 592 older pedestrians observed, 27 percent were unable to reach the curb before the light changed to allow cross traffic to enter the intersection, and one-fourth of this group were stranded at least a full traffic lane away from safety. A study of crossing speeds by Coffin and Morrall (1995) limited to 15 pedestrians age 60 or older, at each of six crosswalk locations in Calgary, Canada, documented an 85th percentile walking speed of 3.28 ft/s for midblock crosswalks and 4.0 ft/s for crosswalks at signalized intersections. The authors noted that the walking speed of aging pedestrians varies according to functional classification, gender, and intersection type, and stated that approximately 95 percent of pedestrians in this study would be accommodated using a design walking speed of 2.62 ft/s.
Much more extensive observations of pedestrian crossing behavior were conducted at two crosswalk locations at two intersections in Sydney, Australia (a major 6-lane divided street, and a side street), where the design crossing speed was changed from 4.0 ft/s to 3.0 ft/s (Job, et al., 1994). Observations were made during 3,242 crossings during a baseline period (4.0 ft/s design crossing speed) and 2 and 6 weeks after the flashing DONT WALK interval was extended to allow for the slower crossing speed under study. This study was conducted to evaluate countermeasures to address the over-representation of pedestrians age 70 and older in crashes in the greater Sydney metropolitan area. At all crosswalk locations, the WALK phase remained a constant 6 s, and the clearance interval was extended from 14 s to 20 s at one intersection 59.7 ft wide, and from 18 to 20 s at the other intersection measuring 79.4 ft wide. Observations were conducted for 2,377 pedestrians ages 20-59, 511 pedestrians ages 60-65, and 354 pedestrians age 66 and older. The number of males and females was approximately equal. For both intersections, a general trend showed that the older the pedestrian, the longer the crossing time. Also, females crossed more slowly than males in all age groups. At the wider intersection, mean crossing speeds were 4.9 ft/s for pedestrians ages 20-59; 4.27 ft/s for pedestrians ages 60-65, and 3.6 ft/s for pedestrians age 66 and older. The mean walking speed for females age 66 and older was 3.28 ft/s. The authors note that the assumed walking speed of 4.0 ft/s leaves almost 15 percent of the total population walking below the assumed speed. Extending the clearance interval resulted in a decrease in the percentage of pedestrian-vehicle conflicts, from 4 percent in the baseline period to 1 percent in the experimental period at 2 weeks and also 1 percent at 6 weeks, at the wider intersection. This difference was significant at the p=.001 level. Observed changes in pedestrian-vehicle conflicts at the smaller intersection were contaminated by an increase in the proportion of pedestrians (in the young and young/middle age groups only) who crossed illegally (i.e., began to cross during the flashing DONT WALK phase); consequently, sustained differences between the baseline and experimental phases were not demonstrated. At the conclusion of this research, the authors recommended a reduction in the design walking speed from 4.0 ft/s to 3.0 ft/s at locations where there is significant usage by aging pedestrians.
Knoblauch, et al. (1995) conducted a series of field studies to quantify the walking speed, start-up time, and stride length of pedestrians younger than age 65 and pedestrians 65 and older under varying environmental conditions. Analysis of the walking speeds of 3,458 pedestrians younger than age 65 and 3,665 pedestrians age 65 and older crossing at intersections showed that the mean walking speed for younger pedestrians was 4.95 ft/s and 4.11 ft/s for older pedestrians. The 15th percentile speeds were 4.09 ft/s and 3.19 ft/s for younger and older pedestrians, respectively. These differences were statistically significant. Among the many additional findings with regard to walking speed were the following:
For design purposes, a separate analysis was conducted by Knoblauch, et al. (1995) for pedestrians who complied with the signal, as they tended to walk more slowly than those who crossed illegally. The mean crossing speed for the young compliers was 4.79 ft/s and for the older compliers was 3.94 ft/s. The 15th percentile speed for the young compliers was and was 3.08 ft/s for the older compliers. Older female compliers showed the slowest walking speeds, with a mean speed of 3.74 ft/s and a 15th percentile of 2.97 ft/s. One of the slowest 15th percentile values (2.94 ft/s) was observed for older pedestrians crossing snow-covered roadways. It was concluded from this research that a mean design speed of 4.0 ft/s is appropriate, and where a 15th percentile is appropriate, a walking speed of 3.0 ft/s is reasonable. It was also determined by Knoblauch, et al. (1995) that the slower walking speed of older pedestrians is due largely to their shorter stride lengths. The stride lengths of all older pedestrians are approximately 86 percent of those of younger pedestrians.
Knoblauch, et al. (1995) also measured start-up times for younger and older pedestrians who stopped at the curb and waited for the signal to change before starting to cross. The mean value for younger pedestrians was 1.93 s compared with 2.48 s for older pedestrians. The 85th percentile value of 3.06 s was obtained for younger pedestrians, compared with 3.76 s for older pedestrians. For design purposes, the authors concluded that a mean value of 2.5 s and an 85th percentile value of 3.75 s would be appropriate.
These data specifically did not include pedestrians using a tripod cane, a walker, or two canes; people in wheelchairs; or people walking bikes or dogs. The MUTCD (2009) states that the walk interval should be at least 7 s long so that pedestrians will have adequate opportunity to leave the curb or shoulder before the pedestrian clearance time begins (where pedestrian volumes and characteristics do not require 7 s, walk intervals as short as 4 s may be used). Parsonson (1992) noted that the reason this much time is needed is because many pedestrians waiting at the curb watch the traffic, and not the signals. When they see conflicting traffic coming to a stop, they will then look at the signal to check that it has changed in their favor. If they are waiting at a right-hand curb, they will often take time to glance to their left rear to see if an entering vehicle is about to make a right turn across their path. Parsonson reported that a pedestrian reasonably close to the curb and alert to a normal degree can be observed to require up to 4 or 5 s for this reaction, timed from when the signal changes to indicate that it is safe to cross, to stepping off the curb. It may be remembered that aging pedestrians stand farther away from the curb, and may or may not be alert. In addition, there are many drivers who run the amber and red signals, and it is prudent for pedestrians to "double-check" that traffic has indeed obeyed the traffic signal, and that there are no vehicles turning right on red or (permissive) left on green before proceeding into the crosswalk. Because aging persons have difficulty dividing attention, this scanning and decision-making process requires more time than it would for a younger pedestrian. Parsonson (1992) reported that the State of Delaware has found that pedestrians do not react well to the short WALK and long flashing DON'T WALK timing pattern. They equate the flashing with a vehicle yellow period. The Florida Department of Transportation and the city of Durham, Ontario, provide sufficient WALK time for the pedestrian to reach the middle of the street, so that the pedestrian will not turn around when the flashing DONT WALK begins.
Fitzpatrick, et al (2006) studied characteristics of walking speed associated with different roadway conditions and pedestrian characteristics. Data on pedestrian crossings were grouped into "young" (between the ages of 15 and 60) and "old" (older than 60). A total of 3,155 pedestrian crossings were recorded during the study. Of that, 81 percent (2,552 pedestrians) were observed as "walking." The remaining 19 percent of the pedestrians (603) were observed to be running, both walking and running during the crossing, or using some form of assistance (e.g., skates or bicycles). Those 603 data points were not included in the analyses, nor were 107 walking pedestrians whose ages could not be estimated and six pedestrians whose genders could not be determined. For the remaining crossings, they determined that the walking speed values for older pedestrians were lower than those for younger people. For young pedestrians, the 15th percentile walking speed was 3.77 ft/s (1.15 m/s). Older pedestrians had a slower walking speed with the 15th percentile being 3.03 ft/s (0.9 m/s). The average walking speed was 4.25 and 4.74 ft/s (1.3 and 1.45 m/s) for old and young pedestrians, respectively.
Most recently, TEH and AAA Foundation for Traffic Safety (Stollof, McGee, and Eccles, 2007) published a study on pedestrian walking rates of aging persons and the effects of slower rates on signal timing operations. The study included a review of past studies (many of which were previously discussed) and the collection of additional observational data in six cities throughout the U.S. The results showed the 15th percentile of aging pedestrians to range between 3.4 and 3.8 ft/s. The study recommended a walking speed of 3.5 ft/s. However, additional guidance was provided to use a walking speed of 3.0 ft/s at locations where pedestrians are routinely crossing at a slower pace. Under those conditions, it is also recommended that the crossing distance used in the calculation of the WALK and pedestrian clearance interval be measured from 6 ft back of the edge of curb (starting location assumption) to the far side of the travel way being crossed. Recommendation A of this Design Element 16 reflects the guidance for accommodating slower pedestrians.
One strategy that has appeared to offer promise in assisting pedestrians who are slower or more reluctant to cross when there is a perceived likelihood of conflict with turning vehicles is the leading pedestrian interval (LPI). A LPI is a brief, exclusive signal phase dedicated to pedestrian traffic. Van Houten, et al. (1997) investigated the effects of a 3-s LPI on pedestrian behavior and conflicts with turning vehicles at three urban intersections in St. Petersburg, FL. In the study, pedestrian-vehicle conflicts were observed during a baseline period, where the signal phasings at each intersection provided the onset of the pedestrian WALK signal and the onset of the green signal for turning vehicles concurrently. During the experimental phase, a 3-s LPI was installed to release pedestrian traffic three seconds before turning vehicles. The LPI was implemented using a modified, solid-state plug-in signal load switch that had the capacity to delay the change of the traffic signal phase from red to green. Pedestrians estimated to be age 65 and older were scored separately from those estimated to be age 12 and older. A total of 1,195 seniors and 3,680 nonseniors were observed across all three sites during the baseline condition. During the LPI condition, 860 seniors and 4,288 nonseniors were observed.
Observers collected data between 8:30 a.m. and 5:00 p.m., and scored the number of pedestrians who left the curb within 2 s before the start of the WALK indication, within 3 s after onset of the WALK indication, during the remainder of the WALK cycle, and during the flashing DON'T WALK indication. The number of conflicts was scored for each of these intervals, defined as any situation where a driver engaged in abrupt braking or either the driver or pedestrian took sudden evasive action to avoid a collision. Conflicts were scored separately for right-tuning and left-turning vehicles. Other data of interest included the number of times that a pedestrian yielded to a turning vehicle by stopping or waving the vehicle through, and the distance covered by the pedestrian during the LPI condition. The intersection geometries included the following: (1) one-way traffic with four northbound lanes by two-way traffic with one lane in each direction and diagonal parking (north and west crosswalks were observed because both included left-on-green conflict potential); (2) one-way traffic with four southbound lanes by two-way traffic with one lane in each direction and diagonal parking (south and east crosswalks were observed because both included left-on-green conflict potential); and (3) two-way traffic with two lanes in each direction by two-way traffic with two lanes in each direction (all four crosswalks were observed).
The number of conflicts per 100 pedestrians who started crossing during a defined 5-s begin-walk period (which began 2 s before and ended 3 s after the onset of the WALK indication) showed that during the baseline period, the number of conflicts averaged 3.0, 2.1, and 3.3 for the three sites. After the introduction of the LPI, the number of conflicts averaged 0.1, 0.1, and 0.2 for the three sites. The likelihood of conflict was significantly lower during the LPI condition than during the baseline condition for both left- and right-turning vehicles; the odds of conflict for pedestrians leaving the curb during the begin-walk period were reduced by approximately 95 percent. The reduction in odds conflict for seniors as a function of an LPI phase (89 percent reduction) was not significantly different from that of their younger counterparts (97 percent reduction). There was no significant effect of LPI on the odds of conflict for pedestrians leaving the curb after the begin-walk period, indicating that an LPI does not move conflicts to a later phase in the WALK interval.
The LPI also had the effect of significantly reducing the number of pedestrians yielding to turning vehicles; the odds of a pedestrian yielding to a turning vehicle were reduced by approximately 60 percent. Van Houten et al. (1997) indicate that once pedestrians were in the crosswalk, drivers acknowledged their presence and were more likely to yield the right of way. Also, they state that pedestrians occupying the crosswalk were more visible to drivers who were waiting for the light to change than they would have been had the drivers and pedestrians been released concurrently. The final measure of interest was the mean distance traveled by the lead pedestrian during the LPI condition, which averaged 8.5 ft. The authors state that this distance (which is greater than one-half of a lane width) appears sufficient for pedestrians to assert their right of way ahead of turning vehicles, and reduces conflicts that may result when pedestrians and vehicles begin to move at the same time.
In terms of research on the countdown pedestrian signal, only one formal study was found which attempted to quantify the effects on pedestrian crashes after converting standard WALK/DONT WALK signals to the countdown signals. A study by Markowitz, et al. (2006) involved installing countdown signals at about 700 of the 1,100 signalized intersections in San Francisco. An initial pilot evaluation was performed at nine sites, which found that pedestrian injury crashes dropped from 27 to 13 after countdown signal installation, a 52% reduction, with a slight decline in pedestrian crashes for the primary untreated comparison group. The authors cited regression-to-the-mean as a factor in this crash reduction, but noted that the decline in pedestrian injury crashes was consistently greater with the countdown sites than the non-countdown sites. The authors further concluded that "…although the 53% reduction in collisions overstates the impact of the countdown, a real reduction did occur."
As a part of that Markowitz article, the authors also conducted a behavioral evaluation of the countdown signals at eight intersections and found that after installing the countdown signals, there was a significant reduction in the percentage of pedestrians still in the crosswalk when the signal turned to red. There was also a significant reduction in the percentage of pedestrians who were running or had an aborted crossing after the countdown signal installation. There was a small increase in the percentage of pedestrians who left early (i.e., on the flashing hand or solid hand) but that increase was not statistically significant.
A follow-up crash-based analysis by the authors was performed which involved a sample of 579 intersections which involved converting traditional pedestrian signal heads with countdown pedestrian heads and the use of 204 untreated control sites. Based on an average of pedestrian crashes in a one-year before period (average for years 2001 and 2002) and a one-year after period (2003), pedestrian crashes dropped by 25% at the "treated" sites, compared to an increase of 16% at the "Untreated" sites. The authors add that: "This provides some statistical support to popular claims that the addition of countdown devices has improved safety."
Numerous other studies have been conducted in recent years to evaluate the effects of countdown signals on pedestrian and motorist behavior, conflicts between pedestrians and motorists, and/or surveys which ask pedestrians their opinions about countdown signals. For example, Eccles, Tao, and Mangum (2003) evaluated countdown pedestrian signals at 5 intersections in Montgomery County, Maryland. The results found that of the 20 intersection approaches, the proportion of pedestrians entering the street during the flashing or steady hand decreased at 13 of the approaches (6 decreases were significant) with a significant increase at 2 approaches. Of the 4 approaches where pedestrian/vehicle conflicts were recorded, pedestrian-vehicle conflicts decreased at all four intersections after installation of the countdown signals (significant at the 0.05 level).
A study by Rousseau and Davis (2003) compared 6 display-timing strategies with the standard MUTCD pedestrian signal to gain information on pedestrian understanding. A total of 134 participants were tested in three age groups: 18 to 29, 30 to 59, and 60 and above. A higher percentage of aging pedestrians (compared to other age groups) were found to have difficulties in understanding the conventional pedestrian signal displays. The countdown signal display resulted in a substantial improvement in the understanding of the pedestrian signal display by aging adults.
Countermeasures that have been suggested to reduce the occurrence of aging driver crashes at intersections have included changes to intersection operations (e.g., protected left-turn phases, elimination of RTOR, redundant signing, etc.) and geometric design (e.g., full positive offset of opposite left-turn lanes, increases in turning radius for right turns, etc.). One proposed solution to reduce not only the frequency but also the severity of crashes at intersections is the installation of a modern roundabout (Harkey, 1995; Jacquemart, 1998). Modern roundabouts are an intersection design that has been in use in Europe and Australia for decades, but have more recently come into their own in the United States. Over a 10-15 year period beginning in the late 1990s interest in roundabouts has increased exponentially in this country, and more jurisdictions have installed them as their benefits have become better known. FHWA released two Roundabout Guides (Robinson, et al. 2000; Rodegerdts, et al. 2010) during that period of time, and a number of other research projects have explored the various operational and safety benefits of roundabouts. In addition, FHWA considers roundabouts to be a Proven Safety Countermeasure (FHWA Office of Safety 2012).
There are treatments currently within the Handbook that discuss features at roundabout intersections that can benefit aging drivers; however, roundabouts themselves can be a beneficial treatment over a traditional stop- or signal-controlled intersection if properly designed to meet the needs of that location. A great deal of existing research on roundabouts has not been conducted specifically from the perspective of the aging road user, but the benefits apply to drivers and pedestrians of any age. It may be necessary to provide focused educational efforts to aging drivers when roundabouts are introduced into a community, so that unfamiliarities with that design can be at least somewhat mitigated. Indeed, FHWA's Roundabout Outreach and Education Toolbox (FHWA Office of Safety 2013) provides a search feature that includes "older drivers" as a searchable target audience.
This countermeasure, it has been suggested, addresses problems that aging drivers experience in judging speeds and gaps, understanding operational rules at complex intersections, and maneuvering through turns. Specifically, the following advantages of roundabouts for aging road users have been postulated:
Reductions in the speed of vehicles entering the intersection/circle— this makes it easier to choose an acceptable gap to merge into, removes the need to accelerate quickly which occurs after a conventional right turn, and results in lower severity crashes with less serious injuries.
The left turn is completely eliminated.
The larger curb radius improves maneuverability.
Simplified decision process results from one-way operation, yield-at-entry, and a reduced number of conflict points compared to a conventional intersection.
A potential for improved pedestrian safety results from shorter crossing distances, fewer possibilities for conflicts with vehicles, and lower vehicle speeds—but, there are many unresolved issues surrounding the use of these facilities by (elderly and visually impaired) pedestrians at this time.
| Applications in Standard Reference Manuals | |||
|---|---|---|---|
| MUTCD (2009) | AASHTO Green Book (2011) | Highway Capacity Manual (2010) | Roundabouts: An Informational Guide, Second Edition (2010) |
| Sect. 2B.43 through 2B.45, 3B.16 Chapt. 3C | Pgs. 9-167 through 9-176, Sect. 9-10 Roundabout Design | Chapter 21 | Pg. 1-7, Exhibit 1-5, Items c & d Pg. 1-11, Exhibit 1-8, Items g and h Pg. 1-11, Exhibit 1-8, Item f Pg. 1-12, Exhibit 1-9 Pg. 1-13, Sect. 1.3.2 Pgs. 2-3 through 2-4, Sect. 2.2.1 Pgs. 2-15 through 2-17, Sect. 2.3.2 Pgs. 2-18 through 2-19, Sect. 2.3.4 Pg. 3-5, Exhibit 3-1 (Determine Preliminary Lane Numbers, and Determine the Space Requirements) Pg. 3-8, first two bullets on pg. Pgs. 3-21 through 3-24, Sect. 3.5.1 Pg. 3-30, third bullet Pg. 3-26, Sect. 3.5.3 and Pg. 3-27, Exhibit 3-17 Pgs. 4-4 and 4-5, Sect. 4.2.1 Pgs. 4-10 through 4-19, Sects. 4.4 through 4.6 Pg. 5-4, 1st Bullet Pgs. 5-6 through 5-7, Sect. 5.2.1 Pgs. 5-10 through 5-12, Sect. 5.2.3 Pg. 5-15, Exhibit 5-9 Pg. 5-19, Para. 1 Pg. 5-21, last paragraph Pgs. 5-22 through 5-24, Sect. 5.4.1 Pg. 6-9, Exhibit 6-2 (Entry Width, Circulatory Roadway Width, & Inscribed Circle Diameter) Pgs. 6-11 through 6-13, Sect. 6.2.3 Pgs. 6-17 through 6-18, Sect. 6.3.1 Pgs. 6-24 through 6-25, Sects. 6.4.2 and 6.4.3 Pg. 6-25, Sect. 6.4.4 Pgs. 6-22 through 6-24, Sect. 6.4.1 Pgs. 6-67 through 6-71, Sect. 6.8.1 Pgs. 6-76 through 6-77, Sects. 6.8.5.2 and 6.8.5.3 Pgs. 6-46 through 6-47, Sect. 6.6.1 Glossary: Central Island, Circulatory Roadway Width, Entry Width, Inscribed Circle Diameter, Pedestrian Refuge, & Splitter Island |
At the same time, there are significant human factors concerns about special driving task demands associated with the geometric and operational characteristics of roundabouts, and their novelty in this country. First, the driver approaching a roundabout must comprehend the prescribed movements, and in particular the yield-on-entry operation, as conveyed by upstream signing. For some years to come, these TCD's will be novel to motorists; and aging persons are at a disadvantage in responding to novel, unexpected stimuli. Upon closer approach, the appropriate speed and heading changes to conform to the splitter island's controlling channelization must be performed; and where increased crash experience has been documented following roundabout installation, as discussed below, excessive entry speeds have been the prevalent contributing factor. Again, vehicle control for smooth entry may be more challenging for aging than for younger drivers. At the point of entry, depending upon the deflection angle of the splitter island, there are critical seconds where confirmation that no conflict exists with a vehicle already in the roundabout requires a glance orientation that well exceeds 90°. The increased difficulty for aging drivers for visual search at skewed intersections has been underscored elsewhere in this Handbook (see page 41).
During negotiation of a roundabout, the ability to share attention between path guidance; gap (headway) maintenance; and visual detection, recognition, comprehension, and decision making associated with exit location cues is a near-continuous requirement, even for single-lane facilities. With multiple lanes, the avoidance of conflicts with adjacent vehicles places an exaggerated demand on motorists' attention-sharing abilities; and of course, the increased traffic volumes and speeds associated with these higher-capacity installations pose still greater demands. In the absence of controlled studies in the use of roundabouts by aging drivers, it can only be stated qualitatively that information processing capacity will be exceeded sooner for older than younger persons, and that accommodation by some seniors—probably by reducing their speed while in the roundabout—is likely. This will detract from the operational benefits roundabouts are designed to produce, and may impact safety as well.
A better understanding of the operational and safety issues surrounding the use of roundabouts by aging drivers and pedestrians depends upon crash data analyses from the limited number of existing facilities, and controlled and observational research in this area. This will require time, and more and more of these facilities are expected to come into operation in the immediate future. Thus, recommendations about when and why to use roundabouts to accommodate aging road users remain premature, but an understanding of roundabout task demands that pose special difficulty for seniors allow for certain recommendations regarding preferred practices when a jurisdiction has decided to install a roundabout. The recommendations presented for this design element attempt to balance the human factors considerations above with the accumulating body of information supporting roundabout usage, discussed below.
AASHTO (2011) presents the principles for modern roundabouts and discusses the need to accommodate all modes; the Green Book provides some degree of specific design guidance in Section 9.10, but it refers the reader to NCHRP Report 672, which is the second edition of FHWA's Roundabouts: An Informational Guide (FHWA, 2010) and provides more detail on specific design parameters. The Highway Capacity Manual (2010) includes methodology for estimating capacity and level of service at roundabouts. Presently, several States have design guidelines for roundabouts (Florida, 1996 and Maryland, 1995) based largely on Australian guidelines. Both Florida and Maryland used SIDRA software (Australian methodology) in those guidelines to conduct an analysis of the capacity of a planned roundabout, which is available through McTrans at the University of Florida at Gainesville. A guide written for the California Department of Transportation by Ourston and Doctors (1995) is based on British standards; according to Jacquemart (1998), Caltrans decided not to publish it. However, California DOT has distributed a Design Information Bulletin (No. 80) to provide general guidance to project engineers on appropriate applications, site requirements, geometric elements, and traffic analysis. New York State is developing an Engineering Instruction (EI) on roundabouts that will base design guidance on British Guides and software (RODEL). The EI notes that other software programs are permitted (e.g., Highway Capacity, SIDRA, ARCADY), provided that a RODEL analysis is performed for comparison purposes. This EI is to provide interim guidance for current projects, and will be incorporated into the NY State Highway Design Manual.
Flannery and Datta (1996) indicate that roundabouts are commonly used in Australia, Great Britain, France, Germany, Denmark, Ireland, Norway, Portugal, Spain, South Africa, Sweden, Switzerland, and the Netherlands. Sarkar, Burden, and Wallwork (1999) state that modern roundabouts are gaining in popularity in cities across the U.S. (in Arizona, California, Colorado, Florida, Kansas, Maryland, Massachusetts, Nevada, Oregon, Texas, and Wisconsin) because of their success in reducing speeds and the number of collisions. Because speeds are reduced, crashes are less severe. Because perpendicular left and right turns are eliminated, a roundabout with one-lane entries has fewer potential conflict points than a conventional intersection (8 vehicle-to-vehicle conflicts and 8 vehicle-to-pedestrian conflicts for a roundabout with 4, 1-lane entries, compared to 32 vehicle-to-vehicle conflicts and 24 vehicle-to-pedestrian conflicts for a conventional four-leg intersection). Jacquemart (1998) reports that as of the middle of 1997, there were fewer than 50 modern roundabouts in the U.S., compared to more than 35,000 in the rest of the world, with France owning the leading number of roundabouts (15,000 modern roundabouts currently, and growing at a rate of 1,000 per year).
Flannery and Datta (1996) highlight the fact that modern roundabouts are different than earlier rotaries and traffic circles common in the early 1900's. First, the modern roundabout requires drivers who are entering the circle to yield to traffic already in the circle (known as "offside priority"). Early roundabout operations gave priority to drivers entering the circle ("nearside priority"), which caused circulating traffic to come to a complete stop resulting in grid-lock. As a result of nearside priority, Flannery and Datta state that the operational performance of traffic circles declined rapidly with the increase in traffic beginning in the 1950's. Because traffic engineers believed that the problem was increased volume as opposed to nearside priority, traffic circles were generally abandoned in the U.S. Studies conducted in the Netherlands, Victoria Australia, and Western Australia have found significant reductions in crashes and casualty rates (from 60 to 90 percent fewer) at roundabouts converted from the old priority to the yield-on-entry priority.
Two other improvements in modern roundabout design are deflection, which helps to slow entering vehicles, resulting in safer merges with the circulating traffic stream, and flared approaches, which helps to increase capacity by increasing the number of lanes on the approach (Flannery and Datta, 1996). Jacquemart (1998) describes deflection as: "No tangential entries are permitted and no traffic stream gets a straight movement through the intersection. Entering traffic points toward the central island, which deflects vehicles to the right, thus causing low entry speeds." The splitter island is the geometric feature that physically separates entering traffic from exiting traffic, and defines the entry angle, which deflects and slows entering traffic. Looking at flared approaches from the viewpoint of accommodating aging driver needs for simplicity, one-lane approaches are likely to be easier to negotiate. In the NCHRP Synthesis of Roundabout Practice in the United States, Jacquemart (1998) notes that safety benefits of roundabouts (from studies in Australia and Europe) seem to be greatest for single-lane roundabouts in rural conditions. Generally, safety benefits are related to the reduced speed in the roundabouts, the simplification of conflict points, and the "increased responsibility caused by the slower motion and the need to concentrate and yield, as compared to driver behavior in signalized intersections" (Jacquemart, 1998).
As noted earlier, studies performed to date to evaluate the safety performance of roundabouts have not included driver age as a variable. Flannery and Datta (1996) conducted a safety analysis of six sites in Florida, Maryland, and Nevada that were converted from conventional intersections with traditional control (1-way stop, 2-way stop, or signalized) to roundabouts. All six sites had one-lane entrances and only one lane of circulating traffic. Five roundabouts had a posted speed of 35 mph and one had a posted speed of 45 mph. Four of the sites had four approaches and two sites had three approach legs. Crash data were collected for a period of 1 to 3 years before and after retrofitting the sites (depending on location). Results of chi-squared and normal approximation statistical tests indicated that crash frequencies were significantly reduced in the period after the sites were retrofitted as modern roundabouts. The sites were not stratified by ADT or previous type of traffic control, as the sample size was small; therefore particular crash reduction factors were not identified. However, quick inspection of the crash frequencies provided by site indicate that only the roundabout retrofitted from a signalized intersection showed an increase in crashes in the after period; the other five sites (1-way and 2-way stop controlled) showed decreases in crash frequency in the after period (in the range of 60 to 70 percent). Analyses could only be performed on crash frequencies by group (as opposed to site), because traffic volumes before and after were not characterized, and the six retrofitted roundabouts varied in ADT from 4,069 to 17,825 vehicles.
Rahman (1995) and Jacquemart (1998) provided before and after crash data for the roundabout established in Lisbon, MD in 1993. In the six years prior to the roundabout, there were 45 reported intersection crashes with an average of eight crashes per year. From 1993 to 1995 (after roundabout installation), there were only two reported crashes. Before the roundabout, the crashes were almost all angle crashes, and after the roundabout was installed, one of the crashes was a single-vehicle crash against a fixed object, and the other crash was a rear-end crash. Injury crashes decreased from 4.3 per year to 0.3. Total delays decreased by 45 percent, from 1.2 vehicle hours to 0.34 vehicle hours in the morning peak hour and from 1.09 vehicle hours to 0.92 vehicle hours in the afternoon peak. This roundabout has four approach legs; it was retrofitted from a 2-way stop-controlled (flashing red beacon) intersection. The ADT was 8,500 vehicles (in March of 1995). The inscribed diameter is 100 ft, there are one-lane entries measuring 18 ft, there is one lane of circulating traffic that is 18-ft wide, and in 1995 the peak hour total approach volume was 630 (Jacquemart, 1998). Rahman (1995) stated that, "the performance of this first experimental roundabout in Maryland demonstrates the safety of roundabouts when properly designed."
Jacquemart (1998) examined the before and after crash data of 11 roundabouts in the U.S. Results are described for large roundabouts with three-lane entries (one in Long Beach, CA and two in Vail, CO) and smaller roundabouts with one- or two-lane entries and inscribed circle diameters of 37 m (121 ft) or less (Santa Barbara, CA; Lisbon, Cearfoss, Lothian, and Leeds, MD; Tampa, FL; Montpelier, VT; and Hilton Head, SC). He states that the small- to moderate-size roundabouts showed significant reductions in total crashes (from an average annual crash frequency 4.8 to 2.4, or 51 percent) and injury crashes (from an average annual crash frequency of 2.0 to 0.5, or 73 percent). There were no statistically significant differences in property-damage-only (PDO) crashes at the smaller roundabouts, although there was a reduction from 2.4 to 1.6 average annual crashes, or 32 percent. Although there was a trend toward crash reduction for the larger roundabouts, there were no statistically significant reductions in total crashes, injury crashes, or PDO crashes. Each roundabout experienced a reduction in injury crashes ranging from 20 to 100 percent. PDO crashes increased at a roundabout in Vail, CO from 15 to 18 per year, and at Leeds, MD from 1.5 to 5.3 per year. At the other 9 roundabouts, however, PDO crashes decreased from 6 to 1 per year. Although PDO crashes at the Leeds, MD site showed an increase, injury crashes decreased from 2.2 to 0.0 per year. The PDO crashes at this site were all single-vehicle crashes that occurred because the vehicles entered the roundabout too fast. Jacquemart (1998) reports findings by Niederhauser, Collins, and Myers (1997) who showed that the average cost per crash decreased by 30 percent across the 5 conventional intersections in Maryland that were retrofitted to roundabouts, from $120,000 before the roundabout to $84,000 after the roundabout.
Niederhauser, Collins, and Myers (1997) reported the before and after average annual crash history for the five intersections in Maryland that were converted to roundabouts. All sites are single-lane approach and single-lane circulating roundabouts. Overall, the average crash rate was reduced from an average of 5.0 crashes per year to an average of 2.4 crashes per year, which is a reduction of greater than 50 percent. Data for each roundabout is reported in Table 35.
| Site | Average Annual Crashes | |
|---|---|---|
| Before | After | |
| Lisbon | 6.0 | 2.0 |
| Cearfoss | 2.7 | 0.0 |
| Leeds | 3.3 | 4.9 |
| Lothian | 7.7 | 5.1 |
| Taneytown | 5.3 | 0.0 |
Persuad, et al. (2000) evaluated the change in crashes following conversion of 24 intersections in urban, suburban, and rural environments in 8 States (California, Colorado, Florida, Kansas, Maine, Maryland, South Carolina, and Vermont) from stop-sign or signal control to modern roundabouts. The Bayes procedure was used to account for regression to the mean and to normalize differences in traffic volume between the before and after periods. The number of months of crash data available in the before period ranged from 21 to 66, and the number of months of crash data available in the after period ranged from 15 to 68. Across all sites and crash severities, crashes were reduced by 39 percent in the after-conversion period. A 76-percent reduction was estimated in the after period for injury crashes. For the 20 sites where injury data were available, there were 3 fatal crashes in the before period, and none in the after period. There were 27 incapacitating injury crashes in the before period, and 3 in the after period. Thus, the estimated reduction in fatal and incapacitating injury crashes is 89 percent.
Persuad et al. (2000) looked at the crash reduction rates as a function of operating environment and before-conversion control. For the nine urban single-lane roundabouts converted from stop control, a 61-percent reduction was estimated for all crash severities combined, and a reduction of 77 percent was estimated for injury crashes. For the five rural single-lane roundabouts converted from stop control, a 58-percent reduction was estimated for all crash severities combined, and a reduction of 82 percent was estimated for injury crashes. For the seven urban multilane roundabouts, a 15 percent reduction in crashes of all severities was estimated. Injury data were not available for four these sites in the before-conversion period. For the three roundabouts converted from traffic signal control, all crashes were reduced by 32 percent, and injury crashes by 68 percent. The authors noted that the smaller safety effects for the group of urban multilane roundabouts suggests that there may be differences in safety performance for single-lane designs compared to multi-lane designs. However, they caution that all seven of these roundabouts were located in one State (Colorado) where three of the four in the city of Vail were part of a freeway interchange that also included nearby intersections that were previously four-way stop-controlled. Finally in this research, pedestrian and bicycle crash samples were too small to be meaningful; however, there were three reported pedestrian crashes during the before period and one with minimal injuries in the after period. Four bicyclists were injured in the before period and three during the after period.
Wallwork (1993) notes that crashes do occur at roundabouts, and consist of rear-end or merge-type crashes. Both crash types are low speed and low impact, and result in few – if any – injuries. He stated that with a roundabout, "no one can 'run the red,' and cause a right-angle collision, nor can drivers make a mistake in selecting a gap in the approaching through traffic when making a left turn. The only decision an entering driver needs to make is whether or not the gap in the approaching/circulating traffic is large enough to enter safely." Lower speeds (less than 25 mph) result in shorter braking distances and longer decision making times. Even if a driver makes a mistake and chooses a gap that is too short, a collision is easier to avoid. Thus, the reduction in task difficulty coupled with the low speed environment, results in an overall reduction in the number of crashes, and a reduction in the severity of the crashes that do occur, which should be especially beneficial to aging persons.
The delays before and after eight intersections (seven of which were two-way, or multi-way stop-controlled, and one was signalized) were converted to roundabouts were also described by Jacquemart (1998). The total delay (stopped delay plus move-up time in queue) for eight U.S. roundabouts before retrofit was 13.7 s for morning peak time and 14.5 s for afternoon peak time. This compares to 3.1 s for morning and 3.5 s for afternoon peak times after conversion to roundabouts. Delays were thus reduced by 78 percent in morning peak periods, and by 76 percent in afternoon peak periods, after intersections were converted to roundabouts.
Jacquemart (1998) received information about the design of 38 roundabouts in the U.S., and presented data for four major geometric features: (1) inscribed circle diameter; (2) circulatory roadway width; (3) central island; and (4) entry widths. The inscribed circle diameter is defined as the circle that can be inscribed within the outer curbline of the circulatory roadway. Twenty-eight of the 31 roundabouts for which data were provided on this element have an inscribed circle diameter in the range of 98 to 200 ft, with the majority of these (11) ranging from 98 to 108 ft. Regarding circulatory roadway width, 43 percent of the cases are 15- to 18-ft wide; 21 percent are 20 to 23-ft wide; 25 percent are 24 to 30-ft; and 11 percent are 35 to 36-ft wide. Thus, 36 percent are at least 2 lanes wide. The central island can be raised or flush, or it can be raised with a sloping curb or drivable apron surrounding it. The truck apron is generally included in the central island diameter. Jacquemart reports that approximately 66 percent of the roundabouts for which data were provided have central islands greater than 30 ft diameter. Regarding entry widths, 59 percent of the reported cases have single-lane entries, 30 percent have two-lane entries, and 11 percent have three or more lane entry legs. Studies in other countries help to shed some light on the optimum design characteristics of modern roundabouts.
In the Jacquemart (1998) synthesis, a study by Brilon (1996) of 34 modern roundabouts in Germany concluded that 98 ft seemed to be the ideal inscribed diameter for a single-lane roundabout. Brilon states that smaller diameters result in larger circulatory roadways, which reduces the deflection. Additionally, truck aprons with a rougher pavement are recommended, so that the circulatory roadway remains 13 to 15-ft wide. In a study of 83 roundabouts in France (Centre D'Etudes Techniques de L'Equipment de l'Ouest, 1986) in Jacquemart (1998), it is also concluded that roundabouts with smaller diameters have fewer crashes than larger roundabouts or those with oval circles (see Table 36).
| Number of Roundabouts | Inscribed Diameter (ft) | Crashes per Roundabout |
|---|---|---|
| 13 | <98 | 0.69 |
| 11 | 98 to 164 | 1.54 |
| 26 | 164 to 230 | 1.58 |
| 16 | 230 to 295 | 1.81 |
| 8 | >295 | 3.80 |
| 9 | Oval | 4.40 |
Splitter islands are another geometric feature of modern roundabouts. These are generally raised islands that are placed within a leg of a roundabout to separate entering and exiting traffic, and to deflect entering traffic. They also serve as a safety zone for pedestrians. Only one of the 38 roundabouts has painted (marked) splitter islands. The study conducted in Germany (Brilon, 1996, in Jacquemart, 1998) concluded that splitter islands are important to the safety of pedestrians, and should be 5- to 8-ft wide, with pedestrian crossings located 13 to 16 ft back from the circulating roadway. A study conducted in Switzerland by Simon and Rutz, 1988 (in Jacquemart, 1998) also concluded that the distance between the pedestrian crossing and the inscribed circle should be 16 ft as greater distances do not increase pedestrian safety. They recommended the use of splitter islands with safety zones for pedestrians for crossings of more than 300 vehicles per hour. Wallwork (1999) states that a feature of roundabouts that makes them safer for pedestrian than conventional intersections is that pedestrians walk behind the cars. He recommends moving the crosswalk back one car length from the yield line for each lane of entry (i.e., one car length for a one-lane entry, two car lengths for a two-lane entry, or three car lengths for a three-lane entry). Brilon (1996) recommended Zebra-striped crossings only when there were more than 100 pedestrians crossing during the peak hour. Maryland (DOT/SHA, 1995) normally places pedestrian crossings 20 to 25 ft from the yield line. Crosswalk striping is not used, to avoid driver confusion of crosswalk limit lines with yield lines. Special consideration is given in providing priority crossings for pedestrians where pedestrian volumes are high, where there is a high proportion of younger or older pedestrians, or where pedestrians experience particular difficulty in crossing, and are being delayed excessively. The agency believes that it is desirable to place these crossings at least 75 ft downstream of the exit from the roundabout and possibly augment the crossing with a signal. This will reduce the possibility that vehicles delayed at the pedestrian crossing will queue back into the roundabout, and gridlock the whole intersection.
In the survey conducted by Jacquemart (1998) detailing 38 U.S. roundabouts, 56 percent of the sites were reported to have no or very few pedestrians, 22 percent have between 20 and 60 pedestrians during the peak hour, and 22 percent have more than 60 pedestrians per hour. Of particular interest is the Montpelier, Vermont roundabout, which is located next to a senior housing project and is also close to a middle school (400 students), and carries in excess of 260 pedestrians during each rush-hour (morning and afternoon) period on school days (Gamble, 1996; Redington, 1997). This roundabout has 3 legs, an inscribed diameter of 34 m, one-lane entries for each lane and one lane of circulating traffic. The AADT is approximately 11,000 (7,300 AADT for each leg) and carries approximately 40 tractor trailers (WB-62) each day (Redington, 1997). The peak hour total approach volume is 1,000 vehicles (Jacquemart, 1998). Prior traffic control was a one-way stop at a Y-intersection.
Jacquemart (1998) lists criteria to assist visually impaired pedestrians that include: (1) keeping the crossing away from the circle (e.g., 5 to 6 m from the outer circle) lets the blind person distinguish the exiting traffic from the circulating traffic; and (2) the splitter island provides a refuge where the pedestrian can shift his or her attention from one traffic stream to another. Different pavement texture for the walkways will assist the visually impaired pedestrian in locating the crosswalks. Drivers approaching a roundabout approach at speeds slower than they would for an approach to a conventional intersection; thus, they are more likely to stop for pedestrians, and may be more likely to notice a pedestrian on an approach to a roundabout because they are not concentrating on finding a gap in the opposing traffic stream to turn left.
Harkey and Carter (2006) evaluated pedestrian and bicyclist behaviors at single-lane and multilane roundabouts in eight states. The results of the study showed vehicles exiting a roundabout to be less likely to yield (38% non-yield rate) to crossing pedestrians than vehicles approaching a roundabout (23% non-yield rate). There was also less yielding to crossing pedestrians on multilane approaches (43% non-yield rate) compared to single-lane approaches (17% non-yield rates). The authors concluded that roundabouts need to be designed to ensure adequate sight lines and slow vehicle speeds on the exit legs. Multilane roundabouts may also require additional measures to minimize the risk of multiple-threat collisions and create a safe crossing environment.
Jacquemart (1998) also provided a summary of the current lighting, signing, and pavement marking practices at the 38 U.S. roundabouts for which questionnaire data were provided. First, all existing roundabouts were reported to have nighttime lighting. Next, all roundabouts were reported to have the standard YIELD sign, although often it was supplemented by an additional plate with specific instructions, such as "TO TRAFFIC ON LEFT;" "TO TRAFFIC IN ROUNDABOUT;" or "TO TRAFFIC IN CIRCLE;" or with the international roundabout symbol, which is three arrows in a circular pattern. In addition, 90 percent of the roundabouts contain an advance YIELD AHEAD symbol sign and 7 percent use the YIELD AHEAD legend sign. Twenty-four percent included a supplemental plate on the advance YIELD sign that said "AT ROUNDABOUT," presented the roundabout symbol, or displayed a speed limit sign. All roundabouts had either a one-way sign (R6-1 or R6-2) or a large arrow warning sign (W1-6) in the central island. Chevron signs often accompanied the one-way signs at the sites studied (see Figure 81). Regarding pavement markings, approximately 20 percent of the roundabouts supplemented the yield line at the roundabout entrance with the pavement marking legend "YIELD" or "YIELD AHEAD." For multilane roundabouts, only in the case of the Hilton Head, SC, roundabout were lane lines present. Jacquemart (1998) reported that the authorities responsible for the roundabout believe that the large number of senior drivers in the area would be more comfortable with lane markings in the circle. Simon and Rutz, 1988 (in Jacquemart, 1998) recommended that for main roads or national highways, advance directional signs with the roundabout symbol should supplement the roundabout yield sign at the entry, but that other special warning signs—such as roundabout ahead or priority to the left—are not recommended. Wallwork (1999) does not recommend the widespread use of supplemental signs (e.g., posting "TO TRAFFIC IN CROSSWALK" on the YIELD sign), because it constitutes visual clutter. Instead, he recommends their use only as a local measure to educate road users for a short time period after roundabout installation.
Figure 81. One Way and Chevron Sign Combination Used in Central Island of Roundabout (Jacquemart 1998)
Molino, Inman, Katz, and Emo (2007) conducted a driving simulator study using 90 participants equally distributed into three age groups: young (ages 18 to 25), middle-aged (26 to 64) and older (age 65 and older). Participants "drove" through double-lane roundabouts marked with five signing and pavement marking schemes:
A sixth condition with no lane restriction signs or markings, served as the control. Except for the destination lane restriction sign condition, all roundabouts had redundant indications of proper lane approach. Participants chose the correct entry lane between 89 and 91 percent of the time, and the percentages did not vary significantly among marking schemes. The overall compliance score across schemes was 89.2 percent; all 5 schemes resulted in successful compliance performance, if the criterion is set to 85 percent. However, the fact that in 11 percent of the scenarios, drivers continued to make left turns from the right lane, even when the signs and markings clearly showed that the right lane must turn right is both an operational and safety concern. The 11 percent compliance failure occurred regardless of the fact that signs/markings were redundantly presented on each approach. Molino et al. (2007) report that in field conditions, where there may be less redundancy in signs and markings, and where traffic may cause drivers to miss some lane restriction indications, overall compliance may be less than 89 percent.
In terms of driver comprehension, participants correctly understood the left and right lane options approximately 90 percent of the time across schemes, but often did not understand markings allowing them to use "either" entry lane to reach their destination. Comprehension for "either" lane entry options was only 44 percent, and was not significantly different across the 5 schemes. Comprehension for the marking schemes ranged from 70 to 78 percent when participants were required to report which, among three lane choices was correct (left, right, or either). Overall comprehension, collapsed across the 5 schemes was 74.9 percent; none of the signing and marking schemes resulted in successful comprehension performance. Poor comprehension that entry from either lane was allowable could interfere with roundabout capacity design calculations. Although comprehension across all schemes was poor, there were no attempts to drive through the roundabout in the wrong direction with any of the schemes.
In terms of age and gender effects, Molino et al. (2007) found that although younger participants had higher percentages of correct responses for both compliance and comprehension than middle-aged participants, who in turn had higher percentages of correct responses than older participants, the differences were not statistically significant. Males had higher percentages of correct responses for both compliance and comprehension than females; however, the difference was significant only for compliance.
Molino et al. (2007) concluded that, based on the simulation results, conventional arrow signs and markings, fishhook signs and markings, or lane restrictions included on diagrammatic navigation signs would be equally effective, however, additional steps may be needed to achieve a higher rate of compliance where lane restriction compliance is deemed important for either operations or safety. The simulation results did not point to what steps would be effective.
Lord, et al. (2007) conducted a laboratory study with aging drivers to evaluate countermeasures that may have the potential to improve the perceived comfort, confidence, and/or safety of aging persons using roundabouts. Structured interviews were conducted in Texas and Arizona with 31 licensed drivers ages 65 and older, in addition to animated video presentations simulating an approach to and traversal of a roundabout. Five design elements were evaluated: (1) advance warning signs; (2) lane control signs; (3) directional signs; (4) yield treatments; and (5) exit sign treatments. For each design element, a base condition (representing existing standards of engineering and design practice as per the 2003 MUTCD) was presented along with two countermeasures. The countermeasures were developed using input from focus groups conducted with aging drivers in an earlier phase of the study. Still images were photographed of a roundabout unfamiliar to all participants (in Washington State), every 10 ft during an approach to and going around the roundabout, for a total of 64 images. The images were manipulated with photo-editing software to reflect each of the three alternatives, described in Table 37.
| Traffic Control Device | Baseline | Countermeasure 1 | Countermeasure 2 |
|---|---|---|---|
| Advance Warning Signs | W-2-6 Advance roundabout warning sign | Baseline sign with solid black circle added to center and supplemental plaque “Roundabout” | Countermeasure 1 sign with supplemental plaque (30 mph), but no “Roundabout” plaque |
| Lane Control Signs | Modeled after R3-8 advance intersection lane control signs, where solid lines displayed the 2 possible routes for traveling through the roundabout (one for each entering lane). | A solid black circle representing the central island was added to the left lane's route. | The text “Left Lane” and “Right Lane” were added under the corresponding routes, on the sign used in Countermeasure 1. |
| Directional Signs | A central island without any guide signs or special pavement marking guiding traffic circulating around the roundabout, as per MUTCD (2003) guidelines. | One Way (R-6-1) placed on central island, facing centerline of approaching roadway. | One Way (R-6-1) placed on central island, in front of driver's entry point (closer to driver's line of sight. |
| Yield Treatment | Standard R1-2 Yield sign placed on both sides of road at roundabout entrance, per MUTCD. | A Yield line consisting of solid white isosceles triangles was added to the base condition. | Yield line from countermeasure 1 plus supplemental signs below Yield sign “TO TRAFFIC IN CIRCLE.” |
| Exit Treatment | Street Name exit sign placed between two intersecting streets, prior to the exit. | Same street name exit sign in Baseline, but placed onto splitter island of intended street exit. | Arrow added to street name exit sign and placed as in Countermeasure 1 |
The evaluation was carried out using paired comparisons between the base condition and alternative 1; followed by comparisons between the base condition and alternative 2. Subjects were asked to rate the perceived change in terms of safety, comfort, and confidence. A 7-point Likert scale was used for the ratings, with the endpoints being significantly lower or higher (e.g., 1 = the alternative drive was significantly lower than the baseline, 7= the alternative drive was significantly higher than the baseline) and the midpoint of the scale (4) meaning no change. Study findings are described below for each of the design elements evaluated.
Based on the ratings of comfort, confidence, and safety, there was no significant difference between Countermeasures 1 and 2, but both were superior to the baseline. Participants' comment suggested that Countermeasure 2 would best meet their needs. Based on these findings, Lord et al. (2007) recommended the use of the roundabout advance warning sign, augmented with a symbol representing the center island, as shown in Figure 82.
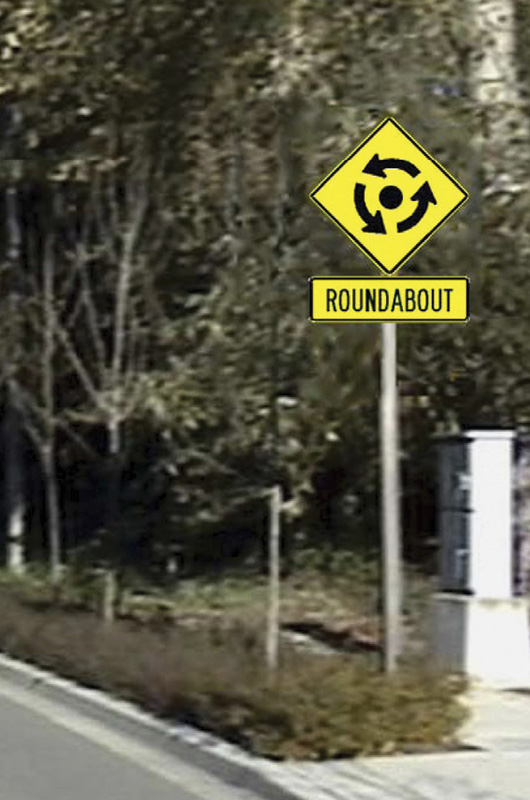
Figure 82. Roundabout Advance Warning Sign Recommended by Lord et al. (2007)
Lane Control Signs: Both countermeasures received higher ratings than the base, but Countermeasure #2 received significantly higher ratings. Based on the study findings, Lord et al. (2007) recommended the use of lane control signs designating the intended destinations for each lane (for multilane roundabouts), augmented with a black solid circle for the left lane's route representing the central island, augmented by text under each route, indicating "LEFT LANE" and "RIGHT LANE," as shown in Figure 83.
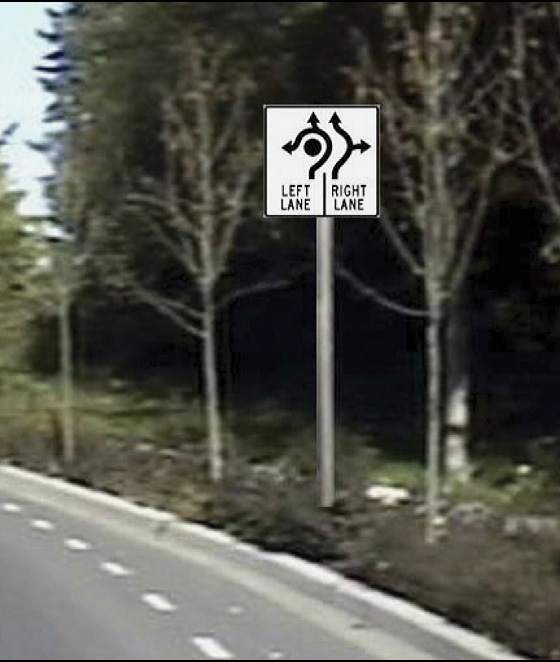
Figure 83. Lane Control Sign Recommended by Lord et al. (2007)
The use of a ONE WAY sign on the center island was associated with increased ratings over the baseline (no signs); there were no significant differences between the countermeasures, however, comments provided by study participants indicated placement to maximize the visibility of a driver just about to enter the roundabout is beneficial. Lord et al. (2007) recommended the use of a ONE WAY sign, shown in Figure 84, placed on the center island in direct view of a driver's entry point, rather than at the centerline of the approaching roadway.
Figure 84. Roundabout Sign Recommended by Lord et al. (2007)
Countermeasure 1 (inverted isosceles triangle pavement markings) did not improve participants' understanding of the yield treatment at the entrance of the roundabout; and some participants thought they were traveling in the wrong direction, given that the triangles were pointed toward the drivers entering. Countermeasure 2 (Yield sign with supplemental plaque "To Traffic in Circle") received significantly higher comfort ratings than the baseline condition. Based on their study findings, Lord et al. (2007) recommended that the supplemental panel bearing the legend "TO TRAFFIC IN CIRCLE" be placed immediately below the R1-2 Yield signs on both sides of the road at the entrance to a roundabout, as shown in Figure 85.
Figure 85. Yield Sign Treatment Recommended by Lord et al. (2007)
Countermeasure 1 did not significantly improve the perceived comfort, confidence, or safety relative to the baseline. The addition of the arrow on the street name sign pointing toward the exit leg showed significantly improved comfort, confidence, and safety over the baseline. Based on their study findings, Lord et al. (2007) recommended that the name of each intersecting leg on a roundabout be labeled with a sign panel placed on the splitter island for that intersection, facing toward approaching traffic in the roundabout, and that a directional arrow pointing toward the exit leg accompany the street name on the panel, as shown in Figure 86.
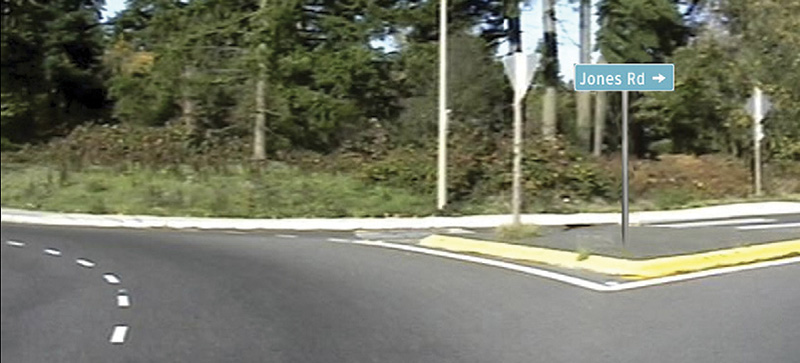
Figure 86. Exit Treatment Recommended by Lord et al. (2007)
As noted by Lord et al., (2007) the findings from the laboratory study should be confirmed through naturalistic field study observations prior to their adoption in Federal and State design manuals. This is particularly important for the lane use control signs and the exit signs evaluated, because misunderstandings about proper lane use, and placement of exit signs at the exit location may result in last-minute, erratic lane-change maneuvers, and crashes. For multilane approaches to roundabouts, signs should be designed to assure that drivers choose the proper lane for their destination before reaching the roundabout, and once in that lane, they should be able to circumnavigate the central roadway of the roundabout and exit to their destination without having to change lanes while in the circular roadway of the roundabout. To ensure that the signs recommended in the laboratory perform as intended, they should be tested in the field, and therefore, no recommendation for their implementation is made for this Handbook, and the study findings should be considered as preliminary.
At the same time, providing drivers with more detailed information about what to expect when they reach the roundabout should enhance the operational safety of roundabouts for aging drivers in particular, as well as the general population of drivers, without any unintended consequences. The advanced roundabout sign with the center island symbol advises drivers that traffic flows counterclockwise around an island. The educational plaque on the Yield sign "TO TRAFFIC IN CIRCLE" provides more detail about the right-of-way rules, advising entering drivers that they are the ones who must yield because circulating traffic has the right of way. The ONE WAY sign is a familiar regulatory sign and indicates that the required movement of entering traffic is to the right. Understanding these roundabout operational rules is paramount to avoiding wrong-way maneuvers (and their consequent head-on crashes), panic stops by circulating traffic trying to avoid crashing into a driver who does not yield at entry (resulting in rear-end crashes by following circulating drivers), and angle crashes between entering and circulating drivers when an entering driver fails to yield and an approaching driver does not take evasive action.
The enhanced advanced roundabout warning sign used by Lord et al. (2007) is a novel design, and care must be taken in determining the size of the center island symbol to ensure legibility of the sign. The visual task detail size of the central island symbol should be large enough for detection at a preview distance of at least 5 s, but not so large that it interferes with recognition of the circular intersection arrows. A dimension that satisfies these objectives may be analytically determined; though of course, field validation is desirable. Using principles evidenced in Standard Highway Signs (FHWA, 2004), to avoid legibility problems while affording detection for aging drivers at meaningful preview distances, the center island symbol should be centered on the sign and its diameter should range from 2.0 to 2.5 times the stroke width of the arrows.
Jacquemart (1998) lists several location types where it is appropriate to install roundabouts, based on a review of guidelines from abroad and those existing guidelines in the U.S. (e.g., Maryland and Florida). These locations include:
Ourston and Bared (1995) cited the work of Guichet (1992) who investigated 202 crashes at 179 urban roundabouts in France. The crash causes and relative frequencies are presented in Table 38.
| Cause of Crash | Percent of Crashes |
|---|---|
| Entering traffic failing to yield to circulating traffic | 36.6 |
| Loss of control inside the circulatory roadway | 16.3 |
| Loss of control at entries | 10.0 |
| Rear-end crashes at entries | 7.4 |
| Sideswipe, mostly at two-lane exits with cyclists (2 of 3 instances) | 5.9 |
| Running over pedestrians at marked crosswalks, mostly at two-lane entries | 5.9 |
| Pedestrians on the circulatory roadway | 3.5 |
| Loss of control at exits | 2.5 |
| Head-on collision at exits | 2.5 |
| Weaving inside the circulatory roadway | 2.5 |
Guichet (1992) listed the major design recommendations, based on the findings of the crash investigation:
Wallwork (1999) recommends that in areas where there is a high concentration of aging drivers, it is desirable to use the lower end of the speed range that he has determined for roundabouts in a particular roadway class. He states that a roundabout meets drivers' requirements for simple decision making, and low speed is paramount for safe roundabout operation. His design-speed recommendations by roadway class are presented in Table 39.
| Roadway Classification | Roundabout Design Speed (mph) |
|---|---|
| Local Road | 12-15 |
| Collector Road | 15-18 |
| Secondary Arterial | 18-21 |
| Major Arterial | 21-23 |
| Rural Roadway | Maximum 25 |
He states that the best way to control driver behavior is through the use of concrete: the roundabout has a concrete circle in the center, which defines a path to control speed, and a roundabout uses concrete islands to deter wrong-way movements and to control entry speeds. Roundabouts that are not designed for slow speeds result in high crash rates; there are at least two in the U.S. (Boulder, Colorado and Daytona Beach, Florida) that are being removed, because of poor design (e.g., no bulbouts for deflection on the entries allowing for 40-mph speeds).
Regarding public opinion about roundabout implementation, Taekratok (1998) indicates that people do not make a clear distinction between modern roundabouts and traffic circles, and therefore public responses to roundabout proposals are negative. Jacquemart (1998) presents copies of media coverage (Howard County Sun Newspaper) about the Lisbon, Maryland roundabout installed in Howard County as an experimental solution to an intersection with a high crash rate. One year before the roundabout opened, most of the Lisbon residents objected to the idea of a roundabout. Four months after the roundabout opened, a local citizen's committee voted overwhelmingly to make the roundabout permanent. Taekratok (1998) reports that the strategies taken by Florida, Maryland, and Vermont have been successful in improving public perception, and include public education through the use of brochures, videotapes, and mass media to provide information during the development stage. This will help the public to understand the differences between circles and roundabouts, and will gradually reduce opposition.
Redington (1997) notes that roundabouts are small (e.g., 91.8 to 180 ft) compared to the old time traffic circles found in New England and New Jersey (e.g., 249 ft or greater), and that drivers strongly dislike traffic circles with their typical operating speeds of 31 to 41 mph. While the Montpelier, VT, Keck Circle Roundabout was under construction, the Roundabout Demonstration Committee prepared educational materials that included a brochure providing safety rules for drivers and pedestrians, as well as news releases and public service announcements in response to negative public reaction during construction, and negative commentary from local morning radio personalities (Redington, 1997). This Committee also conducted a survey of 111 citizens working or living near the roundabout one year after its opening to measure public opinion. Of the 111 respondents, 104 had driven the roundabout, 89 had walked, and 19 had bicycled. "Very favorable" or "favorable" responses were obtained from 57.6 percent of the respondents, 27.9 percent of the responses were "neutral" and 14.4 percent were "unfavorable" or "very unfavorable." The survey contained two open-ended questions to allow respondents to contribute "likes," "dislikes," and comments about "what they miss about the old intersection." The 111 respondents contributed 214 comments. The majority of the 65 "like" comments pertained specifically to smoother and better traffic movement. Fifty-six comments were obtained from respondents who "dislike" the roundabout. The majority of these were directed toward poor driver behavior such as drivers failing to yield, failing to follow the rules, and failure to use turn signals.
Finally, Sarkar, Burden, and Wallwork (1999) reviewed driver's manuals for 32 States and the District of Columbia, and concluded that the information on traffic circle and roundabout use was inadequate. Only 10 of the States provided some instruction in their manuals about how to use the circles (i.e., entering drivers should yield to drivers who are already in the circle) and none provided information about how to use roundabouts. Information about types of signs placed near roundabouts and circles was not present, nor was there any explanation about the differences between circles and roundabouts. Only one State had an illustration of a circle, but in the authors' opinion, it was not clear or easy to understand. They recommend that State driver manuals be revised to include information about correct use of traffic circles and roundabouts, as roundabouts are becoming increasingly popular in the U.S.
Description of Practice: This practice reflects improved design of the corner island, turning lane width, and turning radii for channelized right turns to discourage high-speed turns while still accommodating large trucks and buses, and also facilitating pedestrians crossing the intersection. Specifically, the triangular corner island should have the "tail" pointing to approaching traffic. This will make the total pedestrian crossing distance of the intersection shorter, as the channelized right-turn is closer to the through lanes. In addition, the crossing of the channelized right-turn lane itself is shorter as pedestrians can cross at a right angle. This design has the additional advantage of the crosswalk being located in an area where the driver is still looking ahead; older designs place the crosswalk in a location where the driver is already looking left for a break in the traffic. The improved channelized right-turn lane design will place a sharper curve at the downstream end of the lane, which will force drivers to negotiate the lane more slowly; and by having the slip lane intersect the destination street at a larger angle, a driver will have better sight lines of approaching traffic on the destination street. Known implementations of this design include an intersection in Charlotte, NC, and several intersections in Florida and Texas.
Anticipated Benefits to Aging Road Users: Aging drivers, who as a group experience reduced head/neck mobility, should have a longer time in which to search for conflicts with through traffic before entering the destination street as the result of these design changes. They should also benefit from carrying out this search without dividing their attention to potential conflicts with pedestrians crossing to the corner island. Aging pedestrians, who as a group walk more slowly, should benefit from the shorter crossing distances afforded by this design. The safety of aging pedestrians—and all pedestrians—should also be enhanced to the extent that this design compels turning drivers to enter the turn lane at a lower speed, while permitting them to direct attention to the search for conflicts with pedestrians and conflicts with traffic in separate phases of the turning maneuver.
Description of Practice: Lane use signs indicate the turning movements that can be made from each approach lane of an intersection. This practice is now included in the 2009 MUTCD (the D15-1 sign). A green guide sign is placed over the lane with a street name, route shield, or destination in the top half, and a lane-use regulatory sign in the bottom half. The State of Iowa currently utilizes some examples of overhead lane use signs, though different than the D15-1 series sign found in the 2009 MUTCD. The Iowa signs are on a white background with a route shield and a down arrow pointing to the appropriate approach lane. New York State DOT utilizes examples similar to the 2009 MUTCD D15-1 series sign.
Anticipated Benefits to Aging Road Users: The benefits of advance street name signs described above may be amplified by this treatment, which not only provides identification of the receiving leg routes at an intersection but also path guidance for the approaching driver. A driver who is properly positioned for a downstream maneuver will experience reduced demands for divided attention as s/he nears the intersection. Posting the advance signing described in this treatment overhead increases the conspicuity of this guidance information; this is likely to have the greatest benefit for aging drivers who, as a group, do not execute visual search as efficiently as younger persons when concurrent task demands are high.
Description of Practice: Traffic signal heads are placed overhead, using one signal head per lane. Several states and municipalities have adopted this signal head placement as policy, including Iowa, Minnesota, Virginia, and the cities of Las Vegas, Nevada and Grand Rapids, Michigan routinely place signal heads centered over each lane. In Kansas City, Missouri, pedestal pole signals were converted to overhead mast arm installations.
Anticipated Benefits to Aging Road Users: Increasing the conspicuity of traffic control devices at intersections and reducing any ambiguity about the information they convey may be expected to have the greatest benefits for those with (age-related) visual and cognitive deficits. Physically separating the target stimulus from potentially distracting stimuli in the roadside environment should result in faster and more reliable visual detection, and this performance advantage for an overhead signal (especially with a backplate) compared to a pedestal mount should be disproportionately greater for aging drivers with a reduced ability to 'screen out" irrelevant stimuli (selective attention). Similarly, the reduction in decision time that should be realized from centering the signal over the approach lane will be of greatest benefit to aging drivers with reduced speed of processing who face the highest demand for "executive control" when negotiating an intersection.
Reductions in the overall number of crashes and right-angle crashes among drivers 65 and over have been observed in jurisdictions where overhead signals, centered over the approach lane have been introduced (in conjunction with the addition of an all-red clearance interval and/or increasing signal size from 8 to 12 inches).
Description of Practice: Crosswalk markings provide guidance for pedestrians crossing roadways by defining and delineating paths on approaches. These markings are used in conjunction with signs and other measures to alert road users to a designated pedestrian crossing point. Section 3B.18 of the 2009 MUTCD contains basic information about crosswalk markings; however, some States adopt their own supplement or manual on traffic control devices and some develop policies and practices for subjects not discussed in the MUTCD, so differences in markings occur among States, cities, and other jurisdictions. Some crosswalk markings are more effective than others at drawing attention to the crosswalk and the pedestrians who use it. The traditional set of transverse parallel lines define the boundaries of a crosswalk for the pedestrian, but they are not particularly visible to approaching drivers, especially in dark and/or wet conditions, compared to other marking patterns. More recent crosswalk marking patterns such as continental and bar pairs (see Figures 87 and 88) have shown better recognition among approaching drivers (Fitzpatrick, et al, 2010). Markings commonly called "ladder" crosswalks (see Figure 36) combine the transverse and continental to also increase visibility to approaching drivers.
Figure 87. Example of continental crosswalk markings
Figure 88. Example of bar pairs crosswalk markings
Anticipated Benefits to Aging Road Users: Crosswalk markings not only define a path for the pedestrian to cross the street, but they also call attention to the presence of the crosswalk for approaching drivers. High-visibility crosswalks are beneficial to all drivers, but as eyesight diminishes with age, the increased recognition quality of high-visibility crosswalks becomes even more useful for aging drivers to see and prepare for crossing pedestrians as they approach marked crosswalks.
Description of Practice: Pavement messages in advance of an intersection may be used to supplement critical warning sign messages, such as the stop ahead and yield ahead signs. Such markings are currently in use in many locations in the country, including Irvine, California and Williamston, Michigan. The use of these markings is permitted according to Section 3B.20 of the 2009 MUTCD.
Anticipated Benefits to Aging Road Users: As the result of normal aging, drivers may be at higher risk of failing to detect advance stop and yield warning signs posted at the side of the road due to loss of visual sensitivity in the periphery; a narrowing of the attentional (or "useful") field of view; or a reduced ability to engage in a search of the visual periphery when, for example, road or weather conditions increase demands for path guidance information. To the extent that aging drivers experience any of these limitations, they should derive an extra benefit from advance warning messages presented as pavement markings—if these markings are applied and maintained at contrast levels sufficient to ensure legibility to an "aging design driver."
Description of Practice: Within the last five years, interest in a set of intersection designs collectively called "innovative" or "alternative" has grown rapidly. These intersection designs use a combination of geometric design features and traffic control devices to mitigate congestion problems at at-grade intersections as an alternative to traditional signalized intersections or grade-separated interchanges. One of the common characteristics of these alternative designs is that they typically accommodate left-turns in unique ways, with the end result that left-turns at the intersection are greatly reduced, if not eliminated. Designs such as the displaced left-turn (DLT) intersection, median U-turn intersection (see Figure 89), and restricted-crossing U-turn (RCUT) intersection (see Figure 90) all have features that minimize the operational delay and potential for crashes due to left turns. More information on the specific design features and traffic control devices used at these intersections can be found in FHWA's Alternative Intersections/Interchanges: Informational Report (Hughes, et al. 2010).
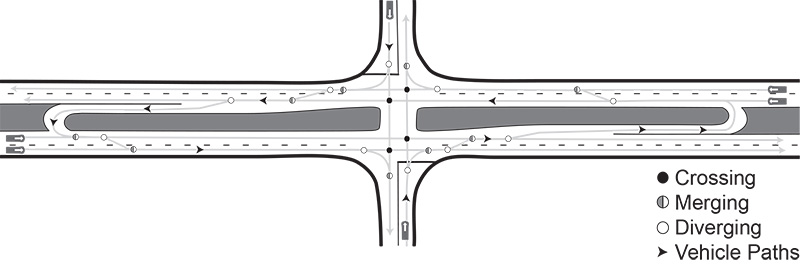
Figure 89. Diagram of Median U-Turn Intersection (Image Credit: Debbie Murillo, Texas A&M Transportation Institute)
Figure 90. Diagram of Restricted Crossing U-Turn Intersection (Image Credit: Debbie Murillo, Texas A&M Transportation Institute)
Anticipated Benefits to Aging Road Users: While modern roundabouts can be found in many parts of the country, these alternative intersections are more isolated and can present some challenges to drivers who have not seen them before, particularly aging drivers. These designs are the subject of a great deal of research at the current time, with studies investigating operational efficiencies and geometric design requirements. Specific benefits for aging drivers are a subject worthy of further exploration, but indications are that they can improve operations and safety for aging drivers as with the driving population as a whole.
As with roundabouts, alternative intersections may require additional outreach and educational efforts to help aging drivers understand what to expect when approaching them, as the geometric patterns of these alternative forms may appear to be complex designs; however, evaluation and observation show that users do find them easy to navigate. FHWA's Every Day Counts 2 initiative has listed "Intersections with Displaced Left-turns or Variations on U-turns" among the treatments for Intersection and Interchange Geometrics that state departments of transportation should consider to reduce conflicts and improve safety. Additional information on these designs and their respective features and benefits can be found at the Alternative Intersections website (www.alternativeintersections.org).
Description of Practice: A broad range of technologies can be classified as Accessible Pedestrian Signal (APS) treatments (Harkey, et al. 2009). One particular technology is that in which a controller can be programmed to provide extended pedestrian phase timing in response to an extended button press. In most advanced APS devices, these special features are actuated by pressing and holding the pedestrian pushbutton for an additional length of time (Noyce and Bentzen 2005).
Paragraph 2 of MUTCD Section 4E.13 states that if an extended pushbutton press is used to provide any additional feature(s), a pushbutton press of less than one second shall actuate only the pedestrian timing and any associated accessible walk indication, and a pushbutton press of one second or more shall actuate the pedestrian timing, any associated accessible walk indication, and any additional feature(s).
Paragraph 3 of Section 4E.13 states that if additional crossing time is provided by means of an extended pushbutton press, a PUSH BUTTON FOR 2 SECONDS FOR EXTRA CROSSING TIME (R10-32P) plaque (see Figure 91) shall be mounted adjacent to or integral with the pedestrian pushbutton.
Figure 91. Supplemental Plaque Used with Extended Crossing Time Feature for APS (MUTCD R10-32P)
Anticipated Benefits to Aging Road Users: With such a feature, the controller can regularly provide pedestrian timing that is the minimum permissible, while allotting additional crossing time when it is needed by pedestrians who move or react slowly or who do not use visible cues and thus wait to confirm audible or vibrotactile cues before starting a crossing.
Description of Practice: Another APS treatment is passive detection. Most commonly, this is used in the vicinity of the curb ramp to enable the WALK signal to be requested without the pedestrian needing to use a pushbutton. This feature is particularly useful where site constraints make it difficult for pedestrians with disabilities to approach the pushbutton. However, passive detection also can be used to detect pedestrians within the crosswalk that may need more time to complete their crossing maneuver. According to Harkey, et al. (2010), they were not aware of installations of passive detection in the United States that include audible signals as well as visual signals, but the combination of passive pedestrian detection and audible signals is being used in the United Kingdom, Australia, New Zealand, and the Netherlands. An example of passive pedestrian detection technology is the "Pedestrian User-Friendly Intelligent" (PUFFIN) crossing in use in England (Department of Transport, 2006). PUFFIN crossings employ pedestrian detectors for both the pedestrian waiting area and the crosswalk. Crosswalk detectors at PUFFIN facilities are used to vary the pedestrian clearance times between defined minimum and maximum times; when there are large numbers of pedestrians or if slow-moving pedestrians are crossing, the clearance time is extended to provide ample time for them to complete their crossing. Crosswalk detectors can be infrared or microwave detectors mounted on the signal pole or video cameras serving remote sensor software.
Anticipated Benefits to Aging Road Users: Like pushbutton-activated extensions, passive pedestrian detection treatments can help aging pedestrians register their call for a pedestrian phase and receive additional time to cross as needed.
Description of Practice: Research has been conducted over the previous decade to identify more effective means of indicating permissive (i.e., not protected) left-turn phases at signalized intersections, replacing the traditional circular green (i.e., "green ball") indication. One treatment that has shown promising results is the flashing yellow arrow (FYA). Brehmer, et al (2003) studied a variety of displays for protected/permissive left-turn control, and they found that drivers over the age of 65 had extremely low correct response rates with the permissive circular green indications, as many aging drivers assume right-of-way with circular green permissive left-turn indications. When the permissive circular green indication and the circular red through-movement indication were shown, less than 29 percent of aging drivers correctly responded. Meanwhile, drivers over the age of 65 had a higher correct response rate with flashing circular red indication and flashing yellow permissive indications than all other age groups. Overall, their research indicated an improved response rate for the flashing yellow arrow among users of all ages, as compared to the circular green. Noyce, Bergh, and Chapman (2007) similarly found that the installation of the FYA indication for permissive left-turns provided a safety improvement when added to existing protected/permissive left-turn signal phasing operations. The average annual frequency of total crashes was reduced at 12 of 13 study sites after implementation of the FYA indication, and the average annual frequency of left-turn crashes was reduced at all 13 study sites.
Anticipated Benefits to Aging Road Users: The improved recognition and understanding of the flashing yellow arrow increases the likelihood that all drivers, but particularly aging drivers, will wait for an appropriate gap in oncoming traffic before beginning a permissive left-turn maneuver, rather than incorrectly assuming that they have the right-of-way. This, in turn, results in a decrease in the likelihood of right-angle and other crashes (and associated injuries) that are particularly common among aging drivers making unprotected left turns.

