U.S. Department of Transportation
Federal Highway Administration
1200 New Jersey Avenue, SE
Washington, DC 20590
202-366-4000
The following discussion presents the rationale and supporting evidence for Handbook treatments pertaining to these ten proven and promising practices.
Proven Practices
Promising Practices
Pavement markings and delineation devices serve important path guidance functions on horizontal curves, particularly under adverse visibility conditions, at twilight, and at nighttime. They provide a preview of roadway features ahead and give the driver information about the vehicle's lateral position on the roadway. Delineation must provide information that results in recognition of the boundaries of the traveled way both at "long" preview distances (5 to 8 s of travel time) and at more immediate proximities (within 1 s of travel time) where attention is directed toward instant-to-instant vehicle control responses.
Surface pavement markings in current practice may vary along four dimensions: (1) brightness, (2) width, (3) thickness, and (4) the addition of structure to "thick" applications. Stripes of increased thickness have an advantage in wet weather because the material is more likely to protrude above the level of surface water and to provide a degree of retroreflectivity greater than that provided by thinner applications of paint. Also, the commercially available structured stripes (tapes) are brighter than other marking treatments, even under dry conditions. This is due to the ability of the raised element of the structure to reflect more light back to the driver than a horizontal surface. Even greater benefits are provided by raised retroreflectorized treatments, including raised pavement markers (RPM's), post-mounted delineators (PMD's), and chevron signs, which may be used to improve the nighttime visibility of delineation and to indicate roadway alignment.
| Applications in Standard Reference Manuals | |||
|---|---|---|---|
| MUTCD (2009) | AASHTO Green Book (2011) | NCHRP 500 – Volume 9 (2004) | Traffic Engineering Handbook (2009) |
| Sect. 1A.13, center line markings, delineator, edge line markings, object marker, raised pavement marker, & retroreflectivity Sects. 3A.05 & 3A.06 Sect. 3B.01, Items A & B Figs. 3B-4 Table 3B-1 Sect. 3B.04 Sect. 3B.06 Sect. 3B.11 Table 3D-1 Sects. 2C-63 & 2C-65 Fig. 3F-1 Sects. 3F.01 through 3F.04 Table 3F-1 Sect. 6F.77 |
Pg. 3-176, Paras. 1 & 3 Pg. 5-32, Sect. on Signing and Marking Pg. 7-43, Para. 5 Pgs. 3-91 through 3-97, Sect. 3.3.10 Traveled Way Widening on Horizontal Curves |
Pgs. V-22-V-23, Sect. on Strategy 3.1 B8: Improve Roadway Delineation (T) | Pgs. 358-359, Sect. on Warning Signs Pgs. 364-368, Sect. on Horizontal Alignment Warning Signs Pgs. 382-385, Sect. on Centerline and Edge Line Markings Pgs. 226-231, Sect. on Horizontal Alignment |
A number of driver visual functions that have an impact on the use of pavement markings and delineation show significant age-related decrements: dynamic acuity, contrast sensitivity, dark adaptation, and glare recovery. Dynamic visual acuity (DVA) includes the ability to resolve the details of a high-contrast target that is moving relative to an observer. Activities that rely on dynamic acuity include making lateral lane changes and locating road boundaries when negotiating a turn. In these situations, greater speeds are associated with poorer DVA. Contrast sensitivity influences the response to both sharply defined, bright-versus-dark visual targets, and those with grayer, less distinct edges. In general, aging adults tend to have decreased contrast sensitivity (Owsley, Sekuler, and Siemsen, 1983). This loss is more pronounced at lower light levels (Sloane, Owsley, and Alvarez, 1988; Sloane, Owsley, and Jackson, 1988) and is associated with a heightened sensitivity to glare (Wolf, 1960; Fisher and Christie, 1965; Pulling, et al, 1980). The findings of Blackwell and Blackwell (1971) indicate that a 60-year-old observer needs approximately 2.5 times the contrast as a 23-year-old observer for the same level of visibility.
Highway research studies that have varied one or more of the four dimensions of pavement markings are discussed below, along with studies on the effectiveness of RPM's, PMD's, chevron signs, and combinations of delineation treatments. Age differences are reported wherever data are available.
An early study of surface pavement markings, carried out with an interactive driving simulator plus field evaluations, concluded that driver performance—measured by the probability of exceeding lane limits—was optimized when the luminance (brightness) contrast between pavement markings and the roadway was 2.0 (Blackwell and Taylor, 1969). A study by Allen, O'Hanlon, and McRuer (1977) also concluded that delineation contrast should be maintained above a value of 2.0 for adequate steering performance under clear night driving conditions. In other words, these studies have asserted that markings must appear to be at least three times as bright as the road surface, because contrast is defined as the difference between target and background luminance, divided by the background luminance alone. A difficulty with these studies, however, is that their data were not derived from—and thus are not representative of—normatively aged drivers. The ideal viewing conditions assumed by Allen et al. (1977) also disregard the effects of glare as well as adverse visibility, and both factors have a disproportionate impact on the performance of aging drivers. In Blackwell and Taylor's work, a minimum preview time of 3 to 4 s was recommended for accurate maneuvering under adverse conditions. However, more conservative estimates of preview time to accommodate aging drivers (e.g., 5 s) have frequently appeared in the literature.
Freedman, et al. (1988) showed significant performance decrements for 65-year-old drivers, as compared with 35-year-old drivers, in the visibility distance of 4-in pavement stripes on a simulated wet roadway. Staplin, Lococo, and Sim (1990) confirmed the need for higher levels of line brightness for aging drivers in a simulator study, where the contrast for a 4-in white edge line was continuously varied within a 40-step range in a method of limits. Under simulated opposing headlamp glare conditions, subjects ages 65–80 required an increase in contrast of 20 to 30 percent over a younger sample to correctly discern downstream curve direction at criterion viewing distances. To accommodate less capable older drivers, this study's results indicated that a 300-percent increase in stripe brightness versus that required by younger drivers may be warranted.
To describe the magnitude of the effects of age and visual ability on delineation detection/recognition distance and retroreflective requirements for threshold detection of pavement markings, a series of analyses using the Ford Motor Company PC DETECT computer model (cf. Matle and Bhise, 1984) yielded the stripe contrast requirements shown earlier in this Handbook in Table 18 for Design Element 6 (Delineation of Edge Lines and Curbs) in the Rationale and Supporting Evidence section for Intersections. PC DETECT is a headlamp seeing-distance model that uses the Blackwell and Blackwell (1971, 1980) human contrast sensitivity formulations to calculate the distance at which various types of targets illuminated by headlamps first become visible to approaching drivers, with and without glare from opposing headlights. The top 5 percent (most capable) of 25-year-olds and bottom 5 percent (least capable) of 75-year-olds were compared in this analysis.
The more realistic operating conditions modeled as described above, together with the widely cited multiplier for aging observers advocated in the seminal work by Blackwell and Blackwell (1971), support the recommendation that an in-service pavement edge striping contrast value on horizontal curves maintained at or above 5.0 is appropriate to accommodate the needs of the large majority of aging drivers on highways and arterials without median separation between opposing directions of traffic. Where a median barrier (e.g., concrete safety shaped barrier) high enough to shield drivers from direct view of oncoming headlights is present, or where median width exceeds 49 ft, a horizontal curve edge line contrast value of 3.75 or higher is recommended. It is important to note that these recommendations are not limited to standard striping width (4 in). Where wider pavement markings are implemented, either as general or spot treatments, the same contrast values apply.
This leads logically to discussion of stripe width. This is one characteristic that has been advanced as a countermeasure to accommodate aging drivers, at least on roadways 22 ft or more in width. The use of wider stripes has been advocated both as a general treatment and as a spot treatment on curves. A survey of State highway agencies by Wright (1983) found that engineers believe that treatments such as chevrons, delineators, and warning signs are more effective than surface markings for spot improvements at curves. Deacon (1988), who has concluded that 8-in edge lines should be used instead of standard 4-in edge lines on two-lane rural highways, states that "… while this finding is not based on benefits to older drivers, older drivers will share—probably proportionally more—the safety benefits with others who travel these highways during periods of impaired visibility."
Relevant work in this area includes a report by Good and Baxter (1986) that 6-in edge lines result in more favorable driver control than 3-in edge lines for 'short range delineation," which was defined as that which is useful to the driver for tracking the roadway at night under poor visibility conditions. In addition to the assumption that a wider stripe will provide greater visibility distances and be more conspicuous to aging drivers, there is evidence from a study by Hughes, et al. (1989) that 8-in edge lines offer the potential for cost-effective application. This conclusion is based on the finding that for 8-in edge lines to be a cost-effective replacement for 4-in edge lines, crashes need to be reduced by only 0.7 percent when the daily traffic exceeds 1,000 vehicles.
However, while the use of a wide edge line is conceptually attractive for improving aging driver performance, the complete operational and safety benefits are not at all clear. For example, Hall (1987) reported that wide edge lines do not reduce the incidence of run-off-the-road (ROR) crashes, nor do they reduce the incidence of such crashes at night or on curves. A study by Cottrell (1988) also showed that the use of wide edge lines does not reduce the risk of crashes on curves or at night; still, he agrees that the use of wide edge lines only in the vicinity of curves, while retaining conventional edge lines on tangents, could be an effective spot improvement. Lum and Hughes (1990) have expressed concern over both the Cottrell and the Hall studies because the number of miles sampled was small. And finally, in a simulator study conducted to determine the most effective horizontal curve delineation treatments to accommodate aging drivers, Pietrucha, et al. (1996) found that although the recognition distance for a 8-in wide white edge line at in-service brightness level (ISBL) in combination with a standard yellow centerline produced longer recognition distance among the aging driver sample (mean recognition distance: 217.5 ft compared to a 4-in wide white edge line at ISBL in combination with a standard yellow centerline (mean recognition distance: 179.4 ft), the difference was not significant.
Thus, wider edge lines deserve consideration wherever practical, particularly as spot treatments on horizontal curves, to accommodate the difficulties aging drivers have with visibility at nighttime. And it may be inferred from these various studies of stripe width that markings that are maintained at or above the recommended contrast levels and are wider than the conventional 4-in (100-mm) treatment will provide the greatest benefit to aging drivers. What is important to remember is that contrast remains the preeminent factor in stripe visibility, and increased width alone does not substitute for lower-than-recommended contrast levels.
A current area of investigation which potentially could lead to the development of standards directly impacting stripe visibility is the measurement of the retroreflectivity of pavements and pavement markings. There is currently no pavement marking retroreflectivity requirement specified in design manuals, although the Roadway Delineation Practices Handbook (Migletz, Fish, and Graham, 1994) states that several separate studies have concluded that the value of approximately 100 millicandelas per lux per square meter (mcd/lux/m2) is the minimum value for the coefficient of reflected luminance (RL) for pavement markings. More common is the expression of delineation (pavement marking) retroreflectivity in millicandelas per square meter per lux, or the amount of reflected light per unit area of striping material, as a function of the incident illumination level. For present purposes, what is important is that, for a given amount of incident illumination (i.e., from a vehicle's headlight beam distribution) the ratio of mcd/m2/lux returned from the pavement marking to the mcd/m2/lux returned from the adjacent pavement surface generally describes the brightness of the treatment as viewed by an approaching motorist.
Graham, Harrold, and King (1996) conducted a field study at nighttime on public roadways to determine the minimum pavement marking retroreflectivity requirements to accommodate aging drivers. Thirty-six drivers ages 60 to 80, with a mean age of 71.3 years, and 29 drivers ages 20 to 59 rated the adequacy of 60-m long white and yellow stripes on tangent highway sections on clear, dry nights, under low-beam headlight illumination only. Using a 1980 model four-door sedan as the test vehicle, the retroreflectance values of the markings ranged from 28 to 301 mcd/m2/lux. In 12 of the 14 locations where the pavement markings measured 100 mcd/m2/lux or higher, they were rated as adequate or above by at least 85 percent of the subjects age 60 and older. Markings with retroreflectivity levels of 142 mcd/m2/lux or higher were rated as adequate or above by 95 percent or more of drivers age 60 and older. There was no significant effect of marking color, a result replicated by Schnell and Zwahlen (1996).
Graham, Harrold, and King (1996) also documented the effects of a dirty windshield and headlights on pavement marking visibility. They made measurements on a sample of in-service vehicles and found that for the 85th percentile vehicle, the light transmitted through a clean windshield was increased by 8 percent compared to an unclean windshield, and that cleaning the headlamps increases target luminance by 12 percent. Further, they note that vehicles in use from the mid-1990's have headlamp systems that may provide less reflected light from pavement markings than the headlight system on the 1980 test vehicle.
Next, Garvey, Gates, and Pietrucha (1997) addressed delineation as an area where engineering improvements could accommodate the needs of aging drivers. Their report indicates that the very best aging drivers will require 130 mcd/m2/lux, whereas the majority of the aging driver population will require 300 mcd/m2/lux. Jacobs, Hedblom, Bradshaw, Hodson, and Austin (1995) performed a field study of the visibility of a 4-in-wide by 10-ft-long isolated centerline located 12 ft from the right edge of the road, with approximately one-third of their subject sample between the ages of 50 and 60. Results were interpreted in relation to the visibility distance needed for a 5-s preview of road heading at varying speeds. It was found that a pavement marking retroreflectivity level of 100 mcd/m2/lux was able to provide the required visibility distance only at a speed of 15 mph. To achieve a 5-s preview distance (403.5 ft at 55 mph by the 50th percentile driver in this study—who was under 60 years old—required a stripe retroreflectance of 1,000 mcd/m2/lux. The vehicle used in the study was a 1993 model 4-door sedan.
The development of retroreflectivity requirements for pavement markings is complicated by the geometric relationships that must be taken into account—including entrance and observation angle specifications which are sensitive to driver eye height, headlight type and height, the longitudinal separation from the target marking and the driver/headlight lateral position in the travel lane—as well as the lack of data regarding the retroreflectivity of different types of pavement surfaces under wet and dry conditions and different degrees of wear. Perhaps the most rigorous work in this area to date has been reported by Zwahlen and Schnell (1998), who conducted studies to define the performance levels of markings required to provide a 62-year-old design driver with a preview time of 3.65 s. Finding no reliable data on the reflective properties of road surfaces under an automobile headlamp geometry (i.e., with observation angles less than 1 degree), the researchers conducted luminance and illuminance measurements for two bituminous/asphalt (worn and relatively new) and two concrete (worn and relatively new) roadway surfaces in the field. The results of the measurements indicated that the new asphalt road surface (RL=20 mcd/m2/lux) was substantially less reflective than the weathered, worn asphalt surface (RL=40 mcd/m2/lux). In comparison, the worn concrete road surface (RL=28 mcd/m2/lux) was considerably darker than the new concrete road surface (RL=55 mcd/m2/lux). Their matrix of readings for each pavement type as a function of entrance angle and observation angle were included in a subsystem of the CARVE (Computer Aided Road Marking Visibility Evaluator) model that was a key product of their research. Zwahlen and Schnell (1998) subsequently selected old asphalt as the road surface for a controlled field study of pavement marking visibility. They also selected an entrance angle of 88.7 degrees and an observation angle of 1.05 degrees to represent the vehicle/observer geometry of an "average large car driven by an average size adult."
The Zwahlen and Schnell (1998) controlled field study used younger and older drivers with near normal visual performance to quantify the visibility distance of pavement markings on fully marked two lane rural roads (white edge lines, dashed yellow centerline), to calibrate the CARVE computer model. The older driver group contained 5 males and 5 females with an average age of 68.3 years, and the younger driver group contained 5 males and 5 females with an average age of 23.2 years. The authors note that their use of only subjects with healthy vision suggests that the visibility distances obtained in the study are likely to be longer than what would be obtained with a larger sample that represented the U.S. driver population, including individuals with diminished visual capabilities. The study measured detection distances for 4-in- (100-mm-) wide pavement markings under low- and high-beam headlight illumination.
Based on the results of Zwahlen and Schnell (1998), the CARVE model was exercised to yield recommended retroreflectivity levels for white and yellow pavement markings under dry conditions, assuming a typical H6054 type vehicle headlamp. The 3.65-s preview time noted earlier was retained for roads with no raised treatments; when RPM's are used in addition to pavement markings, the authors revised the preview time downward to 2.0 s. The (white) edge line minimum required retroreflectivity (RL) values emerging from this effort are shown in Table 49.
| Vehicle Speed (km/h) | Vehicle Speed (mph) | Minimum Required RL (mcd/m2/lux) for White Edge line | |
|---|---|---|---|
| Without RPM's Preview Time = 3.65 s | With RPM's Preview time = 2.0 s | ||
| 0-40 | 0-25 | 30 | 30 |
| 41-56 | 26-35 | 50 | 30 |
| 57-72 | 36-45 | 85 | 30 |
| 73-88 | 46-55 | 170 | 35 |
| 89-104 | 56-65 | 340 | 50 |
| 105-120 | 66-75 | 620 | 70 |
The specification of RL values for pavement markings is likely to remain a difficult problem for some time, as indicated in the preceding discussion. It may also prove to be largely an academic issue. It is the effective contrast of a marking against the surrounding pavement area that a driver's visual system responds to, and which determines both (detection) performance and subjective comfort with the information provided by such treatments. While this index can be arrived at through complicated calculations based on the retroreflectivity levels of pavements and markings, it can also be done through a simple, direct measurement of stripe and pavement luminance under the observation conditions of interest (e.g., nighttime, low beam headlights, dry pavement) at any site where the need for restriping must be determined. Based on luminance meter readings of stripe luminance and pavement luminance, obtained at any practical distance, the dimensionless number denoting contrast level for the pavement marking can be calculated as described in Appendix B of this Handbook.
What deserves emphasis—aside from the fact that when one measures contrast, one is measuring what drivers actually see—is just how straightforward it is to obtain this information. An engineer or technician, with a single hand-held piece of equipment (luminance meter) can quickly obtain the measures needed for the contrast calculation, under any operating condition of interest (see Appendix B).
This discussion now turns to raised and reflectorized treatments. Raised pavement markers have received widespread use because they provide better long-range delineation than conventional pavement markings, particularly under wet conditions. When used on a road edge, they also provide brighter peripheral cues, which could be advantageous to the aging driver for path guidance. Over time, however, RPM's also are subject to loss of their initial retroreflectivity; in colder climates, RPM's may be damaged by plowing operations.
Deacon (1988), in his review of research on delineation and marking treatments that he believed would be of particular benefit to the aging driver, found that highways with RPM-enhanced centerlines had lower crash rates than those with painted centerlines only. The average reduction in crash rates was approximately 0.5 crash per million vehicle-miles. Zador, et al. (1986) observed that after-modification vehicle paths were shifted away from the centerline on right and left curves with RPM's mounted on both sides of the double yellow centerlines, and that placement changes were largest with RPM's compared with PMD's and chevrons. It has also been observed that RPM's placed in the centerlines and edge lines at pavement width reductions at narrow bridges produce significant reductions in 85th percentile speeds and centerline encroachments (Niessner, 1984). On two-lane rural curves, RPM's in conjunction with the double yellow centerline have been recommended.
An RPM spacing study was conducted by Blaauw (1985), who tested several RPM patterns on 656-ft radii and 3,281-ft radii horizontal curves using a visual occlusion technique. White RPM's were used for the tests, at spacing distances of approximately 40 ft, 80 ft, and 120 ft. On 656-ft radius curves, the 80-ft and 120-ft spacing led to speed reductions and lane errors. Based on these results, it was recommended that on curves of this severity, the spacing of RPM's be restricted to 40-ft spacing. In general, no differences between treatments were observed for the more gentle, 3,281-ft radius curves. Accordingly, this Handbook includes a recommendation for RPM installation, at standard (40-ft) spacing, on all horizontal curves with radii below 3,281 ft.
Roadside delineators and treatment combinations are also important to this discussion. Because of its increasing use throughout the United States, and because it accommodates different types of sheeting in varying amounts and different designs, the primary roadside delineation device of current interest is the flat, flexible post. The general crash data have shown that the installation of PMD's is associated with lower crash rates for highway sections with or without edge lines (Bali, et al., 1978; Schwab and Capelle, 1979). Deacon (1988) confirmed that installation of PMD's lowered crash rates, for sections with or without edge lines. The reduction in crash rates resulting from the installation of these delineators averaged 1.0 crash per million vehicle-miles. Thus, especially for lower functional classification roadways where the use of enhanced (e.g., wider) edge lines may be limited (due to pavement width restrictions), existing data suggest that PMD's can be an effective countermeasure.
In a driver performance study evaluating the effects of chevron signs, PMD's, and RPM's, both Johnston (1983) and Jennings (1984) found that driver performance on sharp curves was the most favorable when chevrons were used. With chevrons, drivers followed a better path around the curve (defined in terms of the ratio of the vehicle's instantaneous radius to the actual curve radius). These studies also revealed that drivers use a corner-cutting strategy, and that chevron signs and PMD's facilitated this strategy. On right curves with chevrons, drivers had an average midcurve placement closest to the centerline. On left curves with chevrons, vehicle placement was not significantly different. In the Good and Baxter (1986) study, chevron signs had a detrimental effect on control behavior, but were rated favorably by drivers in reducing task difficulty. Zador et al. (1986) found that chevrons (as well as RPM's) tend to shift vehicles away from the centerline on right and left curves, while PMD's shift vehicles away from the centerline on right curves. A particular advantage for chevrons with high intensity retroreflective sheeting was demonstrated for drivers age 65 and older in a study by Pietrucha, et al. (1996), when used in combination with other treatments.
The Pietrucha et al. (1996) study was specifically directed to the difficulties aging drivers have with horizontal curve delineation elements, and the possible benefits of brighter materials, larger target sizes, redundant and/or multidimensional cues using combinations of elements, and novel designs or configurations of elements. Twenty-five distinct delineation/pavement marking treatments (a baseline treatment and 24 enhancements) were initially presented to subjects in 3 driver age groups (18–45, 65–74, and 75 and older). The baseline treatment was a 4-in (100-mm) yellow centerline at in-service brightness level (ISBL). The 24 treatments varied according to the presence/absence of an edge line, edge line width, whether the edge line was enhanced with RPM's, whether the centerline was enhanced with RPM's, and the presence/absence of off-road elements and their characteristics (material, color, brightness, and/or spacing). Measures of effectiveness were downstream roadway feature recognition (subjects were required to report the direction in which the roadway curved) and recognition distance in a 35-mm simulation of nighttime driving. Treatments that included the addition of RPM's to both the centerline and edge line, and all treatments that included delineating the roadway edge with high intensity chevrons or high intensity PMD's, resulted in significantly longer mean recognition distances when compared with the baseline treatment, across all age groups. For the subjects age 65 and older, only a subset of the treatments with delineated roadway edges resulted in significantly longer mean recognition distances, due to the increased variance among older subjects' data. Next, field evaluations were conducted with a subset of the most promising treatments. The treatment with the longest recognition distance for both age groups consisted of a 4-in wide yellow centerline at ISBL with yellow RPM's at ISBL and standard spacing, a 4-in wide white edge line, and fully reflectorized T-post delineators with standard spacing. For the 500-ft radius of curvature used in this study, spacing for the PMD's was 65 ft. This treatment included PMD's that were fully retroreflectorized (i.e., retroreflective material extended from the top of the post to the ground and provided more retroreflective area than the standard posts most frequently used).
Blaauw (1985) tested combinations of PMD's and RPM's, resulting in the following recommendations: (1) RPM's exclusively at the center are favorable for lateral vehicle control inside the lane (short-range delineation) but are less adequate for preview information on the lane to be followed (long-range delineation); therefore, it is necessary to delineate both lane boundaries; (2) effective centerline delineation can be realized with RPM's; (3) delineation at the outside of the traffic lane can be realized with RPM's at the location of the lane boundary or with PMD's spaced laterally at 5 ft—both configurations are equally efficient, but PMD's at an approximate 12-ft spacing are less efficient; and (4) RPM's at the location of the center and/or lane boundaries must be applied with a maximum spacing distance of 40 ft on a curve with 656-ft radius or less.
In a laboratory study of drivers' responses to videotapes of four rural horizontal curves, six levels of delineation were studied by Nemeth, Rockwell, and Smith (1985). Seventy-eight drivers ages 18 to 63 participated. The levels of delineation included: no delineation; centerline only; centerline plus edge line; centerline plus edge line plus PMD's; centerline plus edge line plus RPM's; and centerline plus edge line plus PMD's plus RPM's. Subjects were required to identify precisely the instant that they could detect the presence of a curve (left or right) and then express their level of confidence with their response. The largest increase in detection distance was associated with the addition of RPM's and PMD's to the centerline and edge line treatments, respectively. While the treatment condition that included all delineators (PMD's and RPM's, in addition to the centerline and edge line) produced the greatest detection distance (an increase in 148 percent over centerline and edge line delineation only), the most significant change occurred with the addition of the RPM's to a road that initially had only the centerline and edge line (a 112 percent increase in detection distance over centerline and edge line only). The addition of PMD's to the centerline and edge line only condition resulted in an increase in detection distance of 58 percent.
While no specific roadside treatment on horizontal curves is advocated in this Handbook, a recommendation for roadside delineation devices at minimum spacing keyed to curve radius appears justified by the findings reported above. Using current practice as a guide, a spacing of 40 ft represents the median value in Table 3F-1 of the MUTCD, Approximate Spacing for Delineators on Horizontal Curves, for curves with radii from 50 to 500 ft. This value is also consistent with the 40-ft spacing requirement for RPM's on curves with radii 656 ft noted above.
Finally, as noted by Puvanachandran (1995), vehicle speed upon curve entry is a function of vehicle speed at the approach to the curve, and is not necessarily related to the sharpness of the curve. This underscores the importance of efforts to reduce traffic speeds on the tangent sections preceding the points of curvature. In an IIHS-sponsored study, Retting and Farmer (1998) evaluated the effectiveness of an experimental pavement marking message in reducing excessive traffic speeds at rural and suburban two-lane roadway locations with sharp horizontal curvatures. The experimental text/symbol message employed in this study consisted of the word "SLOW" in 8-ft high white retroreflective letters, a 8-ft long white retroreflective left curve arrow, and a 18-in wide white retroreflective line perpendicular to the centerline of the road at both the beginning and end of the message. This message was placed 220 ft in advance of a 90-degree curve. Traffic speeds were measured at this site on the tangent section at two points: 650 ft and 90 ft prior to the point of curvature, both before and after application of the markings. Speeds were also measured at a control site located on the same roadway in the opposite direction of travel that contained a 45-degree left curve. Data were collected on Saturdays beginning at 10:30 a.m., and ending Sundays at 3:00 a.m., allowing for analysis of daytime (10:30 a.m. to 5:00 p.m.), evening (5:00 p.m. to midnight), and late night (midnight to 3:00 a.m.) traffic speeds. All measurement periods were free from precipitation. Data were analyzed for approximately 800 passenger cars at each location; driver age was not a variable in this study.
The experimental message was associated with a significant decrease in mean speed under daytime, evening, and late-night conditions, and a significant decrease in the percentage of drivers exceeding 40 mph under the daytime and late-night conditions, compared to the upstream and control sites. During the daytime, the mean speeds at the experimental site dropped from 34.3 to 33.2 mph, while the speeds at the upstream site increased from 40.2 to 41.7 mph, and the speeds at the control site increased from 39.6 mph to 41.1 mph. The percentage of drivers exceeding 64 decreased from 9.1 percent to 3.5 percent at the experimental site, but increased from 54 to 66 percent at the upstream site, and from 47 to 62 percent at the control site. During the late-night period, the mean traffic speed decreased from 35.1 to 31.7 mph at the experimental site, and the percentage of drivers exceeding 40 mph decreased from 18.5 to 1.6 percent. This 10 percent decrease in speed was significantly different from the 3 percent decrease in speed measured at the upstream site. Retting and Farmer (1998) state that these average traffic speed reductions, and the reductions in the proportion of high traffic speeds associated with the experimental markings are highly significant; given the exponential relationship between fatality risk and change in velocity during collisions, even seemingly small reductions in mean traffic speeds are likely to result in significant safety benefits. The benefits of this experimental treatment to enhance the safety of aging drivers are unknown at this time, and therefore, no treatment has been included in this Handbook. However, based on the factors that contribute to run-of-the-road, head-on, and rollover collisions on curves (e.g., driver impairment, fatigue, attention, visual deficits, and excessive vehicle speed), it may be expected that such advance information would disproportionately benefit aging drivers with age-related diminished visual and attentional capabilities.
Roadway alignment is a key factor in unsafe vehicular operation: i.e., increasing degrees of curvature cause more crashes (Haywood, 1980). The widening of lanes through horizontal curves, minimizing the use of controlling or maximum curvature for a given design speed, and the use of special transition curves for higher speed and sharper curve designs have all been suggested as countermeasures. Whereas in the past lane widening has been advocated to accommodate the tracking of large trucks through curves, the present focus is on the accommodation of aging drivers, whose diminished physical and perceptual abilities make curve negotiation more difficult. Lane widths on horizontal curves range from 9 ft to 13 ft, but are usually 11-ft or 12-ft wide. Neuman (1992) recommended that when less than 12-ft wide lanes are used, consideration should be given to widening the lane to this dimension through horizontal curves; and a further increase in width of 1–2 ft may be advised to provide for an additional margin of safety through the curve for heavy vehicles. This margin of safety could also be justified in terms of its benefit to aging drivers with diminished physical abilities.
Aging drivers, as a result of age-related declines in motor ability, have been found to be deficient in coordinating the control movements involved in lanekeeping, maintaining speed, and handling curves (Brainin, Bloom, Breedlove, and Edwards, 1977). McKnight and Stewart (1990) also reported that aging drivers have difficulty in lanekeeping, which results in frequently exceeding lane boundaries, particularly on curves. Drivers who lack the required strength, including aging drivers and physically limited drivers, often swing too wide in order to lengthen the turning radius and minimize rotation of the steering wheel.
Joint flexibility is an essential component of driving skill. Osteoarthritis, the most common musculoskeletal disability among aging individuals, affects more than 50 percent of the population age 65 and older (Roberts and Roberts, 1993). If upper extremity range of movement is impaired in the aging driver, mobility and coordination are seriously weakened. Aging drivers with some upper extremity dysfunction may not be able to steer effectively with both hands gripping the steering wheel rim. In a study of 83 people with arthritis, 7 percent used only the right hand to steer and 10 percent used only the left and (Cornwell, 1987).
The general relationship between pavement width and safe driving operations has been well documented. Choueiri and Lamm (1987) reported the results of several early studies that found an association between decreasing crash frequency and increasing pavement widths. Krebs and Kloeckner (1977) reported that for every 3.3-ft increase in pavement width, a decrease of 0.25 crash per million vehicle-kilometers could be expected. Hall, et al. (1976) examined the nature of single-vehicle crashes involving fixed objects along the roadside of non-freeway facilities. They found that the majority of these types of crashes were reported as non-intersection-related, and occurred most frequently on weekends, at night, under adverse pavement and weather conditions, and on horizontal curves (especially outside of curve). These crash types have high injury severity to drivers and passengers. Wright and Robertson (1979) reported that 40 and 31 percent of all fatal crashes in Pennsylvania and Maryland, respectively, resulted in a vehicle hitting a fixed object such as a tree, utility pole, or bridge abutment. In a study focused on 600 crash sites (and 600 comparison sites) involving fixed objects, crash locations were best discriminated from comparison locations by a combination of curvature greater than 9 degrees (radius: 637 ft) and downhill gradient steeper than 3 percent; and, for the fatal fixed-object crash population, the crash locations were best discriminated from comparison locations by a combination of curvature greater than 6 degrees (radius: 955 ft) and downhill gradient steeper than 2 percent.
Glennon and Weaver (1971) evaluated the adequacy of geometric design standards for highway curves by filming vehicles entering unspiraled highway curves with curvature ranging from 2 to 7 degrees (radius: 2,865 to 819 ft). While driver age was not analyzed, results of the study indicated that most vehicle paths, regardless of speed, exceed the degree of highway curve at some point on the curve. Glennon, Neuman, and Leisch (1985) measured vehicle speed and lateral placement on horizontal curves and found that drivers tend to overshoot the curve radius, producing minimum vehicle path radii sharper than the highway curve, and that the tendency to overshoot is independent of speed. They observed that the tangent alignment immediately in advance of the curve is the critical region of operations, because at about 200 ft before the beginning points of the curve (or approximately 3 s driving time), drivers begin to adjust both their speed and path. Such adjustments are particularly large on sharper curves. Thus, the margin of safety in current AASHTO design policy is much lower than anticipated.
Zegeer, Stewart, Reinfurt, Council, Neuman, Hamilton, Miller, and Hunter (1990) conducted a study to determine the horizontal curve features that affect crash experience on two-lane rural roads and to evaluate geometric improvements for safety upgrading. An analysis of 104 fatal and 104 nonfatal crashes on rural curves in North Carolina showed that in more of the fatal crashes, the first maneuver was toward the outside of the curve (77 percent of the fatal crashes versus 64 percent of the nonfatal crashes). For approximately 28 percent of the fatal crashes (versus 8.8 percent of the nonfatal crashes), the vehicle ran off the road to the right and then returned to be involved in a crash. Further, an analysis on 10,900 horizontal curves in the State of Washington with corresponding crash, geometric, traffic, and roadway data variables showed that the percentages of severe nonfatal injuries and fatalities were greater on curves than on tangents with the same width, where total road width (lanes plus shoulders) was 30 ft.
Zegeer et al. (1990) concluded that widening lanes or shoulders on curves can reduce curve crashes by as much as 33 percent. Specifically, Table 50 shows the predicted percent reduction in crashes that would be expected on horizontal curves by widening the lanes and by widening paved and unpaved shoulders (Zegeer et al., 1990).
| Total Amount of Lane or Shoulder Widening (ft) | Percent Crash Reduction | |||
|---|---|---|---|---|
| Total | Per Side | Lane Widening* | Paved Shoulder Widening | Unpaved Shoulder Widening |
| 2 | 1 | 5 | 4 | 3 |
| 4 | 2 | 12 | 8 | 7 |
| 6 | 3 | 17 | 12 | 10 |
| 8 | 4 | 21 | 15 | 13 |
| 10 | 5 | * | 19 | 16 |
| 12 | 6 | * | 21 | 18 |
| 14 | 7 | * | 25 | 21 |
| 16 | 8 | * | 28 | 24 |
| 18 | 9 | * | 31 | 26 |
| 20 | 10 | * | 33 | 29 |
*Values of lane widening correspond to a maximum widening of 8 ft to 12 ft for a total of 4 ft per lane, or a total of 8 ft of widening.
The evidence cited above from the engineering studies describing curve negotiation, pavement width, and crash reduction, together with the documented difficulties in lane keeping and diminished motor abilities of aging drivers, support the recommendation for a minimum pavement width (including shoulder) of 18 ft on arterial horizontal curves over 3 degrees of curvature (radius: 1,910 ft), (cf. Cirillo and Council, 1986). It is understood that limited-access highways already exceed this recommended lane-plus-shoulder width. However, aging drivers often report a preference to travel on two-lane arterials, and these facilities may be deficient in this regard, especially in rural settings.
From a human factors perspective, the accommodation of aging driver needs should be a high priority at sight-restricted locations because of the potential for violation of expectancy, even though the actual percentage of crashes occurring under conditions of limited (vertical) sight distance is quite small (Pline, 1996). Aging drivers, as a result of their length of experience, develop strong expectations about where and when they will encounter roadway hazards and "high-demand" situations with increased potential for conflict. At the same time, aging driver reaction time is slower in response to unexpected information, and aging drivers are slower to override an initial incorrect response with the correct response. Further, aging is associated with physical changes that may interfere with rapid vehicle control when an emergency maneuver is required.
Of greatest importance during the approach to sight-restricted locations are the cognitive components of driving, most notably selective attention and response speed (complex reaction time). Selective attention refers to the ability to identify and allocate attention appropriately to the most relevant targets at any given time (Plude and Hoyer, 1985). One important finding in the selective attention literature, as noted above, is that aging adults respond much more slowly to stimuli that are unexpected (Hoyer and Familant, 1987), suggesting that aging adults might be particularly disadvantaged when an unexpected hazard appears in the road ahead. In fact, Stansifer and Castellan (1977) suggested that hazard recognition errors can be interpreted more as attention failures than as sensory deficiencies. The selective attention literature suggests that for adults of all ages, but particularly for aging people, the most relevant information should be signaled in a dramatic manner to ensure that it receives a high priority for processing.
| Applications in Standard Reference Manuals | |||
|---|---|---|---|
| MUTCD (2009) | AASHTO Green Book (2011) | NCHRP 500 – Volume 9 (2004) | Traffic Engineering Handbook (2009) |
| Tables 2C-1 through 2C-5 Sects. 2B.28, 2C.05, 2C.36, 2C.45, & 2C.55 Sect. 5C.04 |
Pg. 2-40, Paras. 1 & 2 Pgs. 3-1 through 3-8, Sects. 3.2.1 through 3.2.3 General Considerations, Stopping Sight Distance, and Decision Sight Distance Pg. 3-15, Sects. on Stopping Sight Distance Object & Passing Sight Distance Object Pgs. 3-149 through 3-164, Sect. 3.4.6 Vertical Curves Pg. 3-175, Final Paragraph Pgs. 421-423, Sect. on Sight Distance Pg. 445, Sects. on Sight Distance & Alignment Pg. 458, Para. 3 Pg. 678, Sect. on Vertical Control |
Pgs. V-8-V-11, Sect. on Strategy 3.1 B1: Provide Advance Warning Sings (T) | Pgs. 231-235, Sect. on Vertical Alignment |
Next, appropriate vehicle control behaviors when unexpected hazards are encountered depend upon 'speeded responding," or how quickly an individual is able to respond to a relevant target, once identified. A timely braking response when one recognizes that the car ahead is stopped or that a red signal or STOP sign is present can determine whether or not there is a crash. Thus, reaction time or the ability to respond quickly to a stimulus is a critical aspect of successful driving. Mihal and Barrett (1976) measured simple, choice, and complex reaction time and reported that simple and choice reaction time were not correlated with crashes, but complex reaction time was. Moreover, when only aging adults were examined, the correlation with crash involvement increased from 0.27 for complex reaction for the total sample to 0.52, suggesting the relationship to be particularly marked for aging adults. There is nearly uniform agreement among researchers that reaction time increases with age. In particular, studies have demonstrated a significant and disproportionate slowing of response for aging adults versus young and middle-aged adults as uncertainty level increased for response preparation tasks. Preparatory intervals and length of precue viewing times appear to be crucial determinants of age-related differences in movement preparation and planning (Eisdorfer, 1975; Stelmach, Goggin, and Garcia-Colera, 1987; Goggin, Stelmach, and Amrhein, 1989).
In summary, the age-related deficits in reaction time and various aspects of attention are not independent of one another, and more than one of these mechanisms is likely to reduce driving efficiency in the aging adult. Because of these deficits, sight-restricted locations pose a particular risk to aging drivers, presenting a need for treatments addressing both geometry and signing that can be reconciled with available highway research findings in this area.
Unfortunately, there is a lack of conclusive data on this subject. Kostyniuk and Cleveland (1986) analyzed the crash histories of 10 matched pairs of sites on 2-lane rural roadways. The 10 limited sight distance (vertical curve) locations were defined as those below the minimum stopping sight distance (SSD) recommended by AASHTO in 1965, and ranged from 118 ft to 308 ft. The control site locations were defined as those that more than met the standard (SSD greater than 700 ft). Seven of the limited sight distance sites had more crashes than the matched control sites, two were approximately equal, and one had fewer crashes (Pline, 1996). Overall, the set of sites with less than minimum SSD had over 50 percent more crashes in the study period than the control sites.
Farber (1982) performed sensitivity analyses of the effects of change in eye height, object height, friction, and speed on SSD on crest vertical curves. He found that SSD was relatively insensitive to a reasonable range of changes in driver eye height, but was very sensitive to speed, friction, and reaction time. Thus, stopping distance on vertical curves that are of inadequate length or are substandard according to other design criteria, and where major redesign, repaving, or excavation is not feasible, could most efficiently be made safer by modifying a driver's approach speed and/or reaction time. For 55 mph traffic, stopping distance increases 81 ft for every 1-s increase in reaction time. Similarly, stopping distance decreases about 26 ft for each 1 mph reduction in speed. A need for more effective traffic control countermeasures is thus highlighted.
A reevaluation of crest vertical curve length requirements was performed by Khasnabis and Tad (1983). These researchers reviewed the historical changes in parameters that affect the computation of SSD and evaluated the effect of these changes on the length requirements of crest vertical curves. Principal conclusions were that further tests on reaction time are needed to more accurately reflect the changing age distribution and composition of the driving population. In addition, the validity of the assumption of a speed differential for wet pavement conditions between design speed and top driving speed is questionable, since there is very little evidence to substantiate the assumption that all motorists are likely to reduce their speed on wet pavements. Of particular interest, Khasnabis and Tad (1983) noted that the object height of 6 in appears to be somewhat arbitrary, and stated that reducing the object height to 3 in would improve the safety elements of crest curves.
In contrast, there are strong proponents of the position that the obstacle height criterion for design of vertical curves should be raised to 18 in, or the approximate height of a passenger vehicle's rear taillights (see Neuman, 1989). Fambro, Fitzpatrick, and Koppa (1997) evaluated the 1994 AASHTO stopping sight distance model during the conduct of NCHRP project 4-42, and recommended that the object height be raised to 24 in (600 mm) in future revisions to the Green Book. This treatment was adopted and reflects the height in the current Green Book (2011). The rationale provided by Fambro et al. (1997) includes the following points:
Crashes involving small objects are extremely rare events and almost never result in injuries to vehicle occupants.
Small objects are beyond most drivers' visual capabilities at the stopping sight distances required for most rural highways, and especially at night.
Large animals (e.g., cattle, deer) and other vehicles are more realistic and more frequent hazards to drivers, and from a potential hazard standpoint, the critical object for stopping sight distance should be the smallest visible object during the day and at night that represents a hazard to the driver.
Approximately 95 percent of the taillight heights and 90 percent of the headlight heights exceed 600 mm, and therefore, 600 mm is recommended as the appropriate object height for determining required stopping sight distances except in those locations where the probability of rocks or other debris in the roadway is high. In these locations, a shorter object is appropriate.
While McGee (1995) has reported that available data are insufficient to definitively establish the relationship between (limitations in) vertical alignment and highway safety, and on the surface it sounds reasonable to use a height criterion corresponding to the most commonly encountered obstacle on the road (i.e., another vehicle), this approach disproportionately penalizes aging drivers in those rare circumstances when a hazard (of any type) appears unexpectedly due to sight-restricting geometry. Also, the simple argument that a conclusive relationship cannot be demonstrated as justification for changing current practice is somewhat disingenuous—a significant relationship between visual acuity and crash involvement has proven elusive, over decades of study, yet there is widespread acknowledgment that good vision is necessary for safe driving.
In consideration of potential countermeasures, since stopping distance is sensitive to decreases in speed and reaction time any traffic control device that lowers either parameter is beneficial. In one study, a LIMITED SIGHT DISTANCE sign (W14-4 in the 1988 MUTCD) with a speed advisory was found to be understood by only 17 percent of the 631 respondents who passed through the study sight (Christian, Barnack, and Karoly, 1981). Part of the problem may be that unlike the hazards cited by other warning signs, the phrase "limited sight distance" has no tangible manifestation, and even when drivers have topped the crest of a vertical curve, they may not be aware of the extent to which their sight distance was reduced. Freedman, Staplin, Decina, and Farber (1984) developed and tested the effectiveness of both word and symbol alternative warning devices for use on crest vertical curves using drivers ages 16 to 75. The existing LIMITED SIGHT DISTANCE sign, with or without a supplementary speed advisory panel, did not produce desirable driver responses (braking or slowing) as frequently, nor was it recalled, comprehended, recognized, or preferred as often as the alternatively worded SLOW HILL BLOCKS VIEW sign, or an alternative symbol sign that depicted two vehicles approaching from opposite sides of a hill.
The MUTCD 2009 states that the HILL sign (W7-1 or W7-1a) is intended for use in advance of a downgrade where the length, percent of grade, horizontal curvature, or other physical features require special precautions on the part of road users. While the LIMITED SIGHT DISTANCE sign is not included in the 2009 MUTCD, practitioners are aware of the need to alert drivers of sight restrictions due to vertical curvature, and continue to use the LIMITED SIGHT DISTANCE sign in many jurisdictions. Since the SLOW HILL BLOCKS VIEW sign is explicit in telling drivers what they should do and why they should do it, its use is recommended over both the LIMITED SIGHT DISTANCE sign and the HILL sign. The HILL BLOCKS VIEW sign (W7-6) is included in the 2009 MUTCD, and the guidance associated with its use states that it should be supplemented by an Advisory Speed (W13-1P) plaque indicating the recommended speed for traveling over the hillcrest based on available stopping sight distance.
Next, several studies have shown that the use of active sign elements, such as flashing warning lights for SLOW WHEN FLASHING and MAX SPEED ___ MPH messages supplementing various standard warning signs, increases the conspicuity of the signs and results in greater speed reductions (Zegeer, 1975; Hanscom, 1976; Lanman, Lum, and Lyles, 1979; Lyles, 1981) as well as a 60 to 70 percent reduction of crashes at grade crossings compared with the static sign alone conditions (Hopkins and Holmstrom, 1976; Hopkins and White, 1977). According to Pline (1996), several agencies have experienced success with the use of flasher-augmented warning signs with the legend PREPARE TO STOP when there is limited sight distance to a signalized intersection, activated at the time of signal change (red phase).
Lyles (1980) compared the effects of warning signs at horizontal and crest vertical curves with limited sight distance (less than 500 ft). Five warning devices were evaluated:
Overall, the standard crossroads and VEHICLES ENTERING signs had less speed-reducing effect (0.5–2 mph) than the warning-warning-regulatory sequence and the signs with warning lights (4–5 mph). This trend was the same for both horizontal and vertical curves, and there was no significant difference between the warning-warning-regulatory sequence and the signs with warning lights. Motorists were twice as likely to recall the warning-warning-regulatory sequence and signs with warning lights than the standard signs. A van positioned at the crossroad was also reported to have been seen more often with these sign configurations.
If the combination of advance warning messages—in particular, PREPARE TO STOP—and flashers appears to offer the greatest benefit, the activation of the flashers on the red phase only may be problematic. Drivers may associate the absence of flashers to signify an "all clear" condition, when a queue remains from the prior red phase. On the other hand, continuously activated flashers would provide no information about the status of the upcoming signal or traffic conditions (queue) resulting from a red signal, and could therefore breed disregard for the sign, because it carries false information. Therefore, the present treatment is to augment the sign panel with advance warning flashers (AWF) that are activated by the traffic signal controller prior to the onset of the yellow phase, and flash until the signal turns green, long enough for the expected queue to dissipate.
As reviewed above, there is ample reason for concern that at highway approach speeds, a safe response by aging drivers to a revealed obstacle at a crest vertical curve will be problematical. There is evidence of significant age-related decline in the capability to respond to unexpected hazards, specifically in the information processing requirements that precede a brake or steering action (object detection, recognition, and decision to respond). However, while analyses of curve length and sight distance requirements conclude that safety benefits will result from a lower object height criterion, crash data analyses have prompted a move in the opposite direction, toward a more liberal criterion. In fact, current standards (AASHTO, 2011) assume an obstacle height of 2.0 ft, in contrast to the previous value of only 6 in. At the same time, controlled braking rather than locked-wheel braking is assumed, which carries significance because stopping sight distance reflects not only a driver's perception-reaction time (PRT) but also the assumed deceleration rate for a given design speed. With the widely recognized interrelationship between these parameters, and the stance reflected in the AASHTO 2011 design standards, the remaining variable—the driver's PRT—accordingly is the subject of the initial treatment regarding vertical curves: at a minimum, a PRT value of 2.5 s should be used in the design of these roadway features. In addition, conspicuous and comprehensible warning devices should be especially beneficial to aging drivers in sight-restricted situations.
The safety and effectiveness of passing zones depend upon the specific geometric characteristics of the highway section, as well as on how drivers receive and process information provided by signs and pavement markings, integrate speed and distance information for opposing vehicles, and control their vehicles (brake and accelerate) during passing maneuvers. As the number of aging drivers in the population increases dramatically over the years 1995–2025, many situations are expected to arise where not only the slower-moving vehicle, but also the passing vehicle, is driven by an aging person.
The capabilities and behavior of aging drivers, in fact, vary with respect to younger drivers in several ways crucial to this discussion. Studies have shown that while driving speed decreases with driver age, the sizes of acceptable headways and gaps tend to increase with age. While motivational factors (e.g., sensation seeking, risk taking) have been shown to play a major role in influencing the higher speeds and shorter headways accepted by young drivers, they seem to play a less important role in aging driver behavior. Instead, the relatively slower speeds and longer headways and gaps accepted by aging drivers have been attributed to their compensating for decrements in cognitive and sensory abilities (Case, Hulbert, and Beers, 1970; Planek and Overend, 1973).
The ability to judge gaps when passing in an oncoming lane is especially important. For some aging drivers, the ability to judge gaps in relation to vehicle speed and distance is diminished (McKnight and Stewart, 1990). Depth perception—i.e., the ability to judge the distance, and changes in distance, of an object—decreases with age (Bell, Wolfe, and Bernholtz, 1972; Henderson and Burg, 1973, 1974; Shinar and Eberhard, 1976).
| Applications in Standard Reference Manuals | ||
|---|---|---|
| MUTCD (2009) | AASHTO Green Book (2011) | Traffic Engineering Handbook (2009) |
| Table 2B-1 Sects. 2B.28 & 2B.29 Tables 2C-1 through 2C-5 Sects. 2C.07 & 2C.45 Sect. 3B.02 |
Pg. 2-38, Para. 1 Pgs. 3-8 through 3-14, Sect. 3.2.4 Passing Sight Distance for Two-Lane Highways Pgs. 3-110 through 3-111, Sect. on Passing Sight Distance Pgs. 3-132 through 3-140, Sect. 3.4.4 Methods for Increasing Passing Opportunities on Two-Lane Roads Pgs. 3-156 through 3-157, Sect. on Design controls: passing sight distance Pg. 5-29, Sect. on Passing Sight Distance Pgs. 6-4 through 6-5, Sect. on Sight Distance Pg. 7-3, Sects. on Sight Distance & Alignment Pgs. 7-7 through 7-8, Sect. 7.2.8 Provision for Passing Pgs. 7-16, Sect. on Climbing Lanes on Multilane Arterials |
Pgs. 384-385, Sect. on No-Passing-Zone Markings Pgs. 618-619, Sect. on No-Passing Zones Pgs. 224-225, Sect. on Passing Sight Distance (PSD) |
One study found that the angle of stereopsis (seconds of visual arc) required for a group of drivers age 75 and older to discriminate depth using a commercial vision tester was roughly twice as large as that needed for a group of drivers ages 18 to 55 to achieve the same level of performance (Staplin, Lococo, and Sim, 1993). McKnight and Stewart (1990) reported that the inability to judge gaps is not necessarily associated with a high crash rate, to the extent that drivers can compensate for their deficiencies by accepting only inordinately large gaps. This tactic has a negative impact on operations as traffic volumes increase, however, and may not always be a feasible approach.
Judging in-depth motion is made difficult by the fact that when no lateral displacement occurs, the primary depth cue is the expansion or contraction of the image size of the oncoming vehicles (Hills, 1980). Studies of crossing-path crashes, where gap judgments of oncoming vehicle speed and distance are critical as in passing situations, indicate an age-related difficulty in the ability to detect angular movement. In laboratory studies, aging persons required significantly longer to perceive that a vehicle was moving closer (Hills, 1975). Staplin and Lyles (1991) reported research showing that, relative to younger drivers, older ones underestimate the speed of approaching vehicles. Similarly, Scialfa, Guzy, Leibowitz, Garvey, and Tyrrell (1991) showed that older adults tend to overestimate approaching vehicle velocities at lower speeds and underestimate at higher speeds, relative to younger adults. Aging persons also apparently accept a gap to cross in front of an oncoming vehicle that is a more-or-less constant distance, regardless of the vehicle's speed. Analyses of judgments of the "last possible safe moment" to cross in front of an oncoming vehicle showed that older men accepted a gap to cross at an average constant distance, whereas younger men allowed a constant time gap and thus increased distance at higher speeds (Hills and Johnson, 1980). A controlled field study showed that older drivers waiting (stationary) to turn left at an intersection accepted the same size gap regardless of the speed of the oncoming vehicle (30 mph and 60 mph [48 and 96.5 km/h]), while younger drivers accepted a gap that was 25 percent larger for a vehicle traveling at 60 mph (96.5 km/h) than their gap for a vehicle traveling at 30 mph (48 km/h) (Staplin et al., 1993).
The minimum passing sight distances listed in Table 3B-1 of the MUTCD (FHWA, 2009) for marking passing zones are shorter than the minimum passing sight distance values for the design of two-lane highways, as listed in Exhibit 3-7 of AASHTO's 2004 Green Book; however, AASHTO revised its PSD values in the 2011 Green Book (Table 3-4) to match those found in the MUTCD. Although the minimum passing sight distances specified by AASHTO are based on observations of successful car-passing-car observations, Hughes et al. (1992) commented that the model does not take into account the abortive passing maneuver, nor does it consider the length of the impeding vehicle. Saito (1984) determined that the values specified by the MUTCD for minimum passing distance are inadequate for the abortive maneuver, while Ohene and Ardekani (1988) asserted that the MUTCD sight distance requirements are adequate for the driver to abort if the driver decelerates at a rate of 10.5 ft/s2 for a 40-mph passing speed and at a rate of 12.8 ft/s2 for a 50-mph passing speed. In any event, it cannot be assumed that drivers will always use the maximum acceleration and deceleration capabilities of their vehicles, particularly aging drivers.
Consistent with the AASHTO operational model (AASHTO, 2011), passing sight distance is provided only at places where combinations of alignment and profile do not require the use of crest vertical curves. For horizontal curves, the minimum passing sight distance for a two-lane road is about four times as great as the minimum stopping sight distance at the same speed (AASHTO, 2011). By comparison, the MUTCD defines passing sight distance for vertical curves as the distance at which an object 3.50 ft above the pavement surface can be seen from a point 3.50 ft above the pavement. For horizontal curves, passing sight distance is defined by the MUTCD as the distance measured along the centerline between two points 3.50 ft (1.07 m) above the pavement on a line tangent to the embankment or other obstruction that cuts off the view of the inside curve (MUTCD, 2009). The length of passing zones or the minimum distance between successive no-passing zones is specified as 400 ft (120 m) in the MUTCD; specifically, where the distance between successive no-passing zones is less than 400 ft, no-passing markings should connect the zones. As Hughes, Joshua, and McGee (1992) pointed out, the MUTCD sight distance requirements were based on a "compromise between a delayed and a flying passing maneuver, traceable back to the AASHTO 1940 policy that reflected a compromise distance based on a passing maneuver such that the frequency of maneuvers requiring shorter distances was not great enough to seriously impair the usefulness of the highway."
The basis for the minimum length of a passing zone is unknown, however, because research has indicated that for design speeds above 30 mph the distance required for one vehicle to pass another is much longer than 400 ft (Hughes et al., 1992). Weaver and Glennon (1972) reported that, in limited studies of short passing sections on main rural highways, most drivers do not complete a pass even within an 800-ft section; and use of passing zones remains very low when their length is shorter than 900 ft. Not surprisingly, it has been mentioned in the literature (Hughes et al., 1992) that the current AASHTO and MUTCD passing sight distance values are probably too low. Several studies have indicated that both the MUTCD and AASHTO passing sight distances are too short to allow passenger cars to pass trucks and for trucks to pass trucks (Donaldson, 1986; Fancher, 1986; Khasnabis, 1986).
Several research studies have been performed that have established and evaluated passing sight distance values for tangent sections of highways. As early as 1934, the National Bureau of Standards measured the time required for passing on level highways during light traffic and found that the time to complete the maneuver always ranged between 5 and 7 s regardless of speed. Passing maneuvers were observed at speeds ranging from 10 to 50 mph. They concluded that 900 ft of sight distance was required for passing at 40 mph (64 km/h). Harwood and Glennon (1976) reported that drivers are reluctant to use passing zones under 880 ft (268 m). They recommended that design and marking standards should be identical and include both minimum passing sight distances and minimum length of passing zones, with minimum passing sight distance values falling between the AASHTO and MUTCD values. Kaub (1990) presented a substantial amount of data on passing maneuvers on a recreational two-lane, two-way highway in northern Wisconsin. Under low and high traffic volumes, respectively, he found that 24–35 percent and 24–50 percent of all passes were attempted in the presence of an opposing vehicle; the average time in the opposing lane (60 mph) was 12.2 s under low-traffic conditions and 11.3 s with high-traffic volumes.
Passing lanes, also referred to as overtaking lanes, are auxiliary lanes provided on two-lane highways to enhance overtaking opportunities. Harwood, Hoban, and Warren (1988) reported that passing lanes provide an effective method for improving traffic operational problems resulting from the lack of passing opportunities, due to limited sight distance and heavy oncoming traffic volumes. In addition, passing lanes can be provided at a lower cost than that required to construct a four-lane highway. Based on Morrall and Hoban (1985), the design of overtaking lanes should include advance notification of the overtaking lane; a KEEP RIGHT UNLESS OVERTAKING sign at the diverge point; advance notification of the merge and signs at the merge; and some identification for traffic in the opposing lane that they are facing an overtaking lane. They reported that there is general agreement that providing short overtaking lanes at regular spacing is more cost-effective than providing a few long passing lanes. This feature becomes increasingly attractive as the diversity of driving styles and driver capability levels grows, with more aggressive motorists accepting greater risks to overtake slower-moving vehicles.
Brewer, et al (2011) studied operational and safety effects of passing lane corridors (also called "Super 2" corridors) in Texas. Previous research (Wooldridge, et al. 2001) demonstrated that periodic passing lanes can improve operations on two-lane highways with average daily traffic (ADT) lower than 5000. Brewer's research expanded on the Wooldridge research to develop design guidelines for passing lanes on two-lane highways with higher volumes, investigating the effects of volume, terrain, and heavy vehicles on traffic flow and safety. Results indicated that passing lanes provide added benefit at higher traffic volumes, reducing crashes, delay, and percent time spent following. Empirical Bayes analysis of crash data revealed a 35 percent reduction in expected non-intersection injury crashes. Simulation results indicated that most passing activity takes place within the first mile of the passing lane, so providing additional passing lanes can offer greater benefit than providing longer passing lanes. Whether adding new passing lanes or adding length to existing lanes, the incremental benefit diminished as additional length is provided and the highway more closely resembles a four-lane alignment. The simulation study also showed that the effects of ADT on operations were more substantial than the effects of terrain or truck percentage for the study corridor.
Finally, the benefits of fluorescent retroreflective sheeting for increased daytime and nighttime conspicuity are reported by Jenssen, Moen, Brekke, Augdal, and Sjøhaug (1996). They conducted a controlled field study of daytime and nighttime visibility performance of fluorescent and non-fluorescent yellow traffic signs, both fabricated with retroreflective sheeting that provides for high brightness at wide observation angles (ASTM D4956-01,Type IX). The subjects included younger (ages 18-25) and older (ages 55-75) drivers. Under daytime conditions, the fluorescent yellow signs with Type IX sheeting provided a 295 ft increase in sign shape recognition distance over the non-fluorescent yellow signs with Type IX sheeting for the aging driver sample, and a 187 ft increase for the younger driver sample. At a speed of 62 mph, this additional detection distance would translate to 3.2 s of extra reaction time for the older drivers and 2.1 extra seconds of reaction time for the younger drivers. At nighttime, the signs fabricated with Type IX sheeting provided an additional sign shape recognition distance of 945 ft over signs fabricated with engineering grade sheeting (Type I), and an additional 489 ft of shape recognition distance over signs made with high intensity sheeting (Type III) for the older driver sample. The younger driver sample performed similarly, with increased sign shape recognition distances for the signs made with Type IX sheeting (1,010 ft over the signs made with Type I engineering grade sheeting, and 482 ft over the signs fabricated with Type III high intensity sheeting). These increased distances translate to an additional 5 to 10 seconds of reaction time, at a speed of 60 mph (100 km/h).
The age differences in driver capability and behavior noted earlier—i.e., age-related difficulties in judging gaps and in increased perception-reaction time, coupled with slower driving speeds—support a recommendation for use of the more conservative passing sight distance values specified by AASHTO (2004). In addition, a raised treatment to improve drivers' preview of the end of a passing zone—the widely recognized NO PASSING ZONE pennant, either oversized or fabricated with fluorescent yellow retroreflective sheeting that provides for high brightness at wide observation angles (e.g., Type IX) for added daytime and nighttime conspicuity— can reasonably be expected to facilitate aging drivers' decisions and responses in situations where safe operations dictate that they should abort a passing maneuver. Finally, a recommendation to implement passing/overtaking lanes may be justified in terms of overall system safety and efficiency.
With the increasing need to provide more capacity on freeways and urban arterials, more jurisdictions are moving to the use of reversible lanes to accommodate peak-period traffic flows. The control of wrong-way movements on these facilities may be accomplished through the use of lane control signals (LCS). The MUTCD (section 4M.01) defines lane-use control signals as 'special overhead signals that permit or prohibit the use of specific lanes of a street or highway or that indicate the impending prohibition of their use." The meanings of LCS indications (steady downward green arrow, steady yellow X, and steady red X) are defined in MUTCD section 4M.02. LCS's provide real-time information to motorists about which downstream lanes are open (green downward arrow), which are closed (red X) and which lanes are about to be closed (yellow X) either because of an incident downstream or because the lane is a reversible lane. Drivers should vacate lanes over which an LCS displays a yellow X, and they should not enter lanes designated by a red X. Safe and effective responses to these indications by aging drivers hinge upon the same visual target detection and recognition processes which have been documented elsewhere in this Handbook to decline systematically with advancing age.
| Applications in Standard Reference Manuals | |
|---|---|
| MUTCD (2009) | AASHTO Green Book (2011) |
| Chapter 4M | Pgs. 7-48 through 7-50, Section on Reverse Flow Operation Pgs. 8-28 through 8-31, Section on Reverse-Flow Roadways |
Ullman, et al. (1996) conducted legibility studies of commercially available lane-use control symbols (LCSs) being used in freeway traffic management systems throughout Texas. Subjects included drivers ages 16-44 and drivers age 65 and older. In the first study, subjects were seated in the driver's seat of a test vehicle that was positioned 460 m from an overhead sign structure that displayed three fiber optic LCSs mounted side by side. They were shown one symbol presented on one LCS for a 1.5-s duration, and were asked to describe the symbol and the color. If a subject could not correctly identify the color and symbol, he or she moved closer to the LCS, until the color and symbol could be correctly identified. The study was conducted during the day. The symbols on all three LCS heads measured 14 in in height, but the arrangement of the pixels varied for the three sign manufacturers. Signal 1 utilized a single-stroke arrangement of pixels, arranged using 0-5 in lenses spaced 1 in apart. Signal 2 utilized a double-stroke arrangement of pixels, arranged using 0.6-in lenses spaced 1.5 in apart. Signal 3, besides displaying the three standard MUTCD symbols, was also able to display a yellow arrow pointing downward, or pointing to the left or right. Signal 3 utilized a double-stroke arrangement of pixels for the green arrow, the red X, and the yellow X, but utilized a single-stroke arrangement for the downward and diagonal yellow arrows. The lenses measured 0.15 in, and spacing was 0.7 in. Figure 94 presents the pixel layout of the three LCS heads used in this research. The legibility distances by symbol type are presented in Table 54, by signal type and driver age.
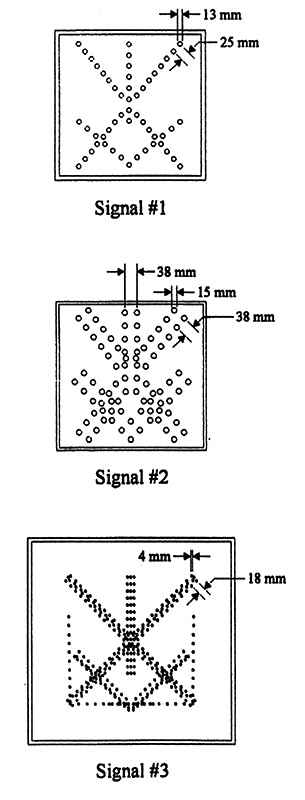
Figure 94. Pixel layout of LCD Heads employed in research conducted by Ullman et al. (1996)
| Driver Age | Signal 1 | Signal 2 | Signal 3 | ||||||||
|---|---|---|---|---|---|---|---|---|---|---|---|
| Red X | Yellow X | Green Down Arrow | Red X | Yellow X | Green Down Arrow | Red X | Yellow X | Green Down Arrow | Yellow Diagonal Arrow | Yellow Down Arrow | |
| Young/Middle Aged (16-44) | 366 | 457 | 396 | 335 | 457 | 457 | 427 | 457 | 457 | 427 | 457 |
| Older (65+) | 274 | 274 | 198 | 168 | 350 | 290 | 305 | 274 | 335 | 396 | 427 |
Results indicate that median legibility distances for the older drivers viewing the red X, yellow X, and green arrow were 298 to 649 ft shorter than those for the younger drivers. The biggest discrepancies between younger and older drivers were for the red X on Signal 2 and the green down arrow on Signal 1. Signal 3 produced the most uniform legibility distances for all symbols. The authors state that comments from the older drivers indicated that the double-stroke pixel arrangement combined with the larger pixel lenses on Signal 2 caused irradiation effects, resulting in older drivers' inability to identify the shape of the red "glow" until they were 50 percent closer to the signal than younger drivers. The actual cause of the poor legibility of the green down arrow on Signal 1 for older drivers was unknown, but hypothesized by the researchers to be a result of being slightly more "blue" than the green down arrows on the other two signals.
On the other hand, although the yellow downward and diagonal arrows displayed on Signal 3 are not standard MUTCD symbols for LCS's, they showed the highest legibility distance of all symbols for the older drivers, and yielded a legibility distance that was 30 m shorter than younger drivers' legibility distance. These symbols were created with a single line of closely spaced small pixels. The legibility distance was greater than that of the double-stroke yellow X presented on the same display. Results of a preliminary field study conducted in this same project indicated that the yellow X and yellow down/diagonal arrows were interchangeable, resulting in similar proportions of drivers exiting a closed lane.
The authors also studied the effects of age, dirt accumulation, and regular maintenance on LCS legibility. The combined effect of age and dirt accumulation significantly reduced the visibility of the green arrow and red X for both younger and older driver groups. The signal had been installed for 6 years, and had an 18-month accumulation of dirt, since its last cleaning. Subjects viewed the symbols before and after cleaning and replacement of each of the 50-watt halogen light bulbs in the signal face. The legibility distances before maintenance and cleaning ranged from 600 to 1,099 ft for drivers under age 45, and 351 to 899 ft for drivers age 65 and older. After maintenance and cleaning, visibility distances increased significantly for both driver groups. Median visibility distances for the younger drivers ranged from 850 to 1,250 ft, and for the older drivers ranged from 699 to 1,099 ft. There appears to be permanent loss of visibility of the red and green symbols over time; after maintenance, the legibility distances for both driver groups were two-thirds to three-fourths of those shown for the new LCS. The effect of dirt and signal age did not affect legibility distance of the yellow X.
Description of Practice: Pavement markings in advance of a lane drop are used to supplement the warning sign messages that indicate the lane is a dropped lane. Section 3B.04 of the 2009 MUTCD discusses standards and guidance for dotted white lane line markings and other lane-drop markings. Note that this is a different marking application than lane reduction markings, which are described in Section 3B.09.
Anticipated Benefits to Aging Road Users: As the result of normal aging, drivers may be at higher risk of failing to detect advance warning signs posted at the side of the road due to loss of visual sensitivity in the periphery; a narrowing of the attentional (or "useful") field of view; or a reduced ability to engage in a search of the visual periphery when, for example, road or weather conditions increase demands for path guidance information. To the extent that aging drivers experience any of these limitations, they should derive an extra benefit from advance warning messages presented as pavement markings—if these markings are applied and maintained at contrast levels sufficient to ensure legibility to an "aging design driver."
Description of Practice: Duplicate black markings applied immediately upstream or downstream from broken line longitudinal markings (staggered markings), or black contrast marking surrounding either side of broken or continuous longitudinal markings, are used to increase the visibility of markings on concrete and other light colored pavements. Routine use of such "contrast markings" occurs in Arkansas, Colorado, Georgia, Idaho, Missouri, North Carolina, Oklahoma, Pennsylvania, Texas, Utah, Virginia, Wisconsin, and the District of Columbia. The use of supplemental contrast markings is included as an option in the 2009 MUTCD.
Anticipated Benefits to Aging Road Users: Any treatment that improves the contrast and therefore the detectability of lane, gore, and other longitudinal pavement markings, whether broken or continuous, will have a disproportionate benefit to aging drivers, who as a group experience diminished contrast sensitivity due to normal changes in the lens of the eye and also evidence a higher prevalence of ocular diseases.
Description of Practice: Oversize glass beads in traditional paint markings, profiled thermoplastic markings, and preformed pavement marking tape designed for rumble strip applications all offer strategies to increase the retroreflectivity and thus the visibility of pavement markings at night and in wet weather conditions. Preformed pavement marking tape is utilized statewide in Iowa and on Detroit-area freeways in Michigan. Virginia utilizes the pavement marking tape on all interstate routes.
Anticipated Benefits to Aging Road Users: Any treatment that improves the contrast and therefore the detectability of lane and road edge boundaries will have a disproportionate benefit to aging drivers, who as a group experience diminished contrast sensitivity due to normal changes in the lens of the eye and also evidence a higher prevalence of ocular diseases. The continuous guidance information offered by treatments that enhance the contrast of pavement markings is especially helpful to aging drivers under adverse visibility conditions and when there is only a brief preview of changing roadway geometry downstream.
Description of Practice: Curve warning markings on the pavement in advance of horizontal curves are used to supplement warning sign messages such as the Curve Ahead sign and other curve delineation devices such as chevron signs. Such advance markings are currently in use in many locations in the country, including Irvine, California and Williamston, Michigan.
Anticipated Benefits to Aging Road Users: As the result of normal aging, drivers may be at higher risk of failing to detect advance curve warning signs posted at the side of the road due to loss of visual sensitivity in the periphery; a narrowing of the attentional (or "useful") field of view; or a reduced ability to engage in a search of the visual periphery when, for example, road or weather conditions increase demands for path guidance information. To the extent that aging drivers experience any of these limitations, they should derive an extra benefit from advance warning messages presented as pavement markings—if these markings are applied and maintained at contrast levels sufficient to ensure legibility to an "aging design driver."
Description of Practice: The classic roadway reconfiguration commonly referred to as a "road diet" involves converting an undivided four-lane roadway into three lanes made up of two through lanes and a center two-way left turn lane. The reduction of lanes allows the roadway to be reallocated for other uses such as bike lanes, pedestrian crossing islands, and/or parking. Midblock locations tend to experience higher travel speeds, contributing to increased injury and fatality rates. More than 80 percent of pedestrians hit by vehicles traveling at 40 mph or faster will die, while less than 10 percent will die when hit at 20 mph or less. (FHWA Office of Safety 2012)
Road diets can be low-cost treatments if planned in conjunction with reconstruction or simple overlay projects, since a road diet mostly consists of restriping. Roadways with Average Daily Traffic (ADT) of 20,000 or less may be good candidates for a road diet and should be evaluated for feasibility. It has been shown that roads with 15,000 ADT or less had very good results in the areas of safety, operations, and livability. Driveway density, transit routes, the number and design of intersections along the corridor, as well as operational characteristics are some considerations to be evaluated before deciding to implement a road diet.
It is a good practice to know well in advance when road reconstruction and overlay projects will be initiated so an evaluation can be conducted. It is important to analyze and understand the effects of the proposed change, obtain input from the community stakeholders, and ensure the appropriate elements are included in the project. Improvements to intersection turn lanes, signing, pavement markings, traffic control devices, transit stops, and pedestrian and bicyclist facilities may be needed to support this concept. It should be noted that the classic four-to-three-lane road diet is very compatible with single-lane roundabouts.
Anticipated Benefits to Aging Road Users: Road diets have multiple safety and operational benefits for vehicles as well as pedestrians, such as:
Decreasing vehicle travel lanes for pedestrians to cross, therefore reducing the multiple-threat crash (when one vehicle stops for a pedestrian in a travel lane on a multi-lane road, but the motorist in the next lane does not, resulting in a crash) for pedestrians.
Providing room for a pedestrian crossing island.
Improving safety for bicyclists when bike lanes are added (such lanes also create a buffer space between pedestrians and vehicles).
Providing the opportunity for on-street parking (also a buffer between pedestrians and vehicles).
Reducing rear-end and side-swipe crashes.
Improving speed limit compliance and decreasing crash severity when crashes do occur.
When appropriately applied, road diets have generated benefits to users of all modes of transportation, including bicyclists, pedestrians, and motorists. The resulting benefits include reduced vehicle speeds, improved mobility and access, reduced collisions and injuries, and improved livability and quality of life. When modified from four travel lanes to two travel lanes with a two-way left-turn lane, roadways have experienced a 29 percent reduction in all roadway crashes. The benefits to pedestrians include reduced crossing distance and fewer midblock crossing locations, which account for more than 70 percent of pedestrian fatalities. (FHWA Office of Safety 2012) A Michigan study (Taylor 2004) compared before-after crash data for eight corridors treated with road diets and found that the weighted average number of crashes per year declined by 25 percent and injury crashes by 30 percent, but for crashes specifically involving aging drivers, the weighted average number of crashes per year declined by 39 percent and injury crashes by 48 percent.
Description of Practice: Horizontal curves made up only 5 percent of the country's highway miles in 2008. Yet, more than 25 percent of highway fatalities in the United States occur at or near horizontal curves each year. While some of the factors contributing to these crashes include excessive vehicle speed or distracted driving and driver error, at some locations, the deterioration of pavement surface friction may also be a contributing factor. Variable friction creates the need to consider pavement improvements for surface characteristics, particularly for friction, at certain locations in order to increase safety.
High friction surface treatments (HFSTs) are the site-specific application composed of "tough" polish-resistant, abrasion-resistant aggregates bonded to the pavement surface using a resin that restores and maintains pavement friction where the need for a safer pavement surface is the greatest. Maintaining the appropriate amount of pavement friction is critical for safe driving. Vehicles traversing horizontal curves require a greater side force friction, and vehicles at intersections require greater longitudinal force friction.
HFSTs have been used on horizontal and vertical curves, at intersections, at on and off-ramps, and on bridge decks. HFSTs are known to reduce crashes, have a significant benefit/cost ratio, are relatively low-cost compared to geometric improvements, are durable and long-lasting, produce negligible environmental impacts and have minimal impact to traffic. HFSTs have been tried and proven in over 40 states, and they are a recommended treatment as part of FHWA's Every Day Counts initiative (FHWA, 2012).
HFSTs can be placed manually or mechanically depending on the size of the project. Costs typically run $20 to $40 per square yard, depending on the size of the project. Friction values immediately increase with HFST and retain their values over much longer time periods (7-10 years) than typical pavement mixes. Because HFSTs are placed on the pavement, there is seldom any need for right-of-way or environmental approvals, which lead to a quick solution at a reduced cost compared to geometric improvements. This in turn leads to a reduction in crashes and can be used proactively on other areas with similar geometrics. (ATSSA, 2013)
Anticipated Benefits to Aging Road Users: A higher friction surface amplifies braking and expedites the reduction in vehicle speeds, helping drivers retain control. Furthermore, it meets the need underscored by AASHTO's 2011 Green Book to provide skid resistant pavements for wet, snow and ice covered surfaces to address side friction needs. While these benefits have been shown for the driving population as a whole, they are expected to be at least as applicable for aging drivers to help offset declining reaction times in steering and braking.

