U.S. Department of Transportation
Federal Highway Administration
1200 New Jersey Avenue, SE
Washington, DC 20590
202-366-4000
As part of a survey conducted by a Research Team led by Toole Design Group for NCHRP 07-17 Pedestrian and Bicycle Data Collection and Prioritization Along Existing Roads, six pedestrian maintenance-focused questions were included. The responses to these questions provided basic information about which of the 439 responding agencies have pedestrian facility maintenance programs and procedures in place and the criteria, if any, used to prioritize projects. In addition, the responses provided a pool of potential agencies to contact to obtain further detail on their pedestrian facility maintenance practices. Many of these agencies were contacted and provided valuable information some of which is included in Section 1.5 Agency Discussion.
The following pedestrian maintenance-related questions were asked in the 07-17 survey:
In addition to the above pedestrian facility maintenance-focused questions, general questions were asked about the respondent's work setting, including the type of agency or organization they work for, and the population of that entity's service area. Of the 439 NCHRP 07-17 survey responses received, 177 answered at least one of the maintenance-related questions listed above. This section provides a summary of responses to the pedestrian facility maintenance-related questions asked in the survey.
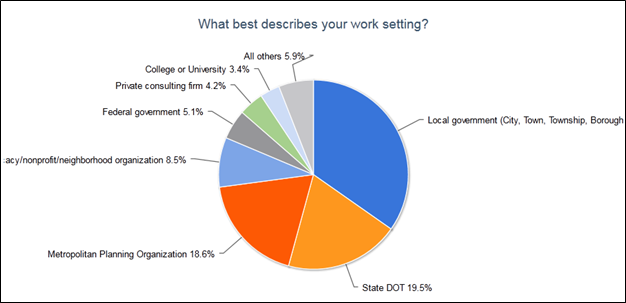
The majority of the respondents who answered questions about pedestrian facility maintenance work in a local government (city, town, township or borough) setting, followed by State DOTs and Metropolitan Planning Organizations (MPO). A smaller number of respondents represent advocacy, nonprofit or neighborhood organizations, the federal government, private consulting firms, colleges or universities, counties, transit agencies, or school districts. Figure 1 provides a percentage breakdown of responses based on the 118 respondents who answered this question.
Figure 1: Work setting
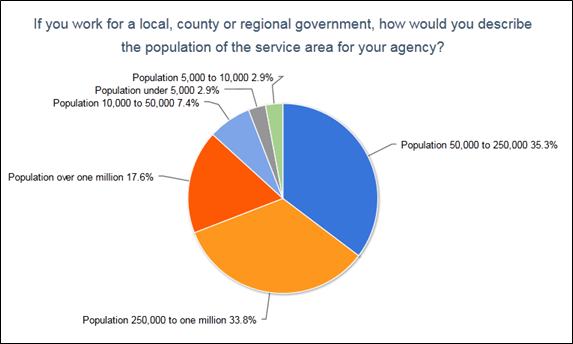
If you work for a local, county or regional government, how would you describe the population of the service area for your agency?
Sixty-eight respondents indicated the population of the areas served by their agency. The largest number of respondents (24) work for transportation agencies serving communities with populations in the range of 50,000 to 250,000, closely followed by communities with populations in the range of 250,000 to one million (23). Twelve respondents work for agencies serving communities with a population over one million. Figure 2 provides a full summary of responses to this question by percentage (based on 68 responses).
Figure 2: Population of the service area
What are the criteria used to prioritize maintenance of pedestrian facilities on existing roads?
Thirty-five survey respondents chose one or more of 21 listed criteria used to prioritize maintenance of pedestrian facilities. Table 1 shows the total number and percentage of agencies that use the listed criteria.
Table 1: Criteria used to prioritize maintenance of pedestrian facilities
| CRITERIA | COUNT | % |
|---|---|---|
| Community priority (including complaints/requests) | 29 | 83% |
| Sidewalk condition | 25 | 71% |
| Accessibility (ADA complaint) | 24 | 69% |
| Safety (pedestrian crash reduction) | 23 | 57% |
| Guidance from elected leaders | 20 | 57% |
| Access to school | 19 | 54% |
| Access to transit | 16 | 46% |
| Previous plans or studies | 16 | 46% |
| Project feasibility or cost | 15 | 43% |
| Projected demand | 14 | 40% |
| Grant/funding opportunity | 14 | 40% |
| Connectivity/filling gaps | 14 | 40% |
| Pedestrian quality of service (quality of the walking environment) | 13 | 37% |
| Other implementation opportunities (including "piggybacking" on other projects) | 12 | 34% |
| Motor vehicle traffic volumes | 12 | 34% |
| Pedestrian level of service (capacity/delay) | 10 | 29% |
| Pedestrian counts | 9 | 26% |
| Economic development opportunities | 7 | 20% |
| Motor vehicle level of service | 7 | 20% |
| Health impact | 6 | 17% |
| Other | 1 | 3% |
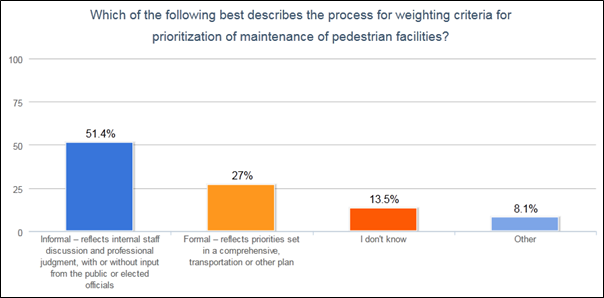
The majority (19) of the 37 respondents who answered this question indicated their agency uses an informal prioritization process that entails internal staff discussions and professional judgment, with or without input from the public or elected officials. Ten respondents indicated their agency uses a formal process based on priorities set in a comprehensive, transportation or other plan. Five respondents did not know what type of process they have while three used another type of process, which included either a mix of formal and informal or no process. Figure 3 shows the percentage breakdown of responses to this question based on 37 responses.
Figure 3: Weighting criteria for prioritization of maintenance of pedestrian facilities
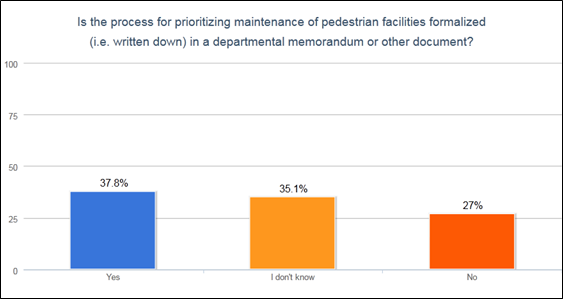
Is the process for prioritizing maintenance of pedestrian facilities formalized (i.e. written down) in a departmental memorandum or other document?
Approximately 38% of the 37 respondents who answered this question indicated that their agency’s process for prioritizing maintenance of pedestrian facilities is formalized in a departmental memorandum or other document. Ten respondents indicated their agency’s process is not formally recorded, while 13 did not know. Figure 4 shows the percentage breakdown of the 37 responses to this question.
Figure 4: Formalized process for prioritizing maintenance of pedestrian facilities
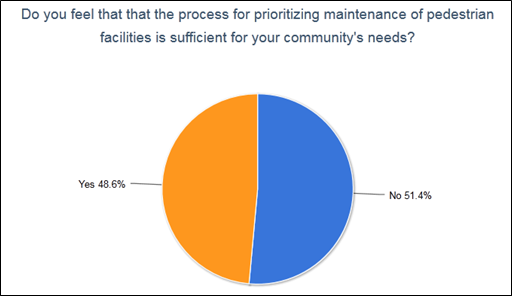
Do you feel that the process for prioritizing maintenance of pedestrian facilities is sufficient for your community’s needs?
A slight majority (18 of the 35 responses) of respondents indicated that their agency’s prioritization process is not sufficient for their community’s needs (Figure 5).
Figure 5: Sufficient process for prioritizing maintenance of pedestrian facilities
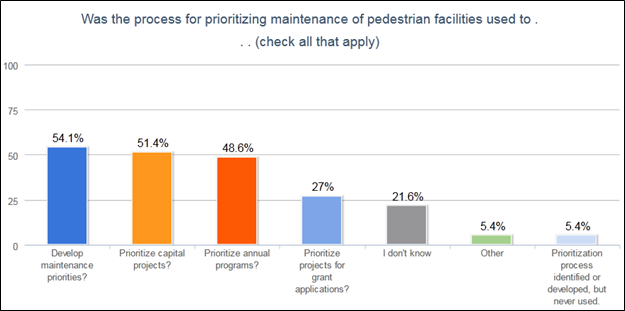
Was the process for prioritizing maintenance of pedestrian facilities used to…?
Respondents could choose one or more of six possible answers, or indicate that a process has been identified, but never used. Open text responses for those that indicated “other” included ADA compliance and receiving grant funding. The percentages in Figure 6 are based on 37 responses.
Figure 6: Use of process for prioritizing maintenance of pedestrian facilities
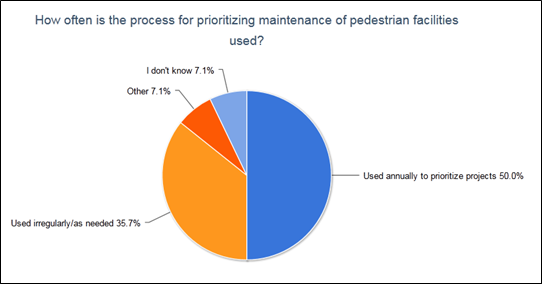
How often is the process for prioritizing maintenance of pedestrian facilities used?
Fourteen of the 28 responses to this question indicate that the prioritization process is used annually to prioritize maintenance projects. Ten respondents indicated their agency uses their prioritization process irregularly or as needed, while two did not know. Open text responses for the two respondents that indicated “other” included:
Figure 7 provides a percentage breakdown of the 28 responses to this question.
Figure 7: Frequency of use of the process for prioritizing maintenance of pedestrian facilities
Responses to the NCHRP 07-17 survey questions pertaining to maintenance of pedestrian facilities may point to a need or demand for more systematic methodologies for prioritizing maintenance. A slight majority of respondents indicated that their agencies' process for prioritizing maintenance of pedestrian facilities is insufficient. About the same percentage of respondents indicated that their process for prioritizing maintenance of pedestrian facilities as "informal," meaning that it reflects internal staff discussions and professional judgment with or without input from the public. There may be a correlation between the insufficiency of an agency's prioritization process and the degree to which it is formalized and systematic, however, the survey did not ask why the prioritization process was sufficient or not.

