U.S. Department of Transportation
Federal Highway Administration
1200 New Jersey Avenue, SE
Washington, DC 20590
202-366-4000
| < Previous | Table of Content | Next > |
Twain Avenue is classified as a minor arterial with a posted speed limit of 35 mph along the corridor between Cambridge Street and Palos Verde Street. Twain Avenue runs in the east-west direction. The location is within the jurisdiction of Clark County. Land use along the corridor is mixed type with some shopping centers and residential apartments. ADT along the corridor for the year 2006 was approximately 21,400. Figures 28 and 29 present the aerial photographs of the Site 11 and Site 12 respectively. Implementation plans and conceptual designs for these sites are illustrated in Appendix B.
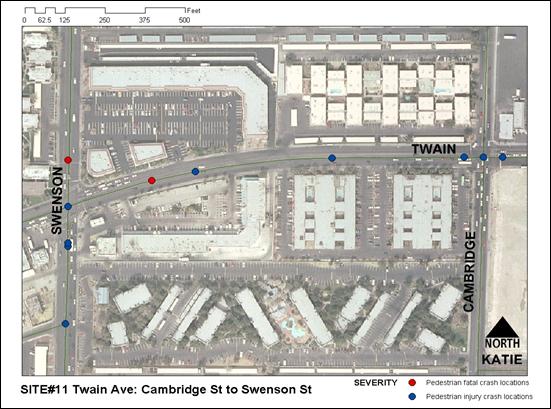
Figure 28: Aerial Photograph of Site 11
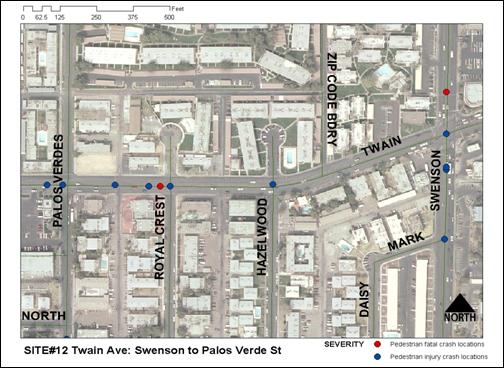
Figure 29: Aerial Photograph of Site 12
The problems identified along the corridor include excessive speeding, drivers not yielding to pedestrians, pedestrians trapped in the roadway, and conflicts between vehicles and pedestrians.
The countermeasures deployed at this site include “In-roadway knockdown signs” and “Portable speed trailer.” The implementation plans for the proposed countermeasures at the above mentioned locations are shown in Tables 42 and 43.
| Treatment | Stage 1 |
|---|---|
| In-roadway knockdown signs | O |
O – Installed
| Treatments | Stage 1 | Stage 2 |
|---|---|---|
| In-roadway knockdown signs | O | O |
| Portable speed trailers | O |
O – Installed
The finalized countermeasures were installed at sites 11 and 12 in 2 stages.
Stage 1 Countermeasure Deployment
The countermeasures deployed during stage 1 are “In Roadway Knockdown Signs.” These signs were installed between October 10 and 14, 2005. The after condition data for stage 1 countermeasure deployment were collected between November 1 and 4, 2005. Figure 30 and Figure 31 show the countermeasures deployed in Stage 1 at this location.
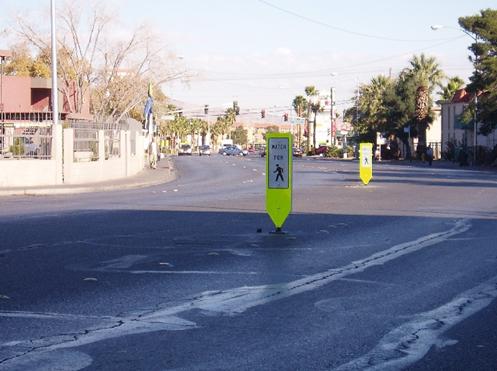
Figure 30: In-Roadway Knockdown Signs installed at Sites 11 and 12
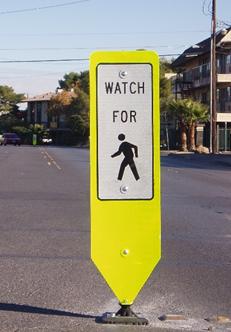
Figure 31: Close-up view of “In-Roadway Knockdown Signs” installed at Sites 11 and 12
Stage 2 Countermeasure Deployment
The countermeasure deployed during stage 2 is “Portable Speed Trailer.” This countermeasure was installed between August 1 and September 30, 2006. The after condition data for Stage 2 countermeasure deployment were collected on October 18 and 19, 2006. Figure 32 shows the countermeasure deployed in Stage 2 at this location.
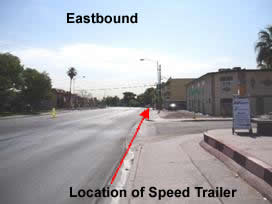
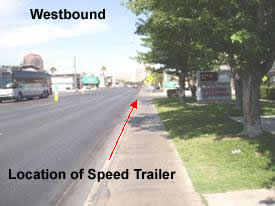
Figure 32: Installation location of Speed-trailer on Twain Avenue
Data were collected for various pedestrian and motorist MOEs and the summarized results are shown in Tables 44 to 47.
The safety MOEs identifies includes some related to pedestrians and others related to motorists.
11.5.1 Pedestrian MOEs
Table 44 shows that the proportion of pedestrians who look for vehicles before beginning to cross and before crossing the second half of the roadway increased from 0.80 to 1.00 and from 0.85 to 1.00 respectively. This indicates that the in-roadway knockdown signs have positive impacts with respect to these MOEs. No change in the proportion of captured or diverted pedestrians is observed. The proportion of pedestrians trapped in the roadway reduced from 0.41 in baseline to 0.34 in stage 1, and to 0.37 in stage 2. This also suggests improved safety for pedestrians.
11.5.2 Motorist MOEs
Table 45 shows the percent of drivers yielding to pedestrians in different stages as a measure of motorist MOE. The baseline data indicate only a small proportion (0.07) of drivers yield to pedestrians. After the installation of in-roadway knockdown in the second stage, this proportion increased to 0.35. After the use of speed trailer in stage 2, the proportion of drivers yielding to pedestrian slightly decreased to 0.29. Since the location is a mid-block, the distance of drivers stopping/yielding before crosswalk and the percent of drivers blocking the crosswalk are not applicable.
| Measures of Effectiveness (Safety) |
Baseline | Stage 1 | Stage 2 | |||
|---|---|---|---|---|---|---|
| Sample = 165 | Sample = 47 | Sample = 156 | ||||
| NB | Percent | N1 | Percent | N2 | Percent | |
| Percent pedestrians who look for vehicles before beginning to cross | 132 | 80 | 47 | 100 | 156 | 100 |
| Percent pedestrians who look for vehicles before crossing 2nd half of the street | 141 | 85 | 47 | 100 | 156 | 100 |
| Percent of captured pedestrians | 165 | 100 | 47 | 100 | 156 | 100 |
| Percent of diverted pedestrians | 0 | 0 | 0 | 0 | 0 | 0 |
| Percent of pedestrians trapped in the roadway | 68 | 41 | 16 | 34 | 58 | 37 |
| Measures of Effectiveness (Safety) |
Baseline | Stage 1 | Stage 2 | |||
|---|---|---|---|---|---|---|
| Sample = 141 | Sample = 79 | Sample = 119 | ||||
| NB | Percent | N1 | Percent | N2 | Percent | |
| Percent of drivers yielding to pedestrians | 10 | 7 | 28 | 35 | 35 | 29 |
11.6.1 Pedestrian Delay
The average pedestrian and vehicle delay measured at this location are shown in Table 46 for the various deployment stages. The average pedestrian delay increased in stages 1 and 2 compared to the baseline data.
11.6.2 Vehicle Delay
Table 46 shows that compared to the baseline data, average vehicle delays increased in stages 1 and 2.
11.6.3 Vehicle Speed
Table 47 shows the mean vehicle speeds for the various countermeasure deployment stages. The existing condition mean speeds in the eastbound and westbound directions are 40 mph and 35 mph, respectively. The installation of in-roadway knockdown signs reduced the speeds to 34.5 mph and 28.5 mph, in the eastbound and westbound directions, respectively. The difference of the mean speeds between the existing condition and after stage 1 is approximately 6 mph. Similar trends are observed in the westbound direction. The deployment of speed trailer further reduced the speed in the eastbound direction to 31.9 mph. The mean speed in the westbound direction is reduced to 31.3 mph from 35 mph in the baseline period, but this was greater than the mean speed observed after stage 1.
Table 46: Delays at Twain Avenue: Palos Verde Street to Swenson Street
| Measures of Effectiveness (Mobility) |
Baseline | Stage 1 | Stage 2 | |||
|---|---|---|---|---|---|---|
| Sample | Delay | Sample | Delay | Sample | Delay | |
| Average pedestrian delay (sec/ped) | 164 | 0.81 | 47 | 12.19 | 156 | 14.72 |
| Average vehicle delay (sec/veh) | 141 | 0.18 | 79 | 3.23 | 119 | 2.49 |
Table 47: Vehicle speeds at Twain Avenue: Palos Verde Street to Swenson Street
| Measures of Effectiveness (Mobility) |
Baseline | Stage 1 | Stage 2 | |||
|---|---|---|---|---|---|---|
| Sample | Mean speed (mph) | Sample | Mean speed (mph) | Sample | Mean speed (mph) | |
| Eastbound | 150 | 40.0 | 100 | 34.5 | 250 | 31.9 |
| Westbound | 200 | 35.0 | 100 | 28.5 | 250 | 31.3 |
The results of the statistical tests for the safety MOEs for site 12 (Twain Avenue: Swenson Street to Palos Verde Street) comparing the baseline conditions with each stage, and between stages are shown in Tables 48 and 49, respectively. The analyses of statistical results for the mobility MOEs are shown in Tables 50 and 51.
11.7.1 Safety MOEs
The results of the statistical tests for safety MOEs are shown in Tables 48 and 49. The results, when the baseline data and stage 1 data are compared, show that the increase in the percentage of pedestrian who look for vehicles before beginning to cross and before crossing 2nd half of the street are significant at a 95 percent confidence level. These results indicate that the deployment of the countermeasures results in improvements in pedestrian safety. The proportion of diverted pedestrians and captured pedestrians do not change between the various stages. The increase in drivers yielding to pedestrians is found to be significant in both cases as shown in Table 50. The results were not statistically significant at a 95 percent confidence level when the percent of pedestrians trapped in the roadway in stage 1 and stage 2 are compared with the baseline data.
Comparing the data for stage 1 and stage 2, no change in the proportions of pedestrians who look for vehicles before crossing and before crossing the 2nd half of the street, captured and diverted pedestrians is seen. However, Table 51 shows that the percent of drivers yielding to pedestrians and the percent of pedestrians trapped in roadways are not significantly different statistically at a 95 percent confidence level.
| Measures of Effectiveness (Safety) |
Baseline vs. Stage 1 | Baseline vs. Stage 2 | ||||
|---|---|---|---|---|---|---|
| PB – P1 | P-value | H0 | PB – P2 | P-value | H0 | |
MOEs below are tested for H0: Pbefore= Pafter vs. Ha: Pafter< Pbefore |
||||||
| Percent pedestrians who look for vehicles before beginning to cross | -0.20 | <0.001 | Reject | No change | ||
| Percent pedestrians who look for vehicles before crossing 2nd half of street | -0.14 | <0.001 | Reject | No change | ||
| Percent of captured pedestrians | No change | No change | ||||
| Percent of diverted pedestrians | No change | No change | ||||
| Percent of drivers yielding to pedestrians | -0.28 | <0.001 | Reject | -0.22 | <0.001 | Reject |
| MOE below is tested for H0: Pbefore= Pafter vs. Ha: Pafter< Pbefore | ||||||
| Percent of pedestrians trapped in the roadway | 0.07 | >0.05 | Do not Reject | 0.04 | >0.05 | Do not Reject |
| Measures of Effectiveness (Safety) |
Stage 1 vs. Stage 2 | ||
|---|---|---|---|
| P1 – P2 | P-value | H0 | |
| MOEs below are tested for H0: Pbefore= Pafter vs. Ha: Pafter< Pbefore | |||
| Percent pedestrians who look for vehicles before beginning to cross | 0.00 | No change | |
| Percent pedestrians who look for vehicles before crossing 2nd half of street | 0.00 | No change | |
| Percent of captured pedestrians | 0.00 | No change | |
| Percent of diverted pedestrians | 0.00 | No change | |
| Percent of drivers yielding to pedestrians | 0.06 | >0.05 | Do not Reject |
| MOE below is tested for H0: Pbefore= Pafter vs. Ha: Pafter< Pbefore | |||
| Percent of pedestrians trapped in the roadway | -0.03 | >0.05 | Do not Reject |
11.7.2 Mobility MOEs
The results of statistical tests for the significance of the mobility MOE is shown in Tables 50 and 51. Statistical tests revealed no significant difference in results obtained for average pedestrian delay and average vehicle delay. The decrease in eastbound mean speed is found to be significant for all three cases as seen in Tables 52 and 53. The decrease in the westbound mean speed, when baseline data is compared with stage 1 and stage 2 is found to be significantly different. However, difference obtained when the westbound mean speed for stage 1 and stage 2 is compared is not statistically significant as seen in Table 53.
Table 50: Statistical test results of mobility MOEs at Twain Avenue: Palos Verde Street to Swenson Street
| Measures of Effectiveness (Mobility) |
Baseline vs. Stage 1 | Baseline vs. Stage 2 | ||||
|---|---|---|---|---|---|---|
| Difference in Mean | P-value | H0 | Difference in Mean | P-value | H0 | |
| MOEs below are tested for H0: Pbefore= Pafter vs. Ha: Pafter< Pbefore | ||||||
Average pedestrian delay (sec/ped) |
-11.38 | >0.05 | Do not Reject | -13.91 | >0.05 | Do not Reject |
| Average vehicle delay (sec/veh) | -3.05 | >0.05 | Do not Reject | -2.31 | >0.05 | Do not Reject |
Table 51: Statistical test results of mobility MOEs between stages at Twain Avenue:
Palos Verde Street to Swenson Street
| Measures of Effectiveness (Mobility) | Stage 1 vs. Stage 2 | ||
|---|---|---|---|
| Difference in Mean | P-value | H0 | |
| MOEs below are tested for H0: Pbefore= Pafter vs. Ha: Pafter< Pbefore | |||
| Average pedestrian delay (sec/ped) | -2.53 |
>0.05 |
Do not Reject |
| Average vehicle delay (sec/veh) | 0.74 |
>0.05 |
Do not Reject |
Table 52: Statistical test results of speed at Twain Avenue: Palos Verde Street to Swenson Street
| Measures of Effectiveness (Mobility) | Baseline vs. Stage 1 | Baseline vs. Stage 2 | ||||
|---|---|---|---|---|---|---|
| Difference in Mean Speed | P-value | H0 | Difference in Mean Speed | P-value | H0 | |
| MOEs below are tested for H0: Pbefore= Pafter vs. Ha: Pafter< Pbefore | ||||||
| Eastbound (mph) | 5.50 | <0.001 | Reject | 8.10 | <0.001 | Reject |
| Westbound (mph) | 6.50 | <0.001 | Reject | 3.70 | <0.001 | Reject |
Table 53: Comparison of speed between stages at Twain Avenue:
Palos Verde Street to Swenson Street
| Measures of Effectiveness (Mobility) | Stage 1 vs. Stage 2 | ||
|---|---|---|---|
| Difference in Mean | P-value | H0 | |
| MOEs below are tested for H0: Pbefore= Pafters vs. Ha: Pafter< Pbefore | |||
| Eastbound (mph) | 2.60 | <0.001 | Reject |
| Westbound (mph) | -2.80 | >0.05 | Do not Reject |
The installation of in-roadway knockdown signs and portable speed trailer has improved the yielding behavior of drivers to pedestrians. This makes roadway safer for the pedestrians crossing the street. The decreases in the vehicle travel speeds at this location suggest that these countermeasures are very effective strategy wherever speeding is an issue.
| < Previous | Table of Content | Next > |

