U.S. Department of Transportation
Federal Highway Administration
1200 New Jersey Avenue, SE
Washington, DC 20590
202-366-4000
| < Previous | Table of Content | Next > |
The land use at this location is mainly a mixture of commercial and residential. This site is an intersection of a six lane minor arterial (Lake Mead Boulevard) with two left turning lanes and with a speed limit 35 mph, and a four lane minor arterial (Las Vegas Boulevard) with a left turning lane and with speed limit of 35 mph. This site is in the jurisdiction of City of North Las Vegas. It is one of the 4 selected sites along the Lake Mead Boulevard corridor between Las Vegas Boulevard and Pecos Road. There were a total of 8 crashes recorded at the intersection; with all of them reported as injury crashes. Almost 75 percent of the total crashes occurred at the intersection locations. Figure 33 presents the aerial photograph of this site. Site 13 in Appendix B presents implementation plan and the conceptual design of this location.
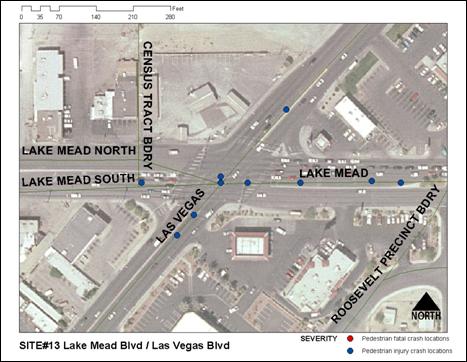
Figure 33: Aerial Photograph of Lake Mead Boulevard and Las Vegas Boulevard
Some of the problems identified at this location are pedestrians do NOT use the crosswalks, inconspicuous crosswalks, high percent of elderly pedestrian involved in crashes, and inconspicuous pedestrian signals due to wide streets
A “High visibility crosswalk” treatment is proposed at this location to help reduce the problem of inconspicuous crosswalks at the location. Enlarged Pedestrian Signal Heads are also proposed as a countermeasure deployment. The implementation plan for the proposed countermeasures at this location is shown in Table 54.
| Treatments | Stage 1 | Stage 2 |
| High visibility crosswalk | O | O |
| High visibility crosswalk from island to sidewalk | O | O |
| Enlarged Pedestrian Signal Heads | X |
O – Installed
X – Not installed due to non-availability
Stage 1 Countermeasure Deployment
Countermeasure deployed during this stage is “high visibility crosswalk treatment.” This countermeasure is installed between October 3 and 7, 2005. The after condition data for stage 1 countermeasure deployment are collected on November 7, 2005. Figure 34 shows the countermeasures deployed at this location.
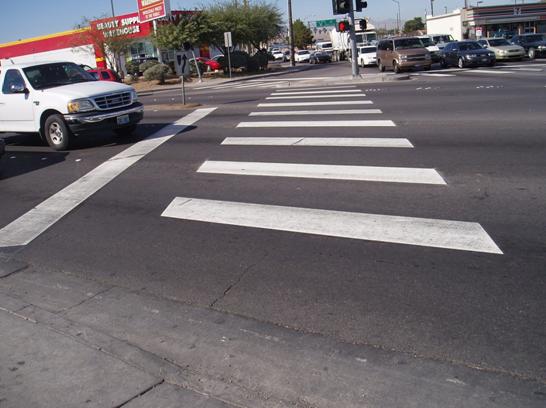
Figure 34: High Visibility Crosswalk Treatment installed at Lake Mead Boulevard and Las Vegas Boulevard
Implementation of stage 2 countermeasure is cancelled due to the non-availability of vendors to fabricate and manufacture “Enlarged Pedestrians Signal Head” countermeasure.
The results of the safety MOEs are summarized in Tables 55 and 56. Table 55 shows the pedestrian MOEs that are percent of the pedestrians who look for vehicles before beginning to cross, percent signal cycles in which call button has been pushed, frequency of pedestrian signal violation, percent of pedestrians in crosswalk at DON’T WALK, and percent of pedestrians trapped in the roadway. The motorist MOES are summarized in Table 56. These motorist MOEs are percent of drivers yielding to pedestrians, yielding distance, drivers blocking the crosswalk, and drivers making a complete stop.
13.5.1 Pedestrian MOEs
Table 55 summarizes the data collected for pedestrian MOEs at Lake Mead Boulevard and Las Vegas Boulevard. It can be seen that the “percent of the pedestrians who look for vehicles before beginning to cross” increased slightly from 38% to 43% after the installation of Stage 1 countermeasure. Percent of signal cycles in which call button has been pushed remained almost the same (58% and 54% respectively) even after the installation of the high visibility crosswalk treatment countermeasure. However, frequency of pedestrian signal violation was increased from 4% in Baseline to 12% in Stage 1 after the installation of the countermeasure. The impact of countermeasure installation on “percent of pedestrians in crosswalk at DON’T WALK” and on “percent of pedestrians trapped in the roadway” remained almost the same in the baseline and the stage 1 conditions.
| Measures of Effectiveness (Safety) |
Baseline | Stage 1 | ||||
|---|---|---|---|---|---|---|
| Sample | NB | Percent | Sample | N1 | Percent | |
| Percent pedestrians who look for vehicles before beginning to cross | 411 | 159 | 38 | 377 | 162 | 43 |
| Percent signal cycles in which call button has been pushed | 411 | 237 | 58 | 377 | 205 | 54 |
| Frequency of pedestrian signal violation | 411 | 19 | 4 | 377 | 48 | 12 |
| Percent of pedestrians in crosswalk at DON’T WALK | 411 | 11 | 2 | 377 | 17 | 5 |
| Percent of pedestrians trapped in the roadway | 411 | 16 | 3 | 377 | 8 | 2 |
13.5.2 Motorist MOEs
It is evident from Table 56, that there is not positive impact on the motorists as a result of the installation of the high visibility crosswalk treatment. All the MOEs collected before and after installation of the high visibility crosswalk treatment showed negative impact.
| Measures of Effectiveness (Safety) |
Baseline | Stage 1 | |||||
|---|---|---|---|---|---|---|---|
| Sample | NB | Percent | Sample | N1 | Percent | ||
| Percent of drivers yielding to pedestrians | 68 | 24 | 35 | 247 | 67 | 27 | |
| Distance driver stops/yields before crosswalk | < 5 ft | 24 | 11 | 46 | 67 | 20 | 30 |
| 5-10 ft | 24 | 9 | 38 | 67 | 37 | 55 | |
| >10 ft | 24 | 4 | 16 | 67 | 10 | 15 | |
| Percent of drivers blocking crosswalk | 68 | 14 | 21 | 247 | 47 | 19 | |
| Percent of drivers making a complete stop | 67 | 50 | 75 | 247 | 82 | 33 | |
From Table 57, it is seen that average pedestrian delay increased from 36.6 seconds to 41.3 seconds per pedestrian after the installation of the high visibility crosswalk treatment. However, on the contrary, vehicle delays decreased slightly from 26.7 seconds to 20.8 seconds after the stage 1 countermeasure installation.
| Measures of Effectiveness (Mobility) |
Baseline | Stage 1 | ||
|---|---|---|---|---|
| Sample | Delay | Sample | Delay | |
| Average pedestrian delay (sec/ped) | 411 | 36.64 | 377 | 41.31 |
| Average vehicle delay (sec/veh) | 774 | 26.69 | 864 | 20.76 |
13.7.1 Safety MOEs
The statistical results of the safety MOEs for Lake Mead Boulevard and Las Vegas Boulevard are shown in Table 58. It is evident from the results table; none of the parameters (either pedestrian related or motorist related) showed statistically significant improvement after the installation of the high visibility crosswalk treatment at Lake Mead Boulevard and Las Vegas Boulevard.
| Measures of Effectiveness (Safety) |
Baseline vs. Stage 1 | |||
|---|---|---|---|---|
| PB – P1 | P-value | H0 | ||
| MOEs below are tested for H0: Pbefore= Pafter vs. Ha: Pafter > Pbefore | ||||
| Percent pedestrians who look for vehicles before beginning to cross | -0.04 | >0.05 | Do not Reject | |
| Percent signal cycles in which call button has been pushed | 0.03 | >0.05 | Do not Reject | |
| Percent of drivers yielding to pedestrians | 0.08 | >0.05 | Do not Reject | |
| Distance driver stops/yields before crosswalk | <5 ft | 0.15 | >0.05 | Do not Reject |
| 5-10 ft | -0.17 | >0.05 | Do not Reject | |
| >10 ft | 0.01 | >0.05 | Do not Reject | |
| Percent of drivers making a complete stop | 0.41 | >0.05 | Do not Reject | |
| MOEs below are tested for H0: Pbefore= Pafter vs. Ha: Pafter > Pbefore | ||||
| Percent of pedestrians trapped in the roadway | 0.017 | >0.05 | Do not Reject | |
| Frequency of pedestrian signal violation | -0.08 | >0.05 | Do not Reject | |
| Percent of pedestrians in crosswalk at DON’T WALK | -0.018 | >0.05 | Do not Reject | |
| Percent of drivers blocking crosswalk | 0.01 | >0.05 | Do not Reject | |
The data collected before and after the installation of the High Visibility Crosswalk Treatment at this location does not show significant improvement in safety for pedestrians as anticipated. The other problems identified at this location such as “high percent of elderly pedestrian involved in crashes,” and “inconspicuous pedestrian signals due to wide streets” would have been addressed by installation of Enlarge Pedestrians Signal Heads. However, vendor unavailability hampered the process of installation of this countermeasure.
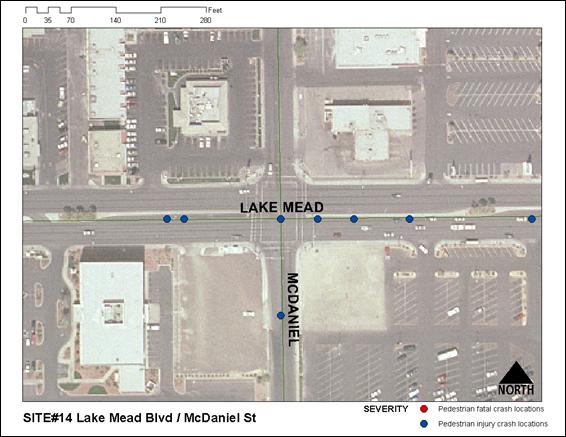
Figure 35: Aerial Photograph of Lake Mead Boulevard
and McDaniel Street (Control Site)
| < Previous | Table of Content | Next > |

