U.S. Department of Transportation
Federal Highway Administration
1200 New Jersey Avenue, SE
Washington, DC 20590
202-366-4000
| < Previous | Table of Content | Next > |
The location is within the jurisdiction of the City of North Las Vegas. Land use is primarily residential. Lake Mead Boulevard is a major arterial with a posted speed limit of 45 mph. As per 2006 traffic count statistics, the AADT on Lake Mead Boulevard between Belmont Street and McCarran Street is 44,000. Figure 36 presents the aerial photograph of the site. Implementation plans and conceptual designs of this site are illustrated in Site 15A and Site 15B in Appendix B.
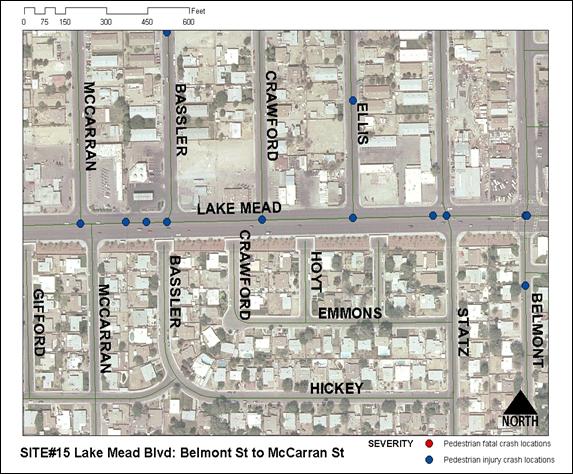
Figure 36: Aerial Photograph of Lake Mead Boulevard: Belmont Street to McCarran Street
Some of the identified problems are high percentage of elderly pedestrian crashes, motorists failing to yield, pedestrians not waiting for signals/acceptable gaps, and high proportions of nighttime crashes.
The proposed countermeasures to address these problems are “Danish offset,” “Median refuge,” “High visibility crosswalk,” “Advance yield markings,” “Yield here to pedestrians signs,” “ITS Automatic Detection Devices,” “Smart Lighting” and “Enhancer Pedestrians LED Signal.” The implementation plan for the proposed countermeasures at this location is shown in Table 59.
| Treatments | Stage 1 | Stage 2 | Stage 3 |
|---|---|---|---|
| Relocated bus stop locations and crosswalks | O | O | O |
| High visibility crosswalk | O | O | O |
| Median refuge | O | O | O |
| Danish offsets | O | O | O |
| Advance yield markings + sign yield to pedestrians | O | O | O |
| Smart Lighting | X | X | |
| ITS automatic pedestrian detection devices | X | X | |
| Enhancer Pedestrian LED signal | X |
O – Installed
X – Not Installed
The Lake Mead Boulevard site from Belmont Street to McCarran Street is a mid-block location. Multiple countermeasures were installed in a single stage at this location
Stage 1 Countermeasure Deployment
Countermeasures deployed during this stage are Danish offset, Median refuge, High visibility crosswalk, Advance yield markings and “Yield Here to Pedestrian” signs. These countermeasures are installed between January 29 and February 2, 2007. The after condition data for Stage 1 countermeasure deployment are collected between February 26 and March 2, 2007. Figure 37 and Figure 38 show the countermeasures deployed in stage 1 at this location.
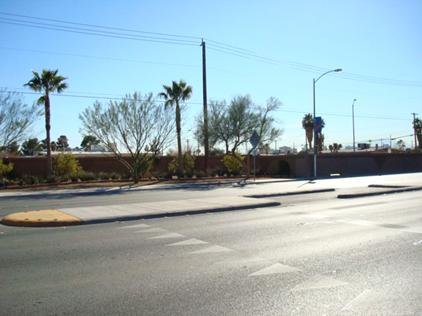
Figure 37: High Visibility Crosswalk Treatment, Danish Offset and Median Refuge
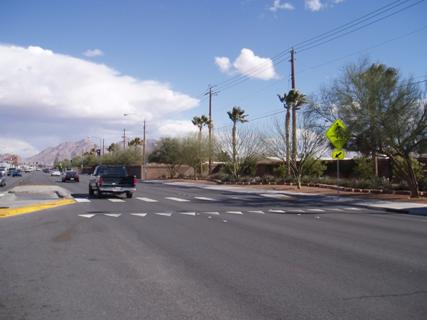
Figure 38: Advanced Yield Markings installed at Lake Mead Boulevard:
Belmont Street to McCarran Street
The various pedestrian and motorist MOEs and the summarized results are shown in Tables 60 and 61 respectively. The mobility MOEs are shown in Table 62. The results of the statistical tests for the safety and mobility MOEs comparing the baseline conditions with stage 1 are shown in Table 63 and 64, respectively.
15.5.1 Pedestrian MOEs
From Table 60, it is clear that the percent of pedestrians who look for vehicles before beginning to cross and before crossing second half of the street increased from 0.96 and 0.92 to 1.00, and 1.00, respectively. The percent of captured pedestrians decreased from 100 percent to 84 percent, but the percent of diverted pedestrians increased from zero to 16 percent. There is drastic a decrease in the proportion of pedestrians trapped in the roadway from 0.62 to 0.05 after stage 1.
| Measures of Effectiveness
(Safety) |
Baseline | Stage 1 | ||
|---|---|---|---|---|
| Sample = 61 | Sample = 123 | |||
| NB | Percent | N1 | Percent | |
| Percent pedestrians who look for vehicles before beginning to cross | 59 | 96 | 123 | 100 |
| Percent pedestrians who look for vehicles before crossing 2nd half of street | 56 | 92 | 123 | 100 |
| Percent of captured pedestrians | 61 | 100 | 103 | 84 |
| Percent of diverted pedestrians | 0 | 0 | 20 | 16 |
| Percent of pedestrians trapped in the roadway | 38 | 62 | 7 | 5 |
15.5.2 Motorist MOEs
Table 61 shows that proportion of drivers yielding to pedestrians from baseline to stage 1 increase from 0.03 to 0.40. There is an increase in the proportion of drivers stopping/yielding at a distance less than 10 feet. A nominal increase is also observed in the percent of drivers blocking the crosswalk in stage 1 compared to baseline period.
| Measures of Effectiveness (Safety) |
Baseline | Stage 1 | |||
|---|---|---|---|---|---|
| Sample = 296 | Sample = 117 | ||||
| NB | Percent | N1 | Percent | ||
| Percent of drivers yielding to pedestrians | 8 | 03 | 46 | 40 | |
| Sample = 8 | Sample = 46 | ||||
| Distance driver stops/yields before crosswalk | < 10 ft | 2 | 25 | 15 | 39 |
| 10-20 ft | 6 | 75 | 22 | 49 | |
| >20 ft | 0 | 0 | 9 | 19 | |
| Sample = 296 | Sample = 117 | ||||
| Percent of drivers blocking crosswalk | – | 3 | 6 | ||
15.6.1 Pedestrian Delay
The baseline data indicates that the average pedestrian delay is 21.43 sec/ped. The average pedestrian delay is reduced by 11.90 sec/ped from baseline conditions to stage 1.
15.6.2 Vehicle Delay
The average vehicle delay in the baseline period is 0.24 sec/veh and in stage 1, the deTable 62: Delays at Lake Mead Boulevard: Belmont Street to McCarran Streetlay is 2.16 sec/veh. Table 62 shows the comparison of average vehicle delay at stage 1 and baseline.
| Measures of Effectiveness (Mobility) |
Baseline | Stage 1 | ||
|---|---|---|---|---|
| Sample | Delay | Sample | Delay | |
| Average pedestrian delay (sec/ped) | 61 | 21.43 | 84 | 9.53 |
| Average vehicle delay (sec/veh) | 296 | 0.24 | 117 | 2.16 |
15.7.1 Safety MOEs
There is no significant increase in the percent of pedestrians who look for vehicles before beginning to cross and percent of captured pedestrians in stage 1 compared with baseline data (P>0.05). The MOEs that have significant effect include the following: increase in the percent of pedestrians who look for vehicles before crossing second half of the street, and the percent of diverted pedestrians in stage 1 compared with baseline (P<0.05). The reduction in the percent of pedestrians trapped in the roadway in stage 1 is also statistically significant (P<0.001).
The results provide evidence that there is a significant increase in the percent of drivers yielding to pedestrians in stage 1 compared to the baseline period (P<0.001). There is a significant increase in the number of drivers stopping/yielding at a distance greater than 20 feet after the installation of countermeasures mentioned in stage 1 (P<0.001). The complete results of the statistical analyses of safety MOEs for pedestrians and drivers are shown in Table 63.
15.7.2 Mobility MOEs
Table 64 provides the summary of the tests for statistical significance of the results obtained for pedestrian and vehicle delays. This table shows that there is a significant decrease in the average pedestrian delay in stage 1 compared to baseline (P=0.001). There is no statistical evidence that the decrease in average vehicle delay is significant (P>0.05).
| Measures of Effectiveness (Safety) |
Baseline vs. Stage 1 | |||
|---|---|---|---|---|
| PB – P1 | P-value | H0 | ||
| MOEs below are tested for H0: Pbefore= Pafter vs. Ha: Pafter > Pbefore | ||||
| Percent pedestrians who look for vehicles before beginning to cross | -0.03 | >0.05 | Do not Reject | |
| Percent pedestrians who look for vehicles before crossing 2nd half of street | -0.08 | <0.05 | Reject | |
| Percent of captured pedestrians | 0.16 | >0.05 | Do not Reject | |
| Percent of diverted pedestrians | -0.16 | <0.001 | Reject | |
| Percent of drivers yielding to pedestrians | -0.36 | <0.001 | Reject | |
| Distance driver stops/yields before crosswalk | <10 ft | -0.07 | >0.05 | Do not Reject |
| 10-20 ft | 0.27 | >0.05 | Do not Reject | |
>20 ft |
-0.19 | <0.001 | Reject | |
| MOE below is tested for H0: Pbefore= Pafter vs. Ha: Pafter > Pbefore | ||||
| Percent of pedestrians trapped in the roadway | 0.56 | <0.001 | Reject | |
| Measures of Effectiveness (Mobility) |
Baseline vs. Stage 1 | ||
|---|---|---|---|
| PB – P1 | P-value | H0 | |
| MOEs below are tested for H0: Pbefore= Pafter vs. Ha: Pafter > Pbefore | |||
| Average pedestrian delay (sec/ped) | 11.90 | 0.001 | Reject |
| Average vehicle delay (sec/veh) | -1.92 | >0.05 | Do not Reject |
The results clearly show the impact of the deployed countermeasures in reducing the waiting time of the pedestrians before beginning to cross and the time spent in the middle of the roadway. Maryland Parkway and Dumont Street is a location with similar countermeasures installed without advance yield markings and “Yield Here to Pedestrian” signs in stage 1. The results at both the sites indicate that the countermeasures are effective in increasing the safety of the pedestrians by decreasing the percent of trapped pedestrians in roadway and increasing the drivers yielding behavior.
| < Previous | Table of Content | Next > |

