U.S. Department of Transportation
Federal Highway Administration
1200 New Jersey Avenue, SE
Washington, DC 20590
202-366-4000
| < Previous | Table of Content | Next > |
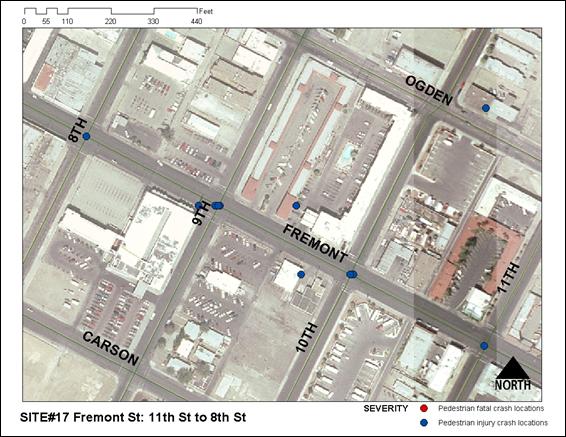
Figure 41: Aerial Photograph of Fremont Street: 11th Street to 8th Street (Control Site)
Land use adjacent to the corridor includes hotels, casinos and other commercial activities. The location is within the jurisdiction of the City of Las Vegas. Fremont Street is classified as a minor arterial and the posted speed limit is 25 mph. As per 2006 traffic count statistics, the ADT at Fremont Street is 13,800 along this corridor. Figure 42 presents the aerial photograph of the site. Implementation plan and conceptual designs of this site are presented in Site 18 in Appendix B.
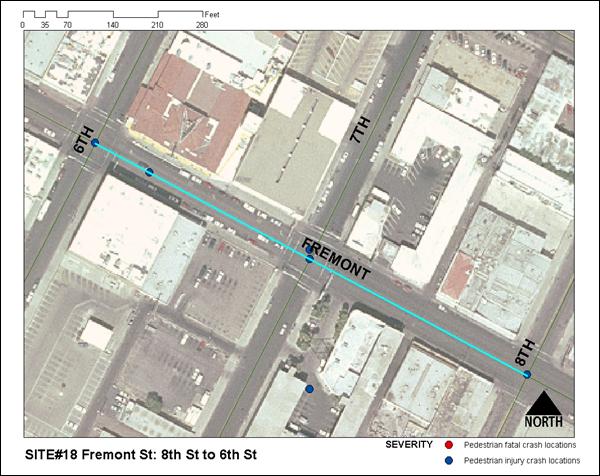
Figure 42: Aerial Photograph of Fremont Street: 8th Street to 6th Street
Some of the problems identified at Fremont Street from 8th Street to 6th Street are pedestrians not using the crosswalks, a high percentage of elderly pedestrians involved in crashes, and pedestrians failing to yield. Speeding is a key observed problem at this corridor.
A “Portable speed trailer” is proposed for this location. The installation of portable speed trailers is expected to make motorists aware of the posted speed limit and their current speed. The speed trailers are intended to help motorists to reduce their speed. The other countermeasures at this site include “In-roadway knockdown signs” and “Pedestrian call button that confirm press.” The implementation plan for the proposed countermeasures at this location is shown in Table 67.
| Treatments | Stage 1 | Stage 2 | Stage 3 |
|---|---|---|---|
| Portable speed trailers | O | X | X |
| In-roadway knockdown signs | O | O | |
| Pedestrian call buttons that light up | O |
O – Installed
X – Countermeasure removed
Various countermeasures are deployed in three stages and data are collected on weekdays at Fremont Street between 6th Street and 8th Street.
Stage 1 Countermeasure Deployment
Countermeasure deployed during this stage is “Portable speed trailer.” This countermeasure is installed between January 1 and 28, 2006. The after condition data for stage 1 countermeasure deployment is collected on February 16, 2006. Figure 43 shows the countermeasures deployed in stage 1 at this location.
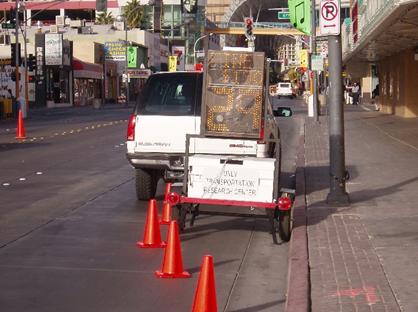
Figure 43: Portable Speed Trailer on Fremont Street
Stage 2 Countermeasure Deployment
Countermeasures deployed during this stage are “In-roadway knockdown signs.” This countermeasure is installed on April 25, 2006. The after condition data for stage 2 countermeasure deployment are collected on May 16, 2006. Figure 44 shows the countermeasures deployed in stage 2 at this location.
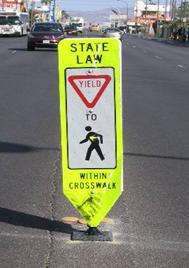
Figure 44: In-Roadway Knockdown Signs
Stage 3 Countermeasure Deployment
Countermeasures deployed during this stage are “Pedestrian button that confirm press.” This countermeasure is installed between September 25 and 29, 2006. The after condition data for stage 3 countermeasure deployment is collected on December 19, 2006. Figure 45 shows the countermeasures deployed in Stage 3 at this location.
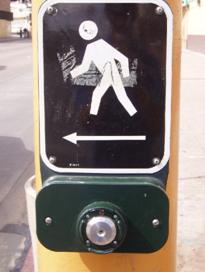
Figure 45: Pedestrian Push Button that Confirm Press
The results of the pedestrian and motorist MOEs are summarized in Tables 68, and 69 respectively. The average pedestrian delay at this site for each stage is shown in Table 70. The statistical significance of the results obtained for all the stages is shown in Tables 71 and 72.
18.5.1 Pedestrian MOEs
Table 68 shows that all of the observed pedestrians look for vehicles before beginning to cross the roadway during all the stages including baseline period. No pedestrians are observed as trapped in the roadway in the baseline period. The proportion of the pedestrians violated the signal in the baseline condition is about 0.17. The proportion of pedestrians who begin their crossing during WALK phase during the baseline period is almost negligible. The deployment of portable speed trailer increases the proportion of pedestrians trapped very slightly. The proportion of pedestrians violating the signal reduced to 0.15 percent in stage 1 compared to the baseline. The installation of in-roadway knockdown signs in stage 2 increases the proportion of pedestrians who begin their crossing during WALK phase to 0.79. However, stage 1 data are not available for this MOE to compare the incremental effect from stage 1 to stage 2. Proportion of signal cycles in which the call button has been pushed is 0.18 in stage 2. The installation of pedestrian push button that confirm press increases the proportion of signal cycles in which call button has been pushed to 0.39 percent. The proportion of pedestrian signal violation decreases to 0.09 in stage 3 compared to other stages. Proportion of pedestrians are trapped in the roadway in stage 3 is negligibly small.
18.5.2 Motorist MOEs
From Table 69, the proportion of drivers yielding to pedestrians is 0.67 during baseline period. About 0.06 proportions of the observed drivers blocks the crosswalk during the same period. Proportion of the drivers stop/yield to pedestrians away from the stop bar is about 0.20. The installation of the speed trailer in stage 1 eliminates all the drivers from blocking the crosswalk. The proportion of drivers yielding to pedestrians decreased to 0.43 in stage 1. In stage 2, almost all of the drivers yield to pedestrians, and only 0. 16 proportions of the drivers block the crosswalk. There are no pedestrians observed to have trapped in the roadway in stage 3.
| Measures of Effectiveness
(Safety) |
Baseline | Stage 1 | Stage 2 | Stage 3 | ||||||||
|---|---|---|---|---|---|---|---|---|---|---|---|---|
| Sample | NB | Percent | Sample | NB | Percent | Sample | NB | Percent | Sample | NB | Percent | |
| Percent of pedestrians trapped in the roadway | 716 | 0 | 0 | 517 | 5 | 1 | 437 | 9 | 2 | 275 | 1 | 0.4 |
| Percent of pedestrians who look for vehicles before beginning to cross | 716 | 716 | 100 | 517 | 517 | 100 | 437 | 437 | 100 | 275 | 275 | 100 |
| Frequency of pedestrian signal violation | 716 | 125 | 17 | 517 | 78 | 15 | 437 | 63 | 14 | 275 | 24 | 9 |
| Percent of pedestrians who begin their crossing during WALK phase | 1013 | 11 | 1 | – | – | – | 202 | 159 | 79 | 248 | 176 | 71 |
| Percent signal cycles in which call button has been pushed | – | – | – | – | – | – | 202 | 36 | 18 | 174 | 67 | 39 |
| Measures of Effectiveness
(Safety) |
Baseline | Stage 1 | Stage 2 | Stage 3 | |||||||||
|---|---|---|---|---|---|---|---|---|---|---|---|---|---|
| Sample | NB | Percent | Sample | NB | Percent | Sample | NB | Percent | Sample | NB | Percent | ||
| Percent of drivers yielding to pedestrians | 96 | 64 | 67 | 28 | 12 | 43 | 26 | 25 | 96 | 22 | 18 | 82 | |
| Distance driver stops/yields before crosswalk | at crosswalk | 64 | 41 | 64 | 12 | 0 | 0 | 25 | 13 | 52 | 18 | 9 | 50 |
| between crosswalk and stop bar | 64 | 10 | 16 | 12 | 11 | 92 | 25 | 7 | 28 | 18 | 5 | 28 | |
| away from stop bar | 64 | 13 | 20 | 12 | 1 | 8 | 25 | 5 | 20 | 18 | 4 | 22 | |
| Percent of drivers blocking crosswalk | 161 | 10 | 6 | 12 | 0 | 0 | 25 | 4 | 16 | 22 | 0 | 0 | |
18.6.1 Pedestrian Delay
Table 70 shows the results and a comparison of the average pedestrian delay at this location for various stages. The average pedestrian delay at baseline period is 9.8 sec/ped. There is a reduction in average pedestrian delay in stage 1 compared to baseline data. The installation of in-roadway knockdown signs in stage 2 increased the pedestrian delay to 56.3 sec/ped. A reduction in this MOE is observed in stage 3 compared to stage 2, but increased compared to baseline and stage 1 data.
| Measures of Effectiveness (Mobility) |
Baseline | Stage 1 | Stage 2 | Stage 3 | ||||
|---|---|---|---|---|---|---|---|---|
| Sample | Delay | Sample | Delay | Sample | Delay | Sample | Delay | |
| Average Pedestrian Delay (sec/ped) | 716 | 9.79 | 517 | 7.29 | 437 | 56.25 | 275 | 11.62 |
18.7.1 Safety MOEs
The results of the statistical analyses are summarized in Table 71. They show that there is no significant change in the proportion of pedestrians who look for vehicles before beginning to cross in stage 1 compared to baseline period. There is no significant decrease in the proportion of pedestrians trapped in the roadway and frequency of pedestrian signal violation in stages 1 and 2 compared to the baseline results (P>0.05). The implementation of “pedestrian push button that confirm press” in stage 3 has a significant impact in increasing the percent of pedestrians who begin their crossing during WALK phase (P<0.001). This in turn resulted in decreasing the frequency of pedestrian signal violation (P<0.001) compared to the baseline data. It is also observed that there is a significant increase in the percent of signal cycles in which the call button has been pushed from stage 2 to stage 3 as shown in Table 73 (P<0.001). The percent of signal cycles in which call button has been pushed increased significantly in stage 3 compared to stage 2. There is a significant decrease in the percent of pedestrians trapped in the roadway and pedestrian signal violation in stage 3 compared to stage 2.
From Table 73, it is clear that there is no significant increase in the proportion of drivers yielding to pedestrians in stage 1 compared to baseline (P>0.05). However, there is a significant decrease in the proportion of drivers blocking crosswalk (P=0.001). Installation of in-roadway knockdown signs in stage 2 significantly increases the yielding behavior of drivers to pedestrians (P<0.001). There is not sufficient evidence to suggest the decrease in the percent of drivers stopping/yielding at crosswalk, and between crosswalk and stop bar in stage 2 compared to baseline conditions. However, the decrease in the percent of drivers stopping/yielding between crosswalk and stop bar in stage 2 compared to stage 1 is significant as shown in Table 75 (P<0.001).
| Measures of Effectiveness (Safety) |
Baseline vs. Stage 1 | Baseline vs. Stage 2 | Baseline vs. Stage 3 | ||||||
|---|---|---|---|---|---|---|---|---|---|
| PB – P1 | P-value | H0 | PB – P2 | P-value | H0 | PB – P3 | P-value | H0 | |
| MOEs below are tested for H0: Pbefore= Pafter vs. Ha: Pafter > Pbefore | |||||||||
| Percent of pedestrians who look for vehicles before beginning to cross | No change | No change | No Change | ||||||
| Percent of pedestrians who begin their crossing during WALK phase | – | – | – | -0.77 | <0.001 | Reject | -0.69 | <0.001 | Reject |
| MOEs below are tested for H0: Pbefore= Pafter vs. Ha: Pafter > Pbefore | |||||||||
| Percent of pedestrians trapped in the roadway | -0.009 | >0.05 | Do not Reject | -0.02 | >0.05 | Do not Reject | -0.003 | >0.05 | Do not Reject |
| Frequency of pedestrian signal violation | 0.02 | >0.05 | Do not Reject | 0.03 | >0.05 | Do not Reject | 0.08 | <0.001 | Reject |
| Measures of Effectiveness (Safety) |
Stage 1 vs. Stage 2 | Stage 2 vs. Stage 3 | ||||
|---|---|---|---|---|---|---|
| P1 – P2 | P-value | H0 | P2 – P3 | P-value | H0 | |
| MOEs below are tested for H0: Pbefore= Pafter vs. Ha: Pafter > Pbefore | ||||||
| Percent of pedestrians who look for vehicles before beginning to cross | No Change | No Change | ||||
| Percent of pedestrians who begin their crossing during WALK phase | – | – | – | 0.07 | >0.05 | Do not Reject |
| Percent signal cycles in which call button has been pushed | – | – | – | -0.20 | <0.001 | Reject |
| MOEs below are tested for H0: Pbefore= Pafter vs. Ha: Pafter > Pbefore | ||||||
| Percent of pedestrians trapped in the roadway | -0.01 | >0.05 | Do not Reject | 0.01 | <0.05 | Reject |
| Frequency of pedestrian signal violation | 0.006 | >0.05 | Do not Reject | 0.05 | <0.05 | Reject |
| Measures of Effectiveness (Safety) |
Baseline vs. Stage 1 | Baseline vs. Stage 2 | Baseline vs. Stage 3 | |||||||
|---|---|---|---|---|---|---|---|---|---|---|
| PB – P1 | P-value | H0 | PB – P2 | P-value | H0 | PB – P3 | P-value | H0 | ||
| MOEs below are tested for H0: Pbefore= Pafter vs. Ha: Pafter > Pbefore | ||||||||||
| Percent of drivers yielding to pedestrians | 0.23 | >0.05 | Do not Reject | -0.29 | <0.001 | Reject | -0.15 | >0.05 | Do not Reject | |
| Distance driver stops/yields before crosswalk | Away from stop bar | 0.11 | >0.05 | Do not Reject | 0.003 | >0.05 | Do not Reject | -0.01 | >0.05 | Do not Reject |
| MOEs below are tested for H0: Pbefore= Pafter vs. Ha: Pafter > Pbefore | ||||||||||
| Distance driver stops/yields before crosswalk | at crosswalk | 0.64 | <0.001 | Reject | 0.12 | >0.05 | Do not Reject | 0.14 | >0.05 | Do not Reject |
| Between crosswalk and stop bar | -0.76 | >0.05 | Do not Reject | -0.12 | >0.05 | Do not Reject | -0.12 | >0.05 | Do not Reject | |
| Percent of drivers blocking crosswalk | 0.06 | 0.001 | Reject | -0.09 | >0.05 | Do not Reject | 0.06 | 0.001 | Reject | |
| Measures of Effectiveness (Safety) |
Stage 1 vs. Stage 2 | Stage 2 vs. Stage 3 | |||||
|---|---|---|---|---|---|---|---|
| P1 – P2 | P-value | H0 | P2 – P3 | P-value | H0 | ||
| MOEs below are tested for H0: Pbefore= Pafter vs. Ha: Pafter > Pbefore | |||||||
| Percent of drivers yielding to pedestrians | -0.53 | <0.001 | Reject | 0.14 | >0.05 | Do not Reject | |
| Distance driver stops/yields before crosswalk | away from stop bar | -0.11 | >0.05 | Do not Reject | -0.02 | >0.05 | Do not Reject |
| MOEs below are tested for H0: Pbefore= Pafter vs. Ha: Pafter > Pbefore | |||||||
| Distance driver stops/yields before crosswalk | at crosswalk | -0.52 | >0.05 | Do not Reject | 0.02 | >0.05 | Do not Reject |
| Between crosswalk and stop bar | 0.63 | <0.001 | Reject | 0.002 | >0.05 | Do not Reject | |
| Percent of drivers blocking crosswalk | -0.16 | >0.05 | Do not Reject | 0.16 | <0.05 | Reject | |
18.7.2 Mobility MOEs
Results from Table 75 indicates that there is a significant decrease in the average pedestrian delay in stage 1 compared to baseline data (P<0.001). There is no significant reduction in pedestrian delay in any other stages compared with baseline as well as comparison between stages (Tables 75 and 76).
Installation of the countermeasures mentioned at this location has significant effect in improving some of the pedestrian safety MOEs. The installation of the portable speed trailer, in-roadway knockdown signs and pedestrian push button that confirm press has significant impacts in increasing drivers’ yielding behavior to pedestrians and reducing the drivers blocking the crosswalk in one or the other stages at this location.
| Measures of Effectiveness (Mobility) |
Baseline vs. Stage 1 | Baseline vs. Stage 2 | Baseline vs. Stage 3 | ||||||
|---|---|---|---|---|---|---|---|---|---|
| PB – P1 | P-value | H0 | PB – P2 | P-value | H0 | PB – P3 | P-value | H0 | |
| MOEs below are tested for H0: Pbefore= Pafter vs. Ha: Pafter > Pbefore | |||||||||
| Average Pedestrian Delay (sec/ped) | 2.5 | <0.001 | Reject | -46.5 | >0.05 | Do not Reject | -1.83 | >0.05 | Do not Reject |
| Measures of Effectiveness (Mobility) |
Stage 1 vs. Stage 2 | Stage 2 vs. Stage 3 | ||||
|---|---|---|---|---|---|---|
| P1 – P2 | P-value | H0 | P2 – P3 | P-value | H0 | |
| MOEs below are tested for H0: Pbefore= Pafter vs. Ha: Pafter > Pbefore | ||||||
| Average Pedestrian Delay (sec/ped) | -49.0 | >0.05 | Do not Reject | 44.60 | >0.05 | Do not Reject |
| < Previous | Table of Content | Next > |

