Pedestrian Safety Countermeasures Deployment and Evaluation: Las Vegas Case Study
Download Version
PDF [4.91 MB]
PPT [10.9 MB]
Slide 1
Shashi Nambisan
Director, InTrans & Professor of Civil Engineering
Iowa State University (shashi@iastate.edu)
Srinivas Pulugurtha, The University of North Carolina at Charlotte
Mukund Dangeti, University of Nevada, Las Vegas
Vinod Vasudevan, University of Nevada, Las Vegas
FHWA's
Pedestrian Safety Web Conference
Washington, DC
May 28, 2009
Slide 2
Goals
- Improve pedestrian safety, minimize risk
- Identify, develop, deploy, and evaluate countermeasures
- Case Study: Las Vegas metro area, Nevada
Slide 3
Introduction
- Significant growth for 20+ years
- Wide, fast street grid network
- High posted & operational vehicle speeds
- Widely used transit system
- High risk conditions for pedestrians
- Demographics
- Population ~ 1.8 million
- Diversity: age, race
- 85 percent of the crashes involved locals
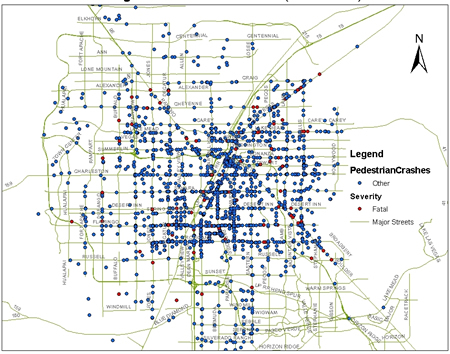
Slide 4
Pedestrian Crashes (2003 – 2006)
Slide 5
Methodology
- Identify candidate locations
- GIS based analysis
- Site characteristics
- Problem characteristics
- Develop, deploy, & evaluate countermeasures
- Measures of effectiveness
Slide 6
Study Design
- Before and after Studies
- Comparative studies (with control group)
- Data collection ( ~18,000 pedestrians)
- Statistical analyses
- Parametric
- Non-parametric
Slide 7
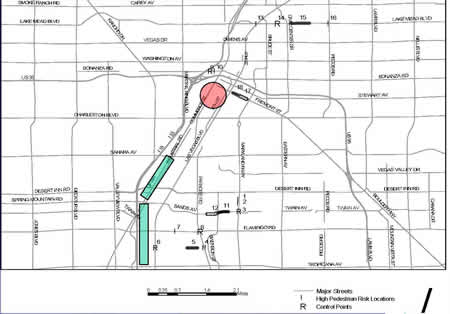
Study Locations
- Top priority / high risk locations
- Crash index and crash rank
- Site selection: 18 locations
- Includes 4 control locations
- Excluded the resort Corridor (The "Strip" and its proximity)
- Different jurisdictions
- City of Las Vegas
- City of North Las Vegas
- Clark County
- Nevada Dept of Transportation (State)
Slide 8
Study Locations
Slide 9
Selection of Countermeasures
- Site characteristics
- Geometric conditions
- Operating conditions
- Light conditions
- Demographics
- Land-use
- Costs
Slide 10
Countermeasures
- Engineering based countermeasures
- ITS based countermeasures
- Others
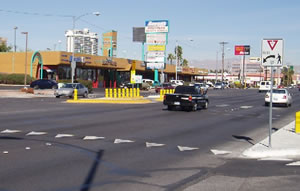
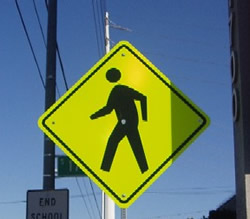
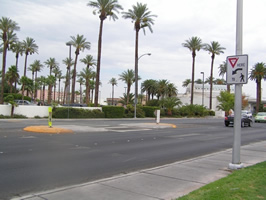
Slide 11
Advanced Warning Signs / Yield Markings
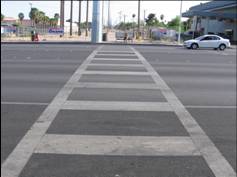
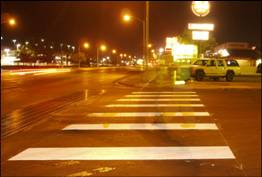
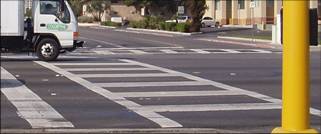
Slide 12
High Visibility Crosswalk Treatment
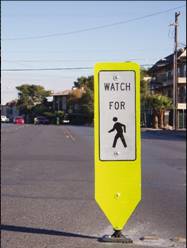
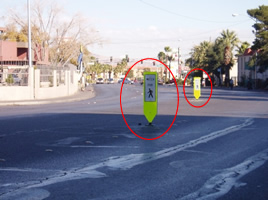
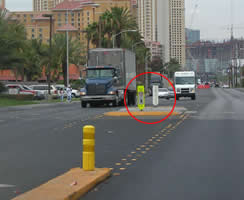
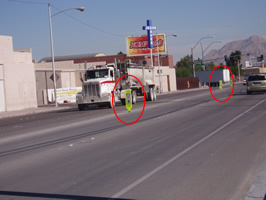
Slide 13
In-Roadway Knockdown Signs

Slide 14
Portable Speed Trailer
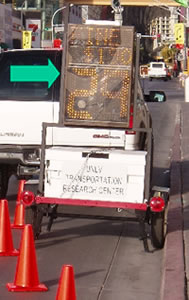
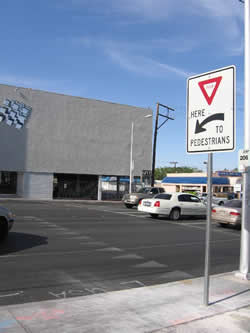
Slide 15
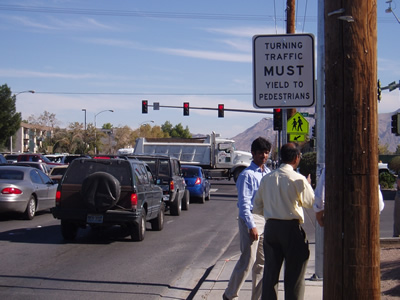
Turning Vehicles Yield to Pedestrians
Slide 16
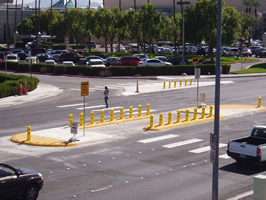
Danish Offset and Median Refuge
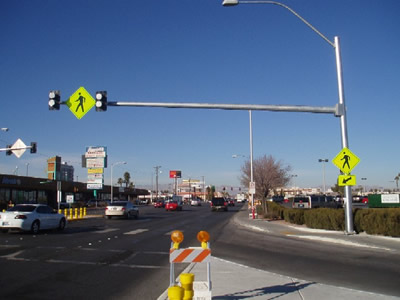
Slide 17
Pedestrian Activated Flashers
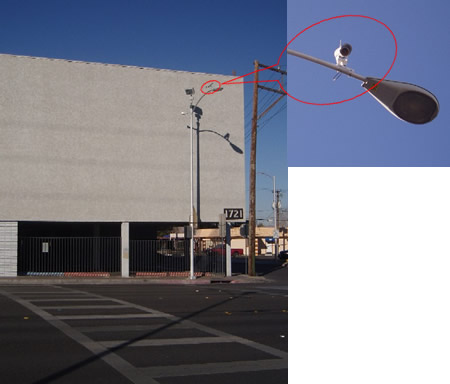
Slide 18
Automatic Pedestrian Detection and Smart Lighting
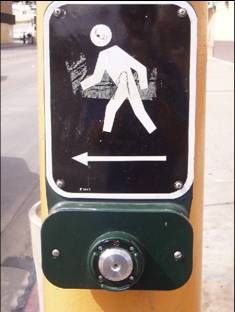
Slide 19
Pedestrian Buttons that Confirm "Call"
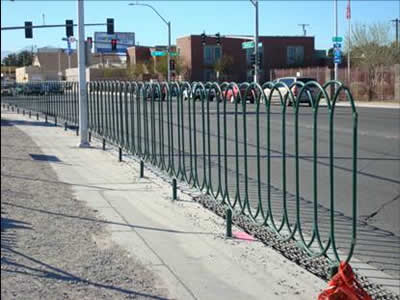
Slide 20
Pedestrian Channelization
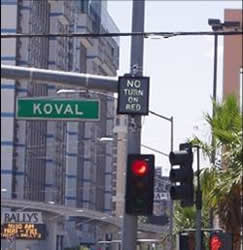
Slide 21
ITS No-Turn on Red Blank out Signs
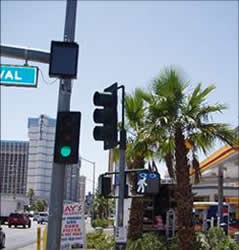
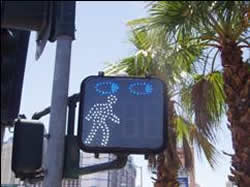
Slide 22
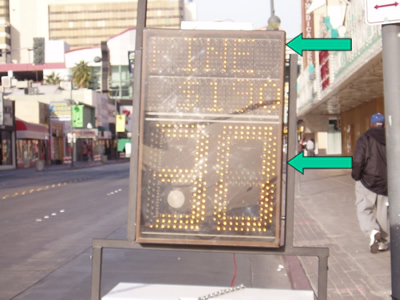
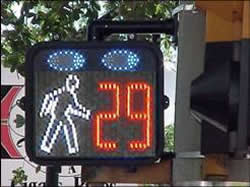
Pedestrian Countdown Timers with Animated Eyes
Slide 23
Measures of Effectiveness / Statistical Tests
- Pedestrian
- Using the crosswalk
- Captured / diverted
- Looking for cars before crossing
- Trapped in the middle of the street
- Pedestrian-vehicle Conflicts
- Pedestrian waiting for signal to cross
- Delay
- Driver
- Yielding behavior, distance
- Blocking crosswalk
- Speed
Slide 24
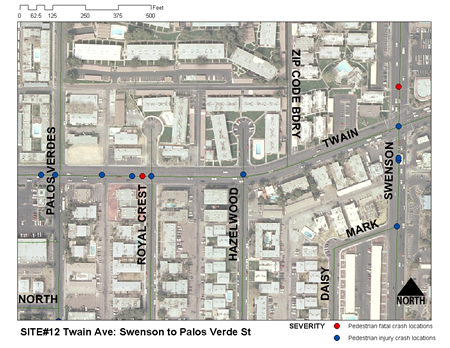
Speed Trailer Site Information
Slide 25
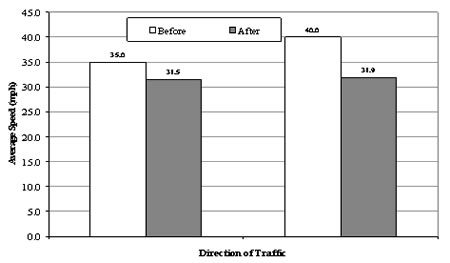
Speed Trailer and Vehicle Speeds
Slide 26
Speed Trailer: Vehicle Speeds Analysis
| MOE |
Baseline vs. Stage 1 |
Baseline vs. Stage 2 |
| Delta
Mean
Speed |
P-value |
H0 |
Delta
Mean
Speed |
P-value |
H0 |
| H0: Vbefore = Vafter vs. Ha: Vafter< Vbefore |
| Eastbound mph
(kmph) |
5.5
(8.9) |
<0.001 |
Reject |
8.1
(13.0) |
<0.001 |
Reject |
| Westbound mph
(kmph) |
6.5
(10.5) |
<0.001 |
Reject |
3.7
(6.0) |
<0.001 |
Reject |
Slide 27
Speed Trailer: Analysis of Pedestrians
| (Safety) Measures of Effectiveness
|
Baseline |
Stage 1 |
Stage 2 |
| Sample = 165 |
Sample = 47 |
Sample = 156 |
| Percent |
Percent |
Percent |
% pedestrians who look for vehicles
before beginning to cross |
80 |
100 |
100 |
% pedestrians who look for vehicles
before crossing 2nd half of street |
85 |
100 |
100 |
% pedestrians trapped in the
roadway |
41 |
34 |
37 |
Slide 28
Highly Effective Countermeasures
| Description |
Cost |
| Advanced Yield Markings for Motorists |
Low |
| In-roadway Knockdown Signs |
Low |
| Pedestrian Countdown Signals with Animated Eyes |
Medium |
| Danish Offset |
High |
| Median Refuge |
High |
| Portable Speed Trailer |
High |
| Pedestrian Activated Flashing Yellow |
High |
Slide 29
Moderately Effective Countermeasures
| Description |
Cost |
Pedestrian Call buttons that Confirm Call
(Visible/Audible confirmation) |
Low |
| Turning Vehicles Yield to Pedestrians |
Low |
| ITS No-Turn on Red Signs |
Medium |
ITS Automatic Pedestrian Detection
Devices |
High |
Slide 30
Countermeasures with Low Effectiveness
| Description |
Cost |
| Warning Signs for Motorists |
Low |
| High Visibility Crosswalk Treatment |
Medium |
| Pedestrian Channelization |
High |
| Smart Lighting |
High |
Slide 31
Summary
- Significant overall benefits
- Permitting & deployment considerations
- Administrative / jurisdictional hurdles
- Vendor / procurement difficulties
- Education needs: pedestrians, motorists
Slide 32
Acknowledgments
- US Dept of Transp., Federal Highway Admin
- Nevada Dept of Transportation
- Nevada Office of Traffic Safety
- Regional Transp Commission of So. Nevada
- Clark County, Nevada
- City of Las Vegas
- UNLV TRC: students, staff
Return to top

