U.S. Department of Transportation
Federal Highway Administration
1200 New Jersey Avenue, SE
Washington, DC 20590
202-366-4000
| < Previous | Table of Content | Next > |
Many professionals involved in pedestrian and bicycle programs have never received training that focuses on crash causation. Everyone – from traffic safety specialists to traffic engineers, planners, educators, and law enforcement personnel – can benefit from an understanding of how crashes occur and how to avoid them.
This lesson provides an understanding of crash characteristics, crash rates, exposure, and a grounding in crash typing. The most significant crash types will be explained and associated with contributing factors and typical errors made. The concepts of corridor and site crash analysis and team problem-solving will be emphasized. Discussion will include special conditions-especially nighttime crashes, those involving impaired drivers, pedestrians and bicyclists, and high-speed roadways.
The word "crash" may be new to some people as a way to describe the event in which a bicyclist or pedestrian greets the ground, a motor vehicle, or any other solid object in a way that can result in bodily harm and/or property damage. Historically, these were called "accidents." The term "accident" implies heavy doses of chance, unknown causes, and the connotation that nothing can be done to prevent them.
Crashes are preventable. Bicyclist and pedestrian "crashes" are not random events. They fall into a pattern of reoccurring crash types and occur because the parties involved make mistakes. The mistakes can be identified and counteracted through a combination of education, skill development, engineering, and enforcement measures so crashes can be substantially reduced.
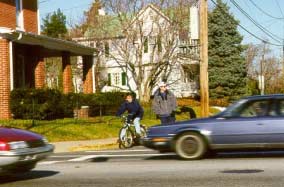
Whether you are a pedestrian, bicyclist, or motorist, you generally go through
a similar sequence of actions leading from searching for and recognizing a potential
crash situation to taking steps to avoid it.
The steps in this sequence are described below. If any of these steps are overlooked
by either party, a crash may result.
 Step
1: Search – Both driver and bicyclist or pedestrian scan their environment for
potential hazards.
Step
1: Search – Both driver and bicyclist or pedestrian scan their environment for
potential hazards.
Step 2: Detect – One or both parties (bicyclist, pedestrian, or motor vehicle) sees the other.
Step 3: Evaluate – The threat of collision is recognized, along with the need for action to avoid it.
Step 4: Decide – Assess risk and select the actions necessary to avoid a collision. This may involve judging location, closing speed, direction of travel, position in traffic, likely behavior, and other factors.
Step 5: Action – This step involves the successful performance of the appropriate action(s) to avoid a collision.
Approximately 6,500 pedestrians and 900 bicyclists are killed each year as a result of collisions with motor vehicles. As a group, pedestrians and bicyclists comprise more than 14 percent of all highway fatalities each year. Pedestrians account for as much as 40 to 50 percent of traffic fatalities in some large urban areas. The 1994 General Estimates System (GES) data indicate that 90,000 pedestrians and 60,000 bicyclists were injured in this type of crash. Many more injuries are not reported to record-keeping authorities. A study by Stutts, et al. (1990) showed that fewer than two-thirds of bicycle-motor vehicle crashes serious enough to require emergency room treatment were reported on State motor vehicle crash files.
In the 1996 study conducted by the Federal Highway Administration (Pedestrian and Bicycle Crash Types of the Early 1990's, FHWA-RD-95-163), 5,000 pedestrian and 3,000 bicycle crashes in 5 States were studied extensively in order to code crash types, determine the specific factors associated with the crash types, and to identify how countermeasures could be used to reduce the frequency of crashes. The following is a summary of the findings of the study. Pedestrian-Motor Vehicle Crash Sample Summary
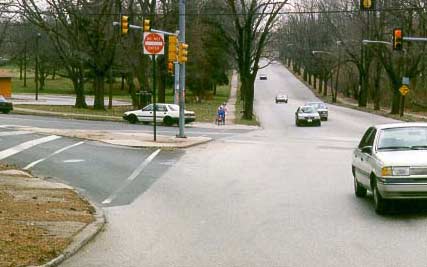
Forty-one percent of pedestrian crashes occur at intersections.
This portion of the lesson presents information specific to pedestrian and bicycle crashes. It looks at the number, types, and characteristics of these crashes. The information was generated through a study conducted by the Highway Safety Research Center at the University of North Carolina (published by the Federal Highway Administration in June 1996). The study purpose was to update 1970's era crash data to reflect more recent crash types, with particular attention to roadway and locational factors so that designers can reduce crash frequency through engineering methods and other interventions. See the following pages for examples.
Pages 4-6 through 4-9: Eight most common pedestrian crash types.
Pages 4-10 through 4-13: Eight most common bicycle crash types.
Design a program that specifically provides countermeasures aimed at reducing one (or more) common bicycle and/or pedestrian crash types. Countermeasures can include physical changes to the bicycle/pedestrian environment (engineered and constructed solutions), or education programs aimed at a particular audience that may be susceptible to certain crash types. Be specific about what the program would include, and how it would be implemented throughout a community. Include an explanation of how you would propose to evaluate the effectiveness of your program.
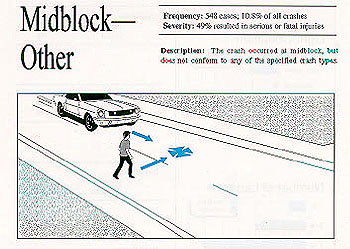
Frequency: 584 cases, 10.8% of all crashes
Severity: 49% resulted in serious or fatal injuries
Description: The crash occurred at midblock, but does not conform to any of
the specified crash types.
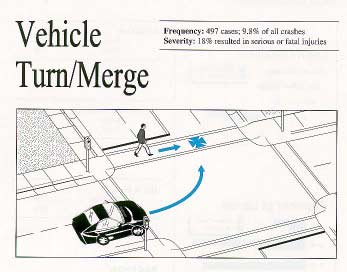
Description: The pedestrian and vehicle collided while the vehicle was preparing
to turn, in the process of turning, or had just completed a turn (or merge).
Frequency: 497 cases, 9.8% of all crashes
Severity: 49% resulted in serious or fatal injuries
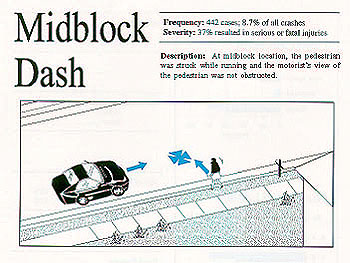
Description: At midblock location, the pedestrian was struck while running and
the motorist's view of the pedestrian was not obstructed.
Frequency: 442 cases, 8.7% of all cases
Severity: 37% resulted in serious or fatal injuries
Description: The pedestrian was struck while running through an intersection
and/or the motorist's view of the pedestrian was blocked until an instant before
impact.
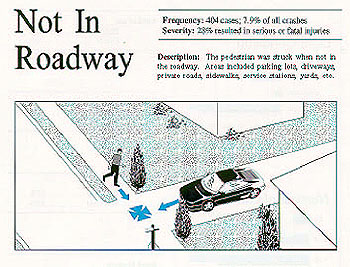
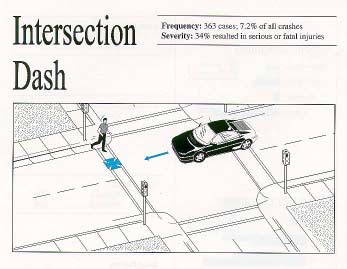
Frequency: 363 cases, 7.2% of all crashes
Severity: 34% resulted in serious or fatal crashes
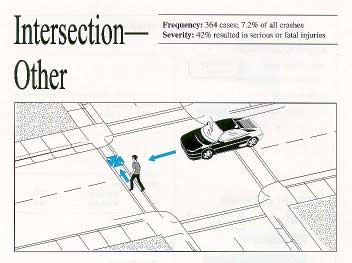
Description: The crash occurred at an intersection but does not conform to any
of the specified crash types.
Frequency: 364 cases, 7.2% of all crashes
Severity: 42% resulted on serious or fatal injuries
Description: The pedestrian was struck by a vehicle that was backing.
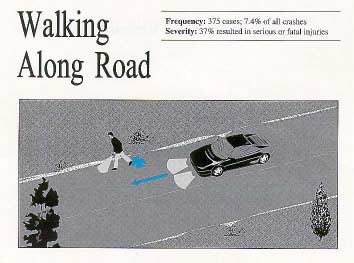
Frequency: 351 cases, 6.9% of all crashes
Severity: 23% resulted in serious or fatal injuries
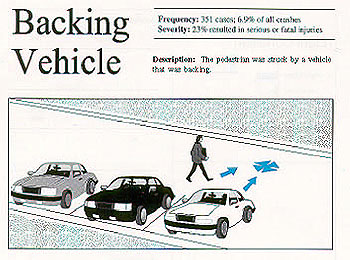
Figure 4.2: Eight of the Most Common Bicycle Crash Types.
Source: Bicycle Crash Types – A 1990's Informational Guide, 1997.
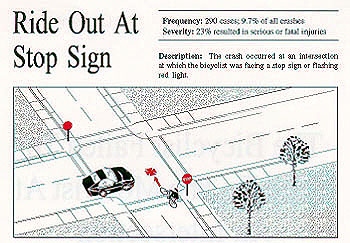
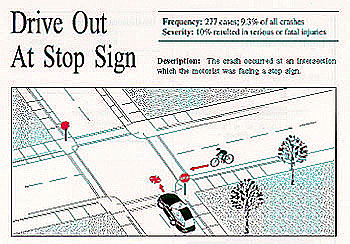
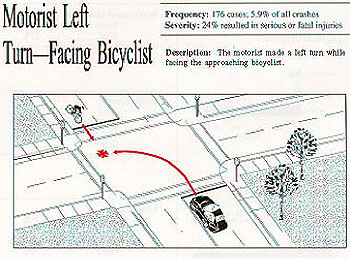
Description: The crash occurred at an intersection which the motorist was facing
a stop sign.
Frequency: 277 cases, 9.3% of all crashes
Severity: 10% resulted in serious or fatal injuries
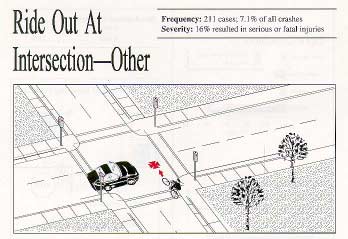
Description: The crash occurred at an intersection, signalized or uncontrolled,
at which the bicyclist failed to yield.
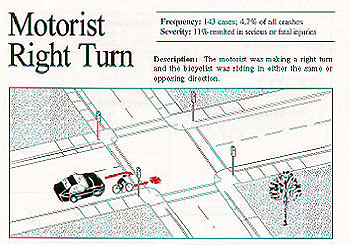
Frequency: 211 cases, 7.1% of all crashes
Severity: 16% resulted in serious or fatal injuries
For the purpose of providing some general background on the case study location, the following descriptive information is provided:
Data provided for conducting a case study evaluation of pedestrian and bicycle conditions at Piedmont Park include the following information:
Obtain pedestrian accident and bicycle crash data from your State DOT for a particular roadway or area of interest. You should obtain a minimum of 3 years of data in order to conduct your analysis of factors similar to those discussed in the Piedmont Park case study location. Although local city agencies sometimes maintain crash data, the State DOT is the most reliable source of available data. Most States maintain their crash data in a computerized database system and sorts of the data can be conducted on various field entries to list crashes associated with either pedestrians or bicycles. These types of crashes will only constitute a very small amount of the total crashes occurring along a roadway and it may be useful to receive a full listing of all the crashes associated with your location of interest.
DOT's may only maintain data along the more significant roadways and often do not include subdivision/residential streets.
Most DOT personnel are very helpful and willing to work to get you the data you need. You should clearly explain your intentions, location of interest, and type of data that you would like to obtain. Submitting a request in writing is typically required so that your data request can be efficiently processed through their system. In addition to the crash data, you may need other information that will allow you to decode the crash data and to physically link the crash to a location on the roadway network. An accident/crash investigation manual is usually available that lists all of the coded entries used in creating aggregated crash tabulations. Also, a roadway features log is typically available to link milepost listings to physical map features such as intersections, bridges, and street names. In the initial phases of conducting an analysis of crashes, it is seldom necessary to access the actual crash reports. It is much more useful to utilize aggregated crash records that are available through the crash data system. Allow ample time for DOT personnel to accommodate your request within their day-to-day workload. Generally, data can be received in 2 to 3 weeks after submitting a request.
Text and graphics for this section were derived from the following sources:
Drake and Burden, Pedestrian and Bicyclist Safety and Accommodation Participant Workbook, NHI Course #38061, FHWA-HI-96-028, 1996.
Federal Highway Administration, Bicycle Crash Types: A 1990's Informational Guide, FHWA-RD-96-163, 1997.
Federal Highway Administration, Pedestrian and Bicycle Crash Types of the Early 1990's, Technical Summary, FHWA-RD-95-163, 1996.
Federal Highway Administration, Pedestrian Crash Types: A 1990's Informational Guide, FHWA-RD-96-163, 1997.
Figure 4.3 Bicycle Crash Locations
| Year | No. |
|---|---|
| 1995 | 5 |
| 1996 | 4 |
| 1997 | 5 |
| Total | 14 |
Figure 4.4 Pedestrian Accident Locations
| Year | No. |
|---|---|
| 1995 | 5 |
| 1996 | 8 |
| 1997 | 8 |
| Total | 21 |
Figure 4.5 Site Location Map
Figure 4.6 Piedmont Park Vicinity – Atlanta, Georgia
Tabulation of Pedestrian Accident Data
| No. | Route Roadway | Mile Post | Time | Month | Day | Year | Severity | Location | Type | Light Condition | Surface Condition |
|---|---|---|---|---|---|---|---|---|---|---|---|
| 1 | 10th Street | 1.78 | 23:29 | 06 | 13 | 1997 | Injury | Intersection | Pedestrian | Dark-Lighted | Dry |
| 2 | 10th Street | 1.78 | 13:54 | 08 | 25 | 1997 | Injury | Intersection | Pedestrian | Daylight | Dry |
| 3 | 10th Street | 1.87 | 23:01 | 06 | 19 | 1997 | Injury (2) | Intersection | Pedestrian | Dark-Lighted | Dry |
| 4 | 10th Street | 1.99 | 19:19 | 02 | 06 | 1997 | Injury | Intersection | Pedestrian | Dark-Lighted | Dry |
| 5 | 10th Street | 1.99 | 17:26 | 07 | 08 | 1997 | Injury | Intersection | Pedestrian | Daylight | Dry |
| 6 | 14th Street | 0.06 | 15:00 | 04 | 04 | 1997 | Injury | Intersection | Pedestrian | Daylight | Dry |
| 7 | 14th Street | 0.06 | 18:00 | 03 | 03 | 1997 | Injury | Intersection | Pedestrian | Daylight | Dry |
| 8 | 14th Street | 0.00 | 9:30 | 06 | 10 | 1997 | Injury | Intersection | Pedestrian | Daylight | Dry |
| 9 | Monroe Drive | 5.71 | 16:12 | 09 | 21 | 1996 | Injury | Roadway Segment | Pedestrian | Daylight | Wet |
| 10 | 10th Street | 2.43 | 15:45 | 09 | 07 | 1996 | Injury | Intersection | Pedestrian | Daylight | Dry |
| 11 | 10th Street | 1.78 | 19:50 | 07 | 04 | 1996 | Injury | Intersection | Pedestrian | Daylight | Dry |
| 12 | 10th Street | 1.78 | 22:05 | 07 | 13 | 1996 | Injury | Intersection | Pedestrian | Dark-Lighted | Dry |
| 13 | 10th Street | 2.01 | 21:30 | 06 | 29 | 1996 | Injury | Roadway Segment | Pedestrian | Dark-Lighted | Dry |
| 14 | 14th Street | 0.00 | 17:10 | 08 | 05 | 1996 | Injury | Intersection | Pedestrian | Daylight | Dry |
| 15 | 14th Street | 0.06 | 13:00 | 03 | 13 | 1996 | Injury | Intersection | Pedestrian | Daylight | Dry |
| 16 | Piedmont Avenue | 1.01 | 22:20 | 04 | 25 | 1996 | Injury | Intersection | Pedestrian | Dark-Lighted | Dry |
| 17 | Monroe Drive | 5.97 | 23:06 | 02 | 10 | 1995 | Injury | Intersection | Pedestrian | Dark-Lighted | Wet |
| 18 | 10th Street | 1.64 | 18:20 | 01 | 11 | 1995 | Injury | Roadway Segment | Pedestrian | Dusk | Dry |
| 19 | 10th Street | 1.87 | 17:25 | 02 | 08 | 1995 | Injury | Intersection | Pedestrian | Daylight | Dry |
| 20 | 10th Street | 1.99 | 21:00 | 10 | 17 | 1995 | Injury | Intersection | Pedestrian | Dark-Lighted | Dry |
| 21 | 10th Street | 1.99 | 02:23 | 01 | 21 | 1995 | Injury (2) | Intersection | Pedestrian | Dark-Lighted | Dry |
Crash data provided by Georgia Department of Transportation.
Figure 4.7 Piedmont Park Vicinity - Atlanta, Georgia
Tabulation of Bicycle Crash Data
| No. | Route Roadway | Mile Post | Time | Month | Day | Year | Severity | Location | Type | Light Condition | Surface Condition |
|---|---|---|---|---|---|---|---|---|---|---|---|
| 1 | Monroe Drive | 5.14 | 19:00 | 09 | 17 | 1997 | Injury | Intersection | Angle Intersecting | Daylight | Dry |
| 2 | 10th Street | 1.78 | 12:20 | 03 | 14 | 1997 | Injury | Intersection | Angle Intersecting | Daylight | Dry |
| 3 | 10th Street | 1.78 | 17:32 | 08 | 29 | 1997 | Injury | Intersection | Angle Intersecting | Daylight | Dry |
| 4 | 10th Street | 1.87 | 17:43 | 03 | 11 | 1997 | Injury | Intersection | Head On | Daylight | Dry |
| 5 | 14th Street | 0.00 | 18:10 | 12 | 17 | 1997 | Injury | Intersection | Angle Intersecting | Dark-Lighted | Dry |
| 6 | Monroe Drive | 4.85 | 01:15 | 05 | 05 | 1996 | Injury | Intersection | Rear End | Dark-Lighted | Dry |
| 7 | 10th Street | 1.78 | 15:33 | 12 | 18 | 1996 | PDO | Intersection | Sideswipe Same Dir | Daylight | Dry |
| 8 | 10th Street | 1.78 | 18:30 | 12 | 27 | 1996 | PDO | Intersection | Angle Intersecting | Dark-Lighted | Dry |
| 9 | 10th Street | 1.87 | 21:45 | 02 | 09 | 1996 | PDO | Intersection | Angle Intersecting | Dark-Lighted | Dry |
| 10 | Monroe Drive | 5.81 | 17:15 | 09 | 02 | 1995 | PDO | Roadway Segment | Angle Intersecting | Daylight | Dry |
| 11 | 10th Street | 1.78 | 12:22 | 02 | 23 | 1995 | Injury | Intersection | Angle Intersecting | Daylight | Dry |
| 12 | 10th Street | 1.99 | 16:40 | 09 | 29 | 1995 | Injury | Intersection | Angle Intersecting | Daylight | Dry |
| 13 | 10th Street | 1.99 | 17:50 | 08 | 03 | 1995 | Injury | Intersection | Angle Intersecting | Daylight | Dry |
| 14 | 14th Street | 0.00 | 17:45 | 09 | 11 | 1995 | Injury | Intersection | Rear End | Daylight | Dry |
PDO = Property Damage Only
Crash data provided by Georgia Department of Transportation.
Figure 4.8 Piedmont Park Vicinity - Atlanta, Georgia
Human Powered Transportation (HPT) Modes
HPT Usage Data Collected at Major Park Entrances
| Total for all intersection movements (1) | ||||||
|---|---|---|---|---|---|---|
| No. | Entrance Location | Time of Day | Bicyclists | Rollerbladers (2) | Pedestrians (3) | Total HPT Activity |
| 1(4) | Piedmont Ave. at 14th St. | 4:25 - 4:40 pm | 3 | 2 | 22 | 27 |
| 1(4) | Piedmont Ave. at 14th St. | 5:00 - 5:15 pm | 2 | 3 | 29 | 34 |
| 2 | Piedmont Ave. at 12th St. | 4:40 - 4:55 pm | 6 | 4 | 12 | 22 |
| 3 | 10th St. at Charles Allen Dr. | 5:20 - 5:35 pm | 3 | 6 | 42 | 51 |
| 4 | Park Ave. at Elmwood Dr. | 5:40 - 5:55 pm | 7 | 5 | 18 | 33 |
Notes:
Figure 4.9 Piedmont Park Vicinity - Atlanta, Georgia
Summary of Major Roadways
| No. | Entrance Location | Mileposts | No. of lanes | Speed Limit | 1997 ADT | Total Length (miles) |
|---|---|---|---|---|---|---|
| 1 | Piedmont Ave. |
0.65 to 1.01 1.01 to 1.93 |
|
35 mph 35 mph |
11,700 26,400 |
1.28 |
| 2 | 10th Street | 1.56 to 2.68 | 4 | 35 mph | 20,420 | 1.12 |
| 3 | 14th Street Section 1 Section 2 |
0.00 to 0.23 0.00 to 0.06 |
4 4 |
35 mph 35 mph |
22,400 17,500 |
0.29 |
| 4 | Monroe Drive | 4.85 to 5.97 | 4 | 35 mph | 20,500 | 1.12 |
| < Previous | Table of Content | Next > |

