U.S. Department of Transportation
Federal Highway Administration
1200 New Jersey Avenue, SE
Washington, DC 20590
202-366-4000
| < Previous | Table of Contents | Next > |
The MUTCD considers the two treatments in this section as "experimental" and does not approve them for general use. Review the Introduction section of this publication (ABOUT THE MUTCD), which advises agencies to get FHWA approval before installing any experimental treatment. Agencies wishing to use either of these treatments, should visit http://mutcd.fhwa.dot.gov for information on how to submit a request for experimentation.
Description
As shown below, Optical Speed Bars are transverse stripes spaced at gradually decreasing distances. The rationale for using them is to increase drivers’ perception of speed and cause them to reduce speed. The Optical Speed Bar name comes from this intended visual effect on drivers’ speed as they react to the spacing of the painted lines. These white transverse stripes are 18 in long and 12 in wide. The preferred material is thermoplastic because of the exposure to traffic volume over time.
Application Guideline
Optical Speed Bars are applied almost exclusively to road segments where vehicles traveling at highway speeds are required to slow for curves or other instances where traffic speeds should be reduced. To date, the treatment has been restricted to known accident locations or situations requiring traffic to significantly reduce speed. Agencies should avoid applying Optical Speed Bars just to reduce traffic speed because overuse could jeopardize the visual effect of the treatment.
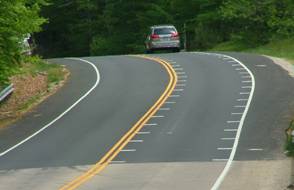
Photo: Courtesy of Virginia Department of Transportation
Optical Speed Bars used to reduce vehicle speed.
Design
Various Optical Speed Bars are designed and spaced to produce a gradual slowing from a vehicle’s initial approach speed to the reduced curve speed. As spacing between bars gradually narrows, drivers sense they have increased speed and will slow down to keep the 4-bar/sec spacing. For example, think about an applied layout designed to slow a vehicle from 55 mi/h (81 ft/sec) into a 35-mi/h (51 ft/sec) curve. The initial bar separation distance is 81÷4 or 20 ft, and the final separation distance is 51÷4 or 13 ft. The table below shows New York Department of Transportation applied spacing between successive bars designed to cause drivers to reduce vehicle speed from 65 mi/h to 30 mi/h.
Example Spacing Between Sequential Pairs of Optical Speed Bars.
Bars |
Spacing (ft) |
Bars |
Spacing (ft) |
Bars |
Spacing (ft) |
|---|---|---|---|---|---|
1-2 |
24 |
11-12 |
19 |
21-22 |
15 |
2-3 |
23 |
12-13 |
19 |
22-23 |
15 |
3-4 |
23 |
13-14 |
19 |
23-24 |
15 |
4-5 |
23 |
14-15 |
18 |
24-25 |
14 |
5-6 |
22 |
16-17 |
18 |
26-27 |
13 |
6-7 |
22 |
16-17 |
18 |
26-27 |
13 |
7-8 |
21 |
17-18 |
17 |
27-28 |
13 |
8-9 |
21 |
18-19 |
16 |
28-29 |
12 |
9-10 |
21 |
19-20 |
16 |
29-30 |
12 |
10-11 |
20 |
20-21 |
16 |
30-31 |
12 |
The total length of the paving-marking segment depends upon the speed difference (from the approach and to the lower curve speed) the application is designed to produce. The following table suggests approximate lengths. Use these lengths as guidelines. The basis for the numbers is the need to produce a comfortable speed reduction and provide drivers with a minimum 4 seconds of driving time within the painted marking segment length.
Guideline for Length (ft) of Speed Bar Segment in Advance of Curve.
|
|
Approach Speed, mi/h |
|||||
|---|---|---|---|---|---|---|---|
|
|
45 |
50 |
55 |
60 |
65 |
70 |
Curve Speed, mi/h |
15 |
300 |
385 |
470 |
565 |
670 |
785 |
20 |
275 |
350 |
440 |
535 |
640 |
755 |
|
25 |
235 |
315 |
405 |
500 |
600 |
720 |
|
30 |
|
270 |
360 |
450 |
560 |
670 |
|
35 |
|
|
300 |
400 |
500 |
620 |
|
40 |
|
|
|
335 |
440 |
555 |
|
45 |
|
|
|
|
370 |
480 |
|
50 |
|
|
|
|
|
405 |
|
Effectiveness
Studies by New York, Mississippi, and Texas show transverse pavement markings can effectively reduce mean speeds, 85th percentile speeds, and speed variance. Initial 85th percentile speed reductions varied from 0 to 5 mi/h. However, their long-term effectiveness is not known. The Virginia Department of Transportation (VDOT) was conducting a comprehensive study of Optical Speed Bars as this publication was being prepared; the results are expected early 2007.
Cost
Based on a VDOT 2006 estimate, cost to install the marking on two directions is approximately $2,000 (labor and materials).
Contacts and Further Information
Gene Arnold, Virginia Transportation Research Council, Virginia Department of Highways; Phone: (434) 293-1990, E-mail: gene.arnold@vdot.virginia.gov
Description
PennDOT has experimented with an innovative pavement marking designed to alert motorists that they are approaching a curve and should slow down. Referred to as the "PennDOT Curve Advance Marking," this treatment involves two transverse bars, a SLOW legend, and an arrow indicating the direction of the upcoming curve. PennDOT developed the treatment to address driver behavior at locations identified as having a high number or rate of curve-related crashes. The device objective is that reducing the upper percentile speed will reduce the number of run-off-road crashes.
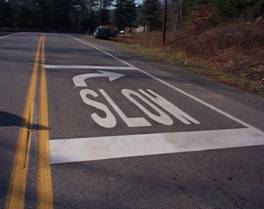
PennDOT curve advance marking.
Application Guideline
The PennDOT Advanced Curve Warning marking is designed for two-lane locations having a high number of curve-related crashes. Agencies should avoid any location where there is any potential for driver confusion because of intersecting roadways or driveways. Agencies applying advanced curve warning at a location should also bring all existing signs, delineation, and pavement markings to standard, and consider posting an advisory speed limit.
As with any treatment used with multiple or compound curves, treat the most hazardous curve first.
Design
See the detailed design layout below. The chart on the following page indicates the distance of the marking from the point of curvature based on posted speed and posted warning speed. Designers used MUTCD Table 2C-4, Column B to calculate distance, L, to the advance warning sign.
Agencies can adjust the curve marking location when it is not plainly visible to the driver because of vertical geometry or other similar sight distance problems.
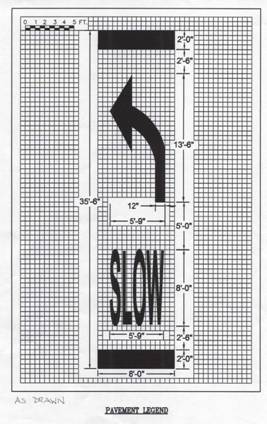
Source: Pennsylvania Department of Transportation
Effectiveness
This device has been shown to reduce overall speeds by 6 to 7 percent with slight reductions in the proportion of high-speed traffic in curves. Its effect on crash reduction is not yet established.
Contacts and Further Information
William Crawford, Pennsylvania Department of Transportation, Phone: (717) 705-1437 wicrawford@state.pa.us
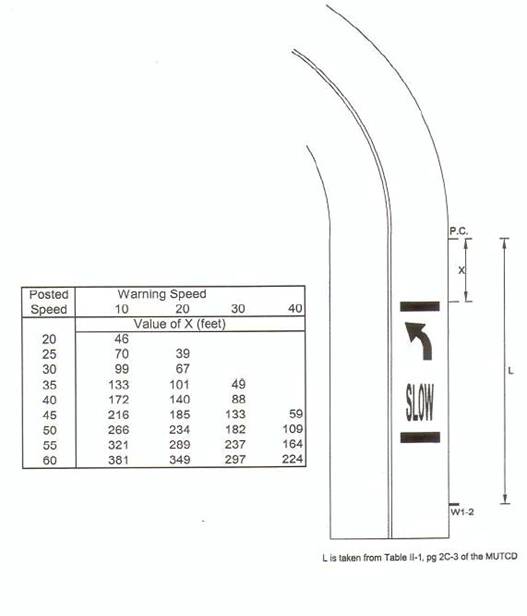
Distance from the point of curvature based on posted speed and posted warning speed.
| < Previous | Table of Contents | Next > |

