U.S. Department of Transportation
Federal Highway Administration
1200 New Jersey Avenue, SE
Washington, DC 20590
202-366-4000
Best for printing: PDF Version (1.08 MB)
In this issue:
National Roadway Safety Awards: Honoring Programs and Solutions for Improving Roadway Safety
Road Right-Sizing – A Brief Look into Road Diet Usage in Austin, TX
New Report Summarizes Pedestrian and Bicyclist Road Safety Assessments Initiative
"New and Improved" Roadway Safety Data Dashboard Now Live!
New Guidebook on Safety Data for Transportation Planners Now Available!
FHWA Seeks Partners for Unpaved Road Safety Pooled Fund Study
FHWA/NHTSA Release New State Traffic Records Coordinating Committee Noteworthy Practices
FHWA Peer Exchange Testimonial: Embracing the Local Road Practitioner
Developing a Guide for Safety Data Management
NEW! Companion Guide to the Handbook for Designing Roadways for the Aging Population
New Safety Analysis of Freeways and Interchanges Workshop
Minnesota "Mumble Strips" Show Promise – Analysis Underway
Highlights from the 2014 HSIP National Summary Report
Highway Safety Information System – VI: Template for the Future
FHWA Releases 2015 Version of Interactive Highway Safety Design Model
Kentucky Most Recent State to Join Lifesaving "Yellow Dot" Program

Welcome to Volume 10 of the Safety Compass newsletter! Ten years ago, then Associate Administrator for Safety Jeff Lindley introduced the first ever issue of the Safety Compass, inviting safety professionals, partners, and other stakeholders to share information on tools and success stories to help the safety community develop and implement effective highway safety programs and projects.
You did, and we have.
The past decade has seen numerous achievements in highway safety, and we as a community of safety professionals have made great strides toward realizing the goal of zero deaths on our Nation's roadways.
For example, back in 2005 there were a reported 9,188 intersection and intersection-related fatalities in the country, and an article in the first issue of the Safety Compass talked about how FHWA was analyzing non-traditional intersection designs to reduce that number. Four years later, and with the assistance of the FHWA safety program, 2009 saw the completion of the Nation's first diverging diamond interchange in Springfield, MO–a milestone project that resulted in a 72 percent reduction in injury crashes and 46 percent reduction in all crashes in its first year of operation. As 2015 comes to a close, States will have opened at least 60 diverging diamond interchanges, with many more planned for the future.
Looking back, there were a total of 43,443 fatal crashes in our country in 2005. The latest FARS data indicate there were 32,675 people killed in crashes on U.S. roadways in 2014 – a 25 percent decrease from 2005. This means that over the last decade, due in large part to our collective efforts, thousands of people got home safely. However, we firmly believe that even one death is one too many, and it will take all of us working together to continue to drive this number down.
I thank all of you for your contributions to the Safety Compass over the last decade. The articles you have written, the case studies you have featured, and the research you have shared have made the newsletter a go-to source for the latest information on highway safety innovations. And I repeat the invitation: please continue to share information on your innovative programs and projects with your peers in safety through the Safety Compass. Working together, we will further build on our successes and will save even more lives on our Nation's roadways.
[ Return to list of contents. ]
By: Tara McLoughlin, FHWA Office of Safety, and Stephanie Sneary, Leidos

The 2015 National Roadway Safety Awards ceremony was held Monday, November 16 at the Rayburn House Office Building on Capitol Hill to honor exemplary highway safety projects and programs from across the country. The biennial awards recognize excellence in engineering-based solutions to improve roadway safety and stresses the importance of strategic, data-driven approaches that can be replicated elsewhere. The awards were conferred in two categories: Infrastructure and Operational Improvements and Program Planning, Development, and Evaluation.
"The roadway safety innovations that we recognize here today address key obstacles facing our country as we look to modernize our transportation infrastructure," said U.S. Deputy Secretary of Transportation Victor Mendez. "I commend all of today's winners for their efforts to enhance safety and save lives on our nation's roadways."
Since 1998, FHWA and the Roadway Safety Foundation have partnered to sponsor this prestigious, national awards program. Every 2 years, this program honors the "best of the best" based on criteria including effectiveness, innovation, and efficient use of available resources. Brief summaries of each winning project follow with more detailed descriptions appearing in the National Roadway Safety Awards 2015 Noteworthy Practices Guide, available at: http://safety.fhwa.dot.gov/roadwaysafetyawards/2015/npg_2015.pdf
Arkansas: Improving Interstate Safety with Pavement Surface Treatments. Arkansas improved interstate safety with pavement surface treatments to reduce deaths and injuries in wet weather conditions. In 4 years, the improved pavement texture lowered wet-weather crashes from 70 to 5, a 93 percent reduction on a 4-mile segment of Arkansas' Interstate 30.
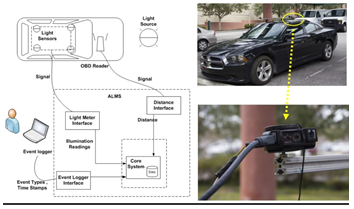
Florida: Advanced Lighting Measurement System. Florida's Advanced Lighting Measurement System has fundamentally changed how the State collects road lighting data by allowing data collection rates 300 times greater than traditional methods. The data helps the State identify areas of risk when comparing low light conditions to the number of crashes in a particular area.
Michigan: Statewide Non-Freeway Rumble Strip Initiative. Through this initiative, Michigan installed rumble strips on all non-freeway high-speed and rural roads from 2008-2010. This led to a 47 percent reduction in total target crashes (head-on, sideswipe opposite and run-off-the-road left) and a 51 percent reduction in fatal crashes when comparing 3 years of crash data following the installation to before the rumble strips were installed.
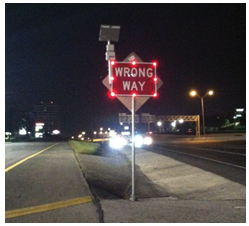
Texas: San Antonio TransGuide Wrong-Way Driver Project. San Antonio TransGuide, a partnership of Texas DOT, City of San Antonio, and VIA Metropolitan Transport, implemented illuminated warning signs and real-time alerts to law enforcement using radar-based sensors that detect the direction, speed, and location of wrong-way drivers. The project decreased the number of wrong-way events by 31 percent on the 15-mile segment of US 281 with the highest occurrence for wrong-way crashes.
Virginia: Road Diets in Reston. Virginia DOT implemented Road Diets on 2-mile segments of Lawyers Road and Soapstone Drive. These sections of roadway each carry about 10,000 vehicles per day and were prone to excessive speeding. After project completion, crashes decreased by 69 percent on Lawyers Road and 67 percent on Soapstone Drive.
Montana: Road Departure Study and Safety Information Management System. Montana conducted a road departure study to analyze factors contributing to the State's 70 percent rate of fatal crashes due to lane departure. The State then used its Safety Information Management System software to screen its rural on-system roadway network for specific areas of concern, develop solutions to address these areas, and enhance data access through easy querying capabilities and storage of roadway characteristics needed for performance analysis.
Washington: 2014 County Safety Program. Washington's program requires counties to develop data-driven local road safety plans before applying for Highway Safety Improvement Program funding. Washington State DOT provided counties with training and a summary of data that prioritized crash types, roadway characteristics, and conditions in comparison to other counties. Nearly 80 percent of Washington's 39 counties submitted safety plans, resulting in the funding of high-priority locations around the State and increased local agency engagement.
Virginia: Deployment of HSIP Projects Using Virginia-Specific Safety Performance Functions. Virginia DOT engineers developed a tool to determine the expected performance level of a roadway and compared these expected levels to the actual, observed performance to identify the potential for safety improvement (PSI). Locations with the greatest PSI were generally rated as the highest priority, allowing the deployment of safety projects in locations where they will do the most good.
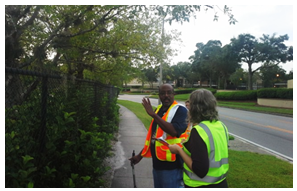
Florida: Texas-Americana Road Safety Small Area Study. The Department of Public Works in Orange County, FL, conducted a small area study to evaluate a cluster of intersections and roadways in the Texas-Americana neighborhood with high crash rates. The multi-modal Road Safety Audit the county conducted revealed infrastructure issues and behavioral needs resulting in a bicycle helmet promotion and giveaway, a community forum to present the findings to the public, and the identification of low-cost maintenance activities such as sidewalk repair and vegetation management to improve the safety of the area.
Florida: Safe Mobility for Life Coalition. Florida's Safe Mobility for Life Coalition works to identify both engineering and behavioral solutions to improve safety, access, and mobility for Florida's aging population. The coalition addresses infrastructure modifications, increased visibility, pedestrian-friendly intersections, advanced signing, human factors, education, and training. Ten key emphasis areas guide the work of the coalition, and several metrics are in place to measure its success.
[ Return to list of contents. ]
By: Becky Crowe, FHWA Office of Safety
Road Diets are modern countermeasures used to improve safety and livability near parks, schools, and other pedestrian and cyclist-utilized locations. To gain a better understanding of Road Diets, the City of Austin, TX conducted an analysis of 37 Road Diet projects that have been installed since 1999 to determine the safety and mobility impacts of these projects.
Road Diets, also called "right-sizing projects," are recognized as a best-practice tool for maintaining motor vehicle capacity while reducing high-risk speeding and addressing safety concerns for pedestrians and cyclists. These projects are typically installed in coordination with routine street maintenance, which has enabled a cities like Austin to implement Road Diets at roughly one-tenth the cost of stand-alone Road Diet implementation projects.
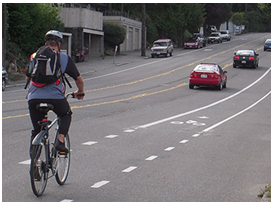
The City of Austin has joined Secretary Foxx's Safer People, Safer Streets challenge, which highlights the ongoing commitment to mobility and safety for all modes of transportation. Road Diet implementations in Austin within the last 5 years have resulted in improved safety for all users with minimal or no impact to motor vehicle level of service.
The Austin Transportation Department (ATD) routinely analyzes the city's streets for opportunities to improve safety and mobility for all road users. ATD's goal is to create safe and complete networks for everyone, and it acknowledges the reality that the large-scale expansion of streets is not financially feasible. ATD makes data-driven decisions about the city's existing roadway assets and uses Road Diets to rebalance underutilized space, improving the efficiency of Austin's streets in the process. Potential Road Diet projects are selected for analysis for a number of different reasons, including the need for improved safety or to provide space for other modes of travel. Austin has selected high-crash locations for these analyses. In addition, Austin citizens or neighborhood associations can request Road Diets in order to improve safety on their neighborhood streets.
Analyses of the impact of Road Diets involves the study of a "change of operations" at intersections and on arterials as well as changes in crashes and other safety characteristics such as pedestrian and cyclist perceptions of safety. Of the 37 total projects completed in Austin since 1999, 32 were on roads with fewer than 15,000 average daily users. Austin has proven that road diets can be used effectively on low-volume roads to improve safety while maintaining mobility.
ATD now regularly includes public involvement and outreach in recognition of the value gained from engaging and gathering input from citizens who use these streets on a daily basis. After implementation of a Road Diet project, ATD observes traffic operations and responds to citizen phone calls and 311 requests to ensure successful implementation. Before and after studies are completed to ensure impacts are realized. Areas of study in Austin include traffic volumes, travel times, peak hour operations, motor vehicle speeds, and crash histories.
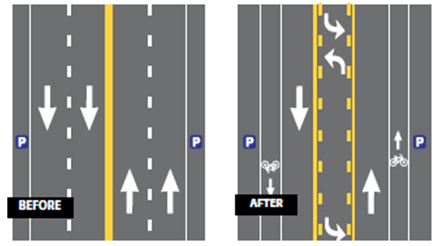
Road Diet conversions have been implemented for more than three decades. Still, this type of conversion is relatively unusual and new to most transportation professionals, local jurisdictions, and the traveling public. Education and outreach play a critical role in the success of a Road Diet.
The Austin experience has repeatedly demonstrated that Road Diet projects can accommodate the same motor vehicle volumes, avoid increases in travel time, reduce high-risk speeding, and reduce collisions.
To learn more about Road Diets, download the Road Diet Case Studies Guide at http://safety.fhwa.dot.gov/road_diets/case_studies/roaddiet_cs.pdf. To learn more about Road Diets in Austin Texas, read the full Austin Transportation Department Lane Conversion report at: http://austintexas.gov/sites/default/files/files/Lane_Conversion_Report_2015-06-01.pdf
By Gabe Rousseau, FHWA Office of Safety
Recent years have seen a rise in pedestrian and bicyclist fatalities, and to help reverse this unfortunate trend, Secretary Foxx launched the Safer People, Safer Streets initiative in fall of 2014 (see https://www.transportation.gov/safer-people-safer-streets). The Safer People, Safer Streets initiative aims to make communities safer for walking and bicycling. As part of the initiative, Secretary Foxx also charged USDOT field offices to conduct at least one on-the-ground pedestrian or bicyclist safety assessment in each State before the end of May 2015. FHWA Division Offices led 36 of 52 total assessments (i.e., all 50 States plus the District of Columbia and Puerto Rico). Field offices for the Federal Transit Administration, National Highway Traffic Safety Administration, Federal Motor Carrier Safety Administration, and Federal Railroad Administration led the remaining 16.
In late October 2015, the USDOT released a report describing the assessments, and the benefits of conducting them (find the report at http://www.transportation.gov/ped-bike-safety/pedestrian-and-bicyclist-safety-assessment-report). More than 1,500 people, including elected officials, field office leaders, and representatives from local, regional, State, Federal, and non-governmental agencies took part in the assessments. The assessments were intended to facilitate and encourage relationship building between people who work for different jurisdictions and who share responsibility for creating safer streets. This initiative was also intended to help U.S. DOT promote assessments as an effective tool for improving pedestrian and bicycle safety.
U.S. DOT has a long history of supporting on-the-ground assessments, ranging from formal pedestrian and bicycle road safety audits (RSAs), to neighborhood walkabouts, because such assessments can provide substantial benefits to all road users while improving safety. The report also highlights some of the ways that communities used the assessments to better understand and address some of the barriers and the resources that local communities and the U.S. DOT can use, both at the physical and programmatic levels, to continue working to improve safe walking and bicycling throughout the Nation.
You can read what Deputy Secretary Mendez wrote in the Fast Lane blog about the report's release at https://www.transportation.gov/fastlane/collaboration-helps-improve-pedestrian-and-bicyclist-safety. Find out more about pedestrian and bicycle RSAs at http://safety.fhwa.dot.gov/ped_bike/tools_solve/
[ Return to list of contents. ]
By: Danielle Betkey, FHWA Office of Safety
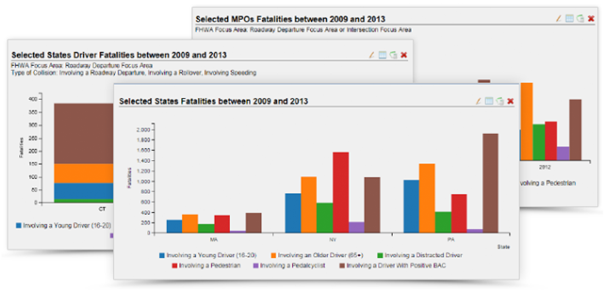
The FHWA Office of Safety recently launched the "new and improved" Roadway Safety Data Dashboard, available at: https://rspcb.safety.fhwa.dot.gov/SafetyCOP.aspx. The data dashboard has been completely redesigned to improve usability and expand the capabilities of the site. Since fatality data can be very complex, the dashboard allows users to convert data into graphical displays that make it easier to see trends and make comparisons between States, metropolitan planning organizations (MPO), and regions. Using data from the Fatality Analysis Reporting System (FARS), users are able to generate charts and graphs to display the data elements that describe the crash, the vehicle, and the people involved.
Some of the exciting NEW features enable users to:
The Office of Safety will continue to make updates by adding new features and data to the data dashboard to ensure this tool is beneficial and valuable to our safety partners. We are also interested in your feedback, so please visit https://rspcb.safety.fhwa.dot.gov/noteworthy/feedback_dashboard.aspx and let us know (good or bad) what you think about the data dashboard, what data or features would you like to see added, and any issues you may have experienced when creating your dashboard. For more information, please contact Danielle Betkey at Danielle.Betkey@dot.gov.
[ Return to list of contents. ]
The Federal Highway Administration has released a new guidebook entitled Applying Safety Data and Analysis to Performance-Based Transportation Planning. This guidebook provides State and regional planners with information on how to effectively use safety data and analysis tools in performance-based transportation planning and programming processes.
The safety data and analysis results help States DOTs and regional transportation agencies determine safety goals, objectives, measures, and targets. Qualitative and quantitative analyses are essential to understanding safety issues and needs; and to effectively planning and programming projects and strategies. This guidebook will help transportation planners understand the types of safety data they need and how to access them; analysis questions to consider; and opportunities to use the data and analysis to inform planning and programming decisions. Real and hypothetical examples are included throughout the guidebook to demonstrate approaches to addressing each of these topics.
The guidebook is available from: http://safety.fhwa.dot.gov/tsp/fhwasa15089/. For more information, please contact Chimai Ngo at chimai.ngo@dot.gov.[ Return to list of contents. ]
By: Gabe Rousseau and Rosemarie Anderson, FHWA Office of Safety
In 2012 there were more than 1.3 million miles of unpaved road in the United States, accounting for almost 35 percent of the more than 4 million miles of roadway in the Nation. Unpaved roads only account for about 2.4 percent of fatalities nationally, but in some States these roadways account for up to 20 percent of road fatalities. All but four States reported fatal crashes on unpaved roads in 2012.
Because reductions in serious injury and fatal crashes throughout a State's entire transportation system are a primary goal of State departments of transportation (DOTs), achieving reductions in unpaved roadway injuries must be addressed.
Decreasing fatalities requires the consideration of safety improvements on the local roadway system. In many States, a large percentage of roadways on the local system have an unpaved surface.
Several trends are likely impacting the number of crashes recorded along unpaved roadways. These trends include lack of maintenance, ex-urban development (i.e., a semi-rural region lying adjacent to a city's suburbs), larger agricultural equipment, and the conversion of paved roadways to unpaved roadways. Several safety improvements that have proven to address safety on paved roadways may also be appropriate for unpaved roadways; however, many improvements are not appropriate. This has left large gaps in agencies' ability to address safety on unpaved roadways.
The objectives of the pooled fund effort are to conduct traffic safety research for unpaved roads with the ultimate goal of producing findings that will assist agencies in reducing fatalities and serious injuries on these roads. In order to do this, the following activities will be undertaken by the study participants:
The study will also create a platform for Federal, State, Tribal and local practitioners to share information, stay informed of current safety-related research, and collaborate to initiate new research of importance on unpaved roads.
For more information about the study, please visit http://www.pooledfund.org/Details/Solicitation/1419.
[ Return to list of contents. ]
By: Esther Strawder, FHWA Office of Safety, and Kara Beach, VHB
The USDOT Traffic Records Coordinating Committee (TRCC), FHWA Office of Safety, and NHTSA Office of Traffic Records and Analysis recently collaborated to develop the State Traffic Records Coordinating Committee Noteworthy Practices guide. The Guide was developed using a case study approach collected through interviews with State TRCCs along with the expertise of an advisory group.
In 2013 and 2014, participants in the Traffic Records Forum TRCC Roundtable Sessions identified common issues and barriers experienced by State TRCCs. This Guide strives to address these issues and more by recognizing practices common to successful TRCCs and recommending actions for States to consider for implementation. In addition, an appendix on funding sources–both existing and potential–speaks to one of the most commonly cited barriers.
The Guide is intended to assist State traffic record coordinators, chairs, and members in evaluating their TRCCs and identifying strategies most applicable to their needs. However, the Guide's target audience is not limited to those directly engaged in State TRCCs. Stakeholders, partner agencies, and other interested parties are also encouraged to use the Guide to identify potential strategies for partnering and opening dialogues with their State TRCC or traffic records agencies.
The case study and interview approach revealed several key themes consistent among the participating State TRCCs, including performance assessment, strategic planning and TRCC improvement, and management. The themes are further broken down into specific noteworthy practices, described in detail by the Guide and illustrated in the case studies. Although the participating TRCCs differed in structure, size, and approach, each TRCC engaged in a combination of the practices.
Performance assessment includes traffic records assessments and self-assessment. TRCCs are required to undergo a traffic records assessment on a 5-year cycle in order to maintain eligibility for grants, yet several of the participating State TRCCs go beyond the requirements. For instance, one State reported annually reviewing its strategic plan. Others undergo self-assessments to routinely gauge their performance and monitor project status. States accomplished ongoing assessments differently. Some hired dedicated coordinators to monitor the TRCC, others surveyed members and potential members, and several established sub-committees and ad-hoc committees to address specific issues identified through the assessments.
Strategic planning is closely tied to performance assessment, and TRCCs are required at minimum to approve a State Traffic Records Strategic Plan. Highly effective TRCCs take additional steps to play an active role in strategic planning, thereby helping their States go beyond project-driven plans by establishing quantitative goals and system-wide data quality performance metrics. Additionally, there are several TRCCs that use action plans within the Strategic Plans to track progress and provide regular status updates to the full committee. The more effective State committees also develop vision and mission statements that outline the TRCCs' purpose and guide the decision-making processes associated with goal setting and action planning.
Finally, the Guide reports that effective TRCCs are often a reflection of effective management. This broad umbrella term refers to several noteworthy practices, such as an emphasis on relationship building, foundational documents such as memoranda of understanding between partner agencies, and establishing TRCC support. The participating States all functioned well within varying structures–single-tier, two-tier, and support committees–but each has identified authority positions responsible for decision making. Another similarity is that all the TRCCs developed foundational documents, although some have undertaken formal charters or agreements while others operate effectively on a less structured level.
Under the management theme, each TRCC emphasized the importance of relationship building and maintenance. Several TRCCs described meeting formats in which all attendees are allotted time to report out and feel comfortable asking questions or challenging decisions. One State uses a website to post upcoming meeting agendas and dates, as well as presentations from previous meetings. The website is linked to a university partner that produces and posts data reports publicly.
The Guide draws attention to the commonalities among many of the noteworthy practices identified through the interviews. For example, cultivating strong relationships among TRCC members is both a noteworthy practice of effective TRCCs and an outcome of clearly defined roles and purposes, ongoing strategic planning and project planning, and leadership that fosters and maintains relationships. Similarly, effective TRCCs use self-assessments to monitor progress toward action plans and identify the need for ad hoc committees to address special issues when they arise.
State TRCCs should approach these noteworthy practices as a menu of options rather than a prescription. One size does not fit all–the practices identified in the Guide are adaptable to the specific needs and goals of individual States.
For more details on these noteworthy practices and steps for enhancing State TRCCs, download a complete copy of the Guide at: http://safety.fhwa.dot.gov/rsdp/downloads/trcc_noteworthy.pdf. Please contact Esther Strawder at Esther.Strawder@dot.gov for more information.
[ Return to list of contents. ]
By: Richie Beyer, PE, Elmore County Engineer, Alabama
I have been fortunate to have participated in a number of peer exchange events related to safety over the years. Each event has been a wonderful and humbling experience as I have had the privilege of representing my county and State in an environment full of great professionals from across our Nation. These engaged professionals aren't afraid to share their experiences, good or bad, with the group about how they have tackled or are currently coping with similar safety issues.
This past September I had another one of those opportunities, as FHWA held a peer exchange in Nashville, TN, to share information and promote the systemic safety implementation approach. When I was asked to share my perspective about the event, I considered writing about the multitude of different practices and methods used by the States that participated, but I felt compelled to share a few of the overarching thoughts that I came away with from the meeting.
First, I have left each of these exchanges in awe of the professionalism exhibited. Whether it is the FHWA staff facilitating the meetings or the State DOT and local representatives, these individuals' commitment and dedication to safety never ceases to amaze me. I have always come away pondering the ways I can improve our efforts for the citizens we serve. The energy and ideas I receive out of these events improve the way I perform my job and provide a catalyst in many cases to re-energize our efforts on the home front. While the outcomes of attending these events may be difficult to measure in dollars, having the additional knowledge and tools to prevent even a single fatality makes the effort invaluable.
Second, I have witnessed an evolution in transportation safety practices since 2005, when I was asked to serve as the county engineer representative on our State's SHSP development committee. Since that time, I have witnessed safety programs in general utilize data more efficiently and proactively to prevent fatalities rather than react to fatal hot spots. The most recent peer exchange I attended was about improving safety using the systemic safety approach, a concept that was not initially embraced. There were few who truly had systemic methodologies in place, but it is becoming standard practice. Being able to witness and participate in this positive movement toward improving the public's safety has been very enlightening for me.
My final thought is centered around the makeup of the participants in these peer exchanges. Too many times, we as local government representatives hear how FHWA's mission is geared to support State DOTs. Although this relationship is one of great importance, very few trips take place only on State and Federal roads. Local roads and bridges dominate the landscape of our country, accounting for 75 percent of our Nation's road network. Through these peer exchanges, it is refreshing to see how FHWA has ensured inclusion of local governments in the process so that the citizens are afforded roads and bridges that are exemplars of best practices in roadway safety, regardless of who owns and maintains these roads. FHWA is fostering an environment where it is the norm to include local road practitioners in discussions on roadway safety side-by-side with their State and Federal partners. As a "local," that has been a refreshing transition, and I can only hope that the trend continues in the future.
[ Return to list of contents. ]
By: Stuart Thompson, FHWA Office of Safety
Now more than ever, managing a transportation safety program involves understanding the costs and benefits of investing in data management strategies that improve data quality, allow for advanced analysis capabilities, and support data-driven decision-making processes. To help safety program managers with the complexities of today's safety data management, FHWA has embarked on a project focusing on data management and governance processes that will assist States in developing, enhancing, managing, maintaining, and governing effective safety data systems.
The project has two main goals:
The guide will focus primarily on safety data, which includes the crash, roadway inventory, and traffic volume data used by safety managers and engineers for safety analysis tools, decision-making, planning, and reporting purposes. The purpose of the guide is to develop practical and systematic instructions for State DOTs to follow when establishing a Safety Data Business Plan that results in improved management and governance of safety-related data to support decision making.
The seven steps presented in the Guide for State DOT Safety Data Business Planning (see figure) help safety program managers and engineers improve their safety data programs through:
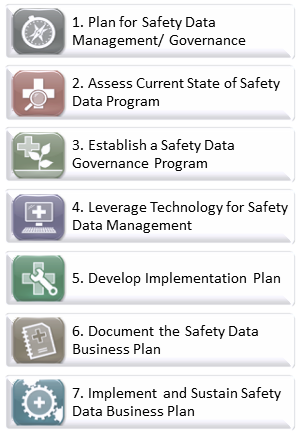
The FHWA Safety Data Management Systems and Processes project is being accomplished through the implementation of several tasks. In addition to creating a technical advisory group and conducting a literature review, the effort also involves preparing a set of case studies from among the nine State DOTs interviewed in the literature review to represent noteworthy practices in different subject areas supporting safety data management. The following summarizes the four selected case studies:
Additional task activities include hosting a peer exchange, selecting of pilot States to conduct pilot studies, and finalizing the guide. Once the draft guide for State DOT Safety Data Business Planning is ready, the project team will select two States to pilot-test the Guide and develop State safety data business plans. The final Guide will incorporate the lessons learned from the pilot efforts and is intended to become a resource for all States to use for safety data management.
In addition, FHWA is sponsoring several safety data webinars to communicate the results of these tasks to States at key milestones throughout the project. There have been two webinars to date. One held on October 19, 2015, updated States on the Guide progress, highlighted the case study results, exchanged information on safety data management noteworthy practices, and resulted in useful feedback for the Guide development. Another held on November 10, 2015, focused on Improving Safety Programs Through Data Governance and Data Business Planning and included a compilation of information gathered during the March 2015 Safety Data Peer Exchange. Additional webinars will be conducted following completion of the draft and final versions of the Guide.
Information about the Safety Data Systems and Processes project, including project reports, supporting presentation materials, future presentations, and other resources will be posted on a project website linked to the Roadway Safety Data Program Toolbox (http://safety.fhwa.dot.gov/rsdp/).
[ Return to list of contents. ]
By: Rebecca Crowe, FHWA Office of Safety
According to the Administration on Aging, by 2030, there will be approximately 72.1 million aging persons, accounting for roughly one-fifth of the population of driving age in this country. In effect, for many aspects of road planning and design, the "design driver" and the "design pedestrian" of the early 21st century will likely be 65 or over.
Quality of life for aging persons depends to an extraordinary degree on remaining independent, which in turn requires mobility. In our society, and among older populations, the overwhelming choice of mobility options is the personal automobile. Other mobility options that may be used include public transit and walking. This means that there will be a steadily increasing proportion of drivers and pedestrians who experience the physical effects of aging, including declining vision, slowed decision-making and reaction times, increased difficulty dividing attention between traffic demands and other important sources of information, and reductions in strength, flexibility, and general fitness.

In 2014, FHWA published a comprehensive resource entitled the Handbook for Designing Roadways for the Aging Population, which incorporated the latest research, expanded the range of applications covered in previous guides, and introduced a Web-based version to facilitate access and use by the engineering professionals charged with improving our streets and highways in the years ahead.
Now, FHWA has published a companion guide to the handbook that is designed to serve as a quick-reference resource focused on the five broad categories of roadway features presented in part I of the larger handbook. Ideal for use in the field or as an abbreviated source of basic information, each chapter contains a number of specific design elements and guidance on implementation. The top priority is intersections, reflecting aging drivers' most serious and enduring crash problem area, as well as the area of greatest exposure to risk for pedestrians. Next, well-documented difficulties with merging/weaving and lane changing maneuvers focus attention on interchanges. Roadway segments, with an emphasis on curves and passing zones, is also included, as are highway construction/work zones due to both the heightened tracking (steering) demands that may increase a driver's workload when traversing a work zone as well as the increased potential for unexpected events requiring a rapid response that often accompany work zone driving conditions. Finally, highway-rail grade crossings are considered as sites where conflicts are rare–and therefore unexpected–and where problems of detection (with passive controls) may be exaggerated due to sensory losses with advancing age.
Within each chapter is a list of the design elements. For each design element, the desk reference illustrates the recommended treatments. Below each treatment are references that indicate the page within the Handbook where practitioners can find a more detailed and complete discussion of that treatment. Following the numbered design elements is a section on "Promising Practice" treatments. These are treatments that designers and engineers should consider, recognizing that they are currently being used by one or more agencies, and, although they have not been evaluated formally, are generally believed to benefit the aging population.
This new product is intended to help practitioners become familiar with the most effective road design treatments for promoting the safety of older road users, ultimately serving to improve the accommodation of aging road users on the Nation's transportation system.
To access either the handbook or the desk reference, visit http://safety.fhwa.dot.gov/older_users/#training. For more information about FHWA's Older Driver program, please contact Rebecca Crowe at rebecca.crowe@dot.gov.
[ Return to list of contents. ]
By: Jerry Roche, FHWA Office of Safety, and Dave Engstrom, FHWA Resource Center
In 2010, AASHTO published the first edition of the Highway Safety Manual, which provided a go-to source of crash prediction models for segments and intersections on two-lane rural roads, rural multilane highways, and urban and suburban arterials. Although a major advance, it lacked models for one important road type on which transportation professionals dedicate considerable time and resources – freeways and interchanges.
Recently, AASHTO published the Highway Safety Manual First Edition with 2014 Supplement, which provides safety prediction methodologies for freeways, ramps, and ramp terminals developed under NCHRP 17-45. In addition to the new HSM chapters, two free companion analysis tools were also updated. NCHRP 17-45 developed the Enhanced Interchange Safety Analysis Tool (ISATe), an enhanced version of the 2007 ISAT spreadsheet, and FHWA updated the Interactive Highway Safety Design Model (IHSDM), including a new module that quickly allows users to analyze various alternatives. (See page 18 for more detailed information about the 2015 enhancements to the IHSDM.) More information on both tools is available at http://www.highwaysafetymanual.org/Pages/tools_sub.aspx.
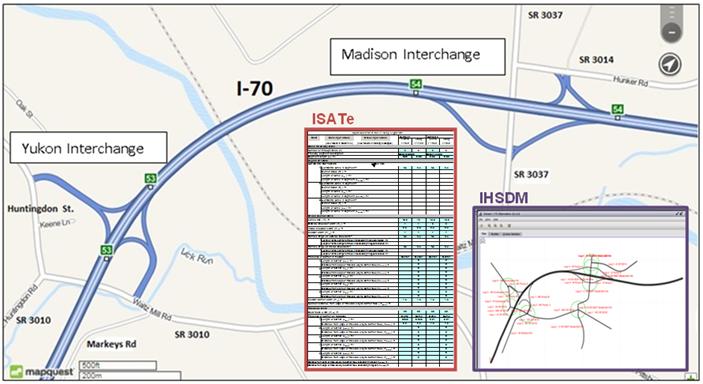
Under the EDC-3 Data-Driven Safety Analysis effort, FHWA's Resource Center Safety and Design Technical Services Team has begun offering a FREE, two-day Safety Analysis of Freeways and Interchanges workshop. The workshop presents the crash prediction methodologies for freeway segments, ramps, and ramp terminals published in the AASHTO Highway Safety Manual First Edition with 2014 Supplement. The course also includes demonstrations and hands-on exercises using the Enhanced Interchange Safety Analysis Tool (ISATe) spreadsheet and the Interactive Highway Safety Design Model (IHSDM). Those States looking to advance their DDSA implementation level under EDC-3 will be given first opportunity to host the workshop. For more information on the EDC-3 Data-Driven Safety Analysis effort, visit the EDC-3 Data-Driven Safety Analysis web page at: https://www.fhwa.dot.gov/innovation/everydaycounts/edc_4/ddsa.cfm. An overview of the course material will be provided in an upcoming webinar scheduled for January 27, 2016, at 2:00-3:30 PM Eastern.
For more information or to schedule a workshop in your State, please contact Dave Engstrom at david.engstrom@dot.gov or (708) 283-3545.
[ Return to list of contents. ]
By: Cathy Satterfield, P.E., FHWA Office of Safety
From 2009 to 2013, Minnesota experienced 589 fatal crashes attributed either to head-on or run-off-the-road (ROR) crashes on rural two-lane roadways. These types of crashes represent over 34 percent of all the fatalities on Minnesota roads, most of which appear to result from drivers drifting over center lines or edge lines. When reviewing the locations and time frame of fatal crashes on Minnesota Department of Transportation (MnDOT) trunk highways, the agency determined that, during the 4-year period, 40 percent of ROR-right crashes were on roads that did not have edge line rumble strips, none of the ROR-left crashes were on roads with center line rumble strips, and 91 percent of the head-on crashes were on roads without centerline rumble strips. In total, during the 5-year period 265 fatalities occurred on roads where there were no rumble strips.
As a result of the data analysis, the agency is discussing recommendations that include retrofitting all two-lane roads with average daily traffic (ADT) greater than 400 with both center line and edge line rumble strips, creating a buffer width for roads with an ADT greater than 2,000, removing trees from the clear zone, eliminating access points or flattening entrance slopes, applying delineation and rumbles on horizontal curves, and continuing to support counties and local agencies with data and Highway Safety Improvement Program funds. Currently MnDOT's Rumble Strip Technical Memorandum requires installing rumble strips when roads are reconstructed or overlaid. The policy requires (with some exceptions) center line rumble strips on all rural, high-speed, undivided roads and shoulder rumble strips on all rural, high-speed roads with shoulders that are at least 4 feet wide.
The challenge is that some Districts where rumble strips have been installed have been dealing with noise complaints from residents. While in most cases the public has gotten used to them, and most people understand the need for this safety treatment, in some locations center line rumbles have been removed in response to the public's complaints. There is a concern that this issue will continue to grow as more roads are resurfaced and have the rumble strips installed.
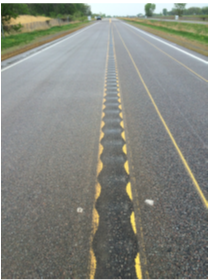
In response to the noise concerns raised by the public, MnDOT has undertaken a study of sinusoidal design alternatives that have the potential to produce an appropriate level of audible alert inside the vehicle (to wake up a drowsy driver or capture the attention of a distracted driver), while minimizing the noise exterior to the vehicle that can be irritating to nearby residents. These sinusoidal designs are sometimes referred to as "mumble strips" for their exterior noise dampening quality.
MnDOT has installed several variations of these mumble strips as part of the study and has determined a 14-inch wavelength appears the most promising. The agency will perform noise level analyses on two different "depths" and two design options. The first depth option oscillates between 1/16" to 3/8" below the pavement surface, the second oscillates between 1/16" to 1/2" below the pavement surface. Each of these depths will be included on both design options:
Sinusoidal rumble strips are more expensive to install than the traditional milled rumble strips due to the need for continuous milling of the pavement, whereas traditional rumble strips mill 7 inches and leave 5 inches of untouched pavement between each corrugation. Despite this, MnDOT calculates a very high benefit-cost ratio for the countermeasure, assuming it provides the same safety effectiveness of traditional rumble strips.
To date, MnDOT has taken noise measurements with three different types of vehicles (a passenger car, a full-size pick-up and a three-axle single-unit truck) and is in the process of analyzing the results. The agency is currently studying any potential safety concerns of motorcyclists and bicyclists. A final report on the findings of the study is expected to be complete by winter 2016. For more information on the Minnesota data analysis, contact Derek Leuer (derek.leuer@state.mn.us) and on the Minnesota sinusoidal study, contact Kenneth Johnson (ken.johnson@state.mn.us).
(Special thanks to Kenneth Johnson and Derek Leuer of MnDOT, whose peer exchange presentations were the basis of this article.)
[ Return to list of contents. ]
By Karen Scurry, FHWA Office of Safety
The Highway Safety Improvement Program (HSIP) is a core Federal-aid program the purpose of which is to achieve a significant reduction in fatalities and serious injuries on all public roads. Under the Moving Ahead for Progress in the 21st Century Act, Congress authorized approximately $2.4 billion per year to help States achieve this goal through the implementation of highway safety improvement projects, which is nearly double the amount that was authorized under the previous legislative act. In turn, the States embraced this renewed commitment to roadway safety, obligating nearly $3 billion for over 3,200 highway safety improvement projects in 2014.
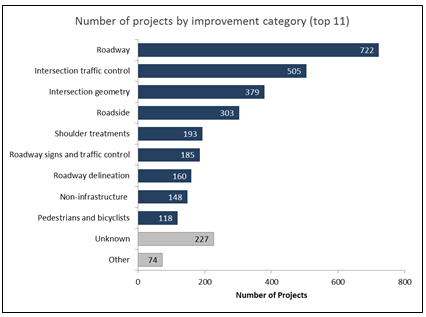
These highway safety improvement projects come in all shapes and sizes. Some are high-value reconstruction projects, while others consist of low-cost countermeasure installations across multiple sites. The Highway Safety Improvement Program 2014 National Summary Report provides an aggregate summary of the type and cost of projects across all States. Highlights of the States' 2014 HSIP implementation efforts are provided below.
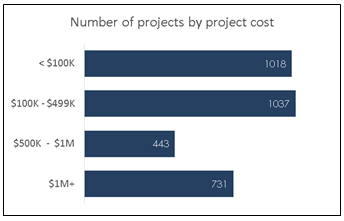
While the number and cost of HSIP projects slightly decreased in 2014 from 2013 levels, the number of HSIP projects under MAP-21 for the 2013-2014 period has increased substantially as compared to 2010-2012. Over the past 6 years, States obligated $12.6 billion for more than 15,000 highway safety improvement projects. To view the complete Highway Safety Improvement Program 2014 National Summary Report or the individual State HSIP reports, visit /hsip/reports/.
[ Return to list of contents. ]
By: Ana Maria Eigen, D.Sc., FHWA Office of Safety Research and Development
For nearly a quarter of a century, the Highway Safety Information System (HSIS), available at http://www.hsisinfo.org/, has linked the best State crash, volume, and roadway inventory data, converting it into actionable information for the transportation community. HSIS provides consistent, analysis-ready data sets relevant to the roadway community–a resource available exclusively from HSIS. The system uses data that are already being collected by States for managing the highway system and studying highway safety. The data are acquired annually from a select group of States, processed into a common computer format, documented, and prepared for analysis. Currently, HSIS links data from California, Illinois, Ohio, Maine, Minnesota, North Carolina, Washington, and Charlotte. HSIS also contributes both to external efforts, supporting studies such as NCHRP Report 756: Highway Safety Research Agenda: Infrastructure and Operations as well as to internal safety research, supporting serious injury rulemaking. As HSIS-VI enters its last year (prior to phase VII of the program), it will serve as the template for the future by entering the realm of big data.
"Big data" is a term that describes the large volume of data–both structured and unstructured–that inundates businesses and agencies on a day-to-day basis. Some examples of big data include National Aeronautics and Space Administration downloads of interstellar telescope data or worldwide health records compiled by National Institutes of Health for epidemiological research. Big data, however, are also comprised of smaller, underlying spreadsheets or a full spatial conversion to searchable data. In an attempt to help agencies manage this large stream of data, HSIS has embarked upon three big data projects involving artificial realistic data, a geographical positioning system (GPS) pilot study, and a Second Strategic Highway Research Program (SHRP2) surrogate study. The vision and outputs of these tasks will shape HSIS phase VII.
Tool Development: model development and testing. The Artificial Realistic Data (ARD) task is funded through the Exploratory Advanced Research Program (EAR) and is tasked with determining the viability of developing simulation-ready, synthetic data sets to assess the performance of multivariate modeling methods in capturing causal relationships between individual roadway attributes and safety. This synthetic database will be used to test relationships with small cell sizes or provide identical testbeds for multiple researchers to develop models.
Streamlined data extraction using current generation tools to develop next generation data. Traditionally, data were aggregated from multiple State organizations to comprise HSIS State files. Currently, a methodology is being developed to extract relevant roadway data from GIS files. The GIS Pilot Study seeks to automate data extraction from a fully spatial environment. One pilot State will be selected to conduct the traditional data process within the spatial environment, using only spatial data from that State. The goal is to apply the same process with all other HSIS States in the future. Future data set creation will be based upon this format.

Surrogate for FHWA Big Data. The Exploratory Advanced Research Program identified HSIS data as a surrogate for the SHRP2 data. HSIS serves as a surrogate owing to its linkage of traditionally unrelated data sources. The EAR Program issued a broad agency announcement seeking extensible algorithms to analyze SHRP2 using HSIS data and disparate data sources. HSIS was chosen owing to its ability to be linked with disparate data sets.
SHRP2 data will be the premier research data set for the next two decades, but small cell sizes will plague any analysis. For this reason, HSIS is poised to fill the void for meaningful analysis within the FHWA big data space by developing extensible data sets for data extractions to populate models that might be tested within a synthetic environment. HSIS-VII will be developed within the realm of big data, taking advantage of emerging data science technologies, yielding cost-effective, actionable data for the next generation of transportation professionals.
For more information on the HSIS, please contact Ana Maria Eigen at ana.eigen@dot.gov.
[ Return to list of contents. ]
By: Abdul Zineddin, FHWA Office of Safety R&D
Policy checks for rural multilane highways are now included in the Policy Review Module.
Evaluation and reporting for the Crash Prediction Module have been extended to include complete interchange-level evaluations.
On September 30, 2015, the Federal Highway Administration (FHWA) released version 11.0.0 of the Interactive Highway Safety Design Model (IHSDM), a suite of software analysis tools for evaluating the safety and operational effects of geometric design decisions. IHSDM supports the Data-Driven Safety Analysis (DDSA) initiative as part of FHWA's Every Day Counts 3 (EDC 3) efforts. IHSDM is one of the predictive approach tools as supported by EDC 3.
IHSDM includes six evaluation modules, which provide quantitative information on the expected safety and operational performance of a highway design: Crash Prediction, Policy Review, Design Consistency, Traffic Analysis, Intersection Review and Driver/Vehicle. The Crash Prediction Module (CPM), for example, is a powerful tool which implements AASHTO's Highway Safety Manual (HSM) Part C Predictive Methods for rural two-lane highways, rural multilane highways, urban/suburban arterials, and freeways/interchanges. Typical applications of the CPM include evaluating the safety impact of highway improvements, comparing the relative safety performance of design alternatives, and assessing the safety cost effectiveness of design decisions.
IHSDM has been available since 2003 and has been improved and updated every year since then. For the 2015 release, the Policy Review Module (PRM) was expanded to include policy checks for rural multilane highways. Previously, the PRM applied only to rural two-lane highways. Moreover, the 2015 release extends the Crash Prediction Module evaluation and reporting to include complete interchange-level evaluations.
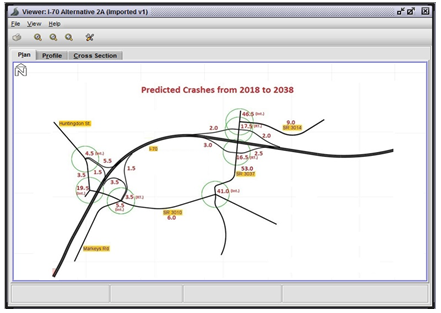 The IHSDM analysis showed that Alternative 2A was superior to Alternative 3 in terms of expected safety performance
Use of the IHSDM is steadily gaining momentum among State transportation agencies. One recent example of how IHSDM has been used comes from the Pennsylvania Department of Transportation (PennDOT). PennDOT identified a need to modify an existing set of interchanges due to their operational, geometric, and structural deficiencies. PennDOT's point-of-access request to FHWA focused primarily on two alternatives in addition to the no-build option. The first, Alternative 2A, retained two closely spaced interchanges with some mainline improvements. The second, Alternative 3, removed one of the inter-changes and added a new connector road and local roadway network improvements. Surprisingly, an IHSDM analysis revealed that Alternative 2A was superior to Alternative 3 in terms of expected safety performance, as shown in the Safety Analysis of Freeways and Interchanges workshop article above.
IHSDM software can be downloaded free of charge at www.ihsdm.org. For more information, contact Abdul Zineddin at abdul.zineddin@dot.gov.
[ Return to list of contents. ]
By: Karen King, FHWA Virginia Division
Like many other transportation agencies, the Virginia Department of Transportation (VDOT) has a growing need for real-time data and data visualization for its performance-driven transportation program. VDOT is responsible for a 58,000-mile network of highways and 20,800 bridges, and data visualization is an important tool in helping to maintain it all. In 2013, the VDOT Information Technology Division piloted a data visualization tool called Tableau1 to analyze operations and crash events and to optimize the deployment of DOT assets. The tool provides a data visualization platform that can help users search, digest, and understand the significance of the data. Since Tableau is easy to use, it puts the reporting power in the hands of decision makers, who best understand the story the data is telling. For the pilot effort, the IT Division sought out volunteers in the agency to work with the tool and to create reports and dashboards that would improve their program areas.
The VDOT Highway Safety Engineering Division took on this challenge and became an early adopter of Tableau, creating a Highway Safety Improvement Program (HSIP) Project Tracking Dashboard (Figure 1 on page 20) and a Crash Analysis Tool (Figure 2 on page 20). Both of these tools were created with internal staff resources and existing data.
VDOT receives approximately $50M in HSIP funds from FHWA and has anywhere between 800-900 projects in development. These projects, which also include local public agency projects, are managed in the nine district offices, and it was difficult to track them all–to determine if they were on schedule and to communicate how the HSIP program was performing. This dashboard helps provide project managers with increased project information, all in one place, helping to improve the schedule status of highway safety projects from 77 percent on schedule in 2013 (before the tool was available) to 91 percent in 2015.
This dashboard ensures timely delivery of the HSIP funds and tracks VDOT HSIP projects in a more intuitive and useful way, making complex data more accessible, understandable, and usable.
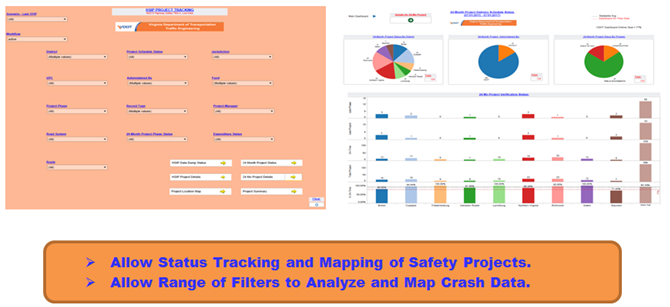
The Crash Analysis Tool allows both VDOT and other safety professionals who are conducting engineering and traffic safety studies access to crash data. It serves as a platform for highway safety professionals to make more informed decisions regarding where crashes are occurring and helps them correlate the status of ongoing highway safety projects.

The tools VDOT Highway Safety Division created are available to highway safety professionals who work in Virginia. The vision for the future is to work closely with VDOT's Information Technology partners to improve the quality, accessibility, and timeliness of Virginia's crash data.
VDOT also plans to continue using the project tracking tool to help project managers improve schedule performance for highway safety projects. The tools will continue to be updated on a regular basis and are available to VDOT and our highway safety partners, who work tirelessly to reduce fatal and injury crashes on our roadways.
In addition to the internal VDOT uses, these data visualization tools have proven to support the agency's ability to share data and information with the Virginia Division Federal Highway Administration Safety Engineer. Using a free reader version of the tool, she is able to provide stewardship and oversight for the Highway Safety Improvement Program (HSIP) as well as perform queries of the crash data when needed. The tools have become a part of VDOT's decision making processes and play an integral role in helping agency personnel understand and evaluate alternatives for possible highway safety improvement projects. VDOT's highway safety team is available to facilitate discussion and brainstorm ideas for how to make the tools even better. For more details please contact Assistant State Traffic Engineer Mark Cole at 804-786-4196 or at Mark.cole@vdot.virginia.gov.1 FHWA publications may cite specific tools in the interest of information exchange. FHWA does not endorse any products or manufacturers. Citation of a particular product in this article does not constitute an endorsement of this product over any other.
[ Return to list of contents. ]
Fall of 2015 saw the State of Kentucky formally adopt the national Yellow Dot program, becoming the 16th State to embrace this lifesaving effort. The Yellow Dot program is designed to improve emergency care to motorists involved in vehicle crashes. The "dot" is a circular yellow sticker that drivers place on the lower left corner of the driver's side rear window. Its presence alerts emergency responders that a pamphlet with identification and medical information about the motorist is in the glove box. Smaller yellow stickers can also be used on motorcycle license plates.
The national Yellow Dot program was created to give first responders access to the personal information that can be critical to treating injuries if an injured person is unable to respond following a crash or medical emergency. The all-important pamphlet includes the participant's name, photo, medical conditions, recent surgeries, current medications, allergies, physical information and emergency contact information. During the "golden hour" following a crash, having this important medical condition information can help EMS responders provide appropriate and safe treatment to injured crash victims and can be particularly helpful in minimizing adverse drug reactions among individuals who take certain types of medications.
"Current information is especially important when dealing with medical conditions and prescriptions," said Kentucky Office of Highway Safety Executive Director Bill Bell, whose agency is tasked with administering the program. "It determines the type of treatment emergency responders can or cannot safely provide."
The Yellow Dot program originated in Connecticut in 2002 and now has spread to 15 other States, often expanding on a county by county basis. In some States, the program has been adopted after local grass-roots efforts by senior advocacy and other safety-related organizations.
"This program is growing nationwide," said Kentucky Governor Steve Beshear. "Not only will it help our residents, but with major interstates bringing out-of-state travelers through the Commonwealth every day, we knew Kentucky needed to be on board."
The Yellow Dot program in Kentucky is supported by Federal-aid funds administered through the Federal Highway Administration. For more information about the Kentucky program, contact Erin Eggen at Erin.Eggen@ky.gov.
[ Return to list of contents. ]
Take a minute to try our word search featuring some of the most common terms appearing in this issue of Safety Compass! (Download a printable PDF of the puzzle.)

[ Return to list of contents. ]
As part of its EDC-3 Data-Driven Safety Analysis effort, FHWA will be hosting a DDSA "How-To" series of webinars beginning in January 2016. This series will provide participants with an exploration of methods, tools, and resources to incorporate safety performance into all highway investment decisions. In addition to topical webinars, we will also be hosting DDSA "Office Hours," in which we will work through the analysis of actual projects submitted by state and local transportation professionals.
To sign up for webinars or for more information, please visit: https://www.fhwa.dot.gov/innovation/everydaycounts/edc_4/ddsa.cfm
Some of the topics to be covered include:
Transportation Research Board (TRB) 95th Annual Meeting, January 10-14, 2016, Washington, DC (http://tinyurl.com/2b6yqg8). The meeting program will cover all transportation modes, with more than 5,000 presentations in nearly 750 sessions and workshops. The theme for the 2016 TRB Annual Meeting is "Research Convergence for a Multi-Modal Future."

Countermeasure Strategies for Pedestrian Safety: Pedestrian Safety at Transit Locations, January 20, 2016, 1:00-2:30 PM EST (http://tinyurl.com/gsv9rqs). This installment of the 12-part Federal Highway Administration webinar series focused on Countermeasure Strategies for Pedestrian Safety will provide detailed information on safety considerations for pedestrians at transit stops. This presentation will examine some of the pedestrian safety issues that may exist at transit stop locations. Attendees will learn about potential solutions for these problems and discuss how improving safety can benefit the transit system.
NHTSA will be hosting a series of safety summits in 2016. These meetings will identify best practices, new ways of looking at traffic safety and define building blocks for a robust behavioral safety program.
These meetings serve as call to action for highway safety practitioners and all who are interested in saving livings and stopping injuries and crashes on our Nation's roadways. Invited participants will include representatives from a wide range of disciplines, including traffic safety, public health, advocacy groups, industry, State governments, academic institutions, and other Federal Agencies. We look forward to your participation in this important dialog. The summits are scheduled for:
For more information, contact Kristen Allen at Kristen.allen@dot.gov or 202-366-0251.
Lifesavers National Conference on Highway Safety Priorities, Long Beach, CA, April 3-5, 2016 (http://lifesaversconference.org/). The Lifesavers Conference brings together a combination of public health and safety professionals, researchers, volunteers, and practitioners who are committed to sharing best practices, research, and policy initiatives. Drawing more than 1,900 participants in 2015, the annual Lifesavers conference provides a forum for the presentation of proven countermeasures and initiatives that address today's critical highway safety problems. Topics for workshops include:
National Work Zone Awareness Week, April 11-15, 2016. This annual event is intended to raise awareness about the importance of traveling safely through work zones and paying attention to both driving activities as well as the locations of workers as the public passes through a work zone area. For this event, Ohio will host the national kick-off event, which will be held just outside of Toledo, in the vicinity of a large, complex widening project on I-75. This 32-mile project will add capacity and a number of roadway safety improvements including redesigned interchanges, roundabouts and other new features.
If you are attending the 95th Annual Transportation Research Board meeting this January, be sure to stop by booth 1223 in the exhibit hall to check out all the Office of Safety has to offer.
We will be featuring free materials from all of our program areas, including:
We will be holding live demos of our offerings, such as:
Exhibit Hours will be as follows:
Sunday, January 10, 4:00p.m.-7:00p.m.
Monday, January 11, 9:00a.m.-4:00p.m.
Tuesday, January 12, 9:00a.m.-4:00p.m.
For more information, please contact Tara McLoughlin at 202-366-2176 or tara.mcloughlin@dot.gov
is a publication of the U.S. Department of Transportation, Federal Highway Administration.
The Federal Highway Administration publishes the Safety Compass newsletter three times a year. We can be reached at:
FHWA Office of Safety
1200 New Jersey Ave. SE
Room E71-320
Washington, DC 20590
The Safety Compass is available online at the FHWA Office of Safety web site at: http://safety.fhwa.dot.gov/newsletter/safetycompass/.
We welcome your comments and highway safety-related articles. The purpose of this newsletter is to increase highway safety awareness and information and to provide resources to help save lives.
We encourage readers to submit highway safety articles that might be of value to the highway safety community. Send your comments, questions and articles for review electronically to Tara McLoughlin at: tara.mcloughlin@dot.gov
