U.S. Department of Transportation
Federal Highway Administration
1200 New Jersey Avenue, SE
Washington, DC 20590
202-366-4000
Best for printing: PDF Version (1,66 MB)
A Message from the FHWA Associate Administrator for Safety, Beth Alicandri
SUPPORTING THE STATES: FEDERAL AID PROGRAMS
HSIP Evaluation—Learn From the Past with a Look Toward the Future
NEW! FHWA Launches the Strategic Highway Safety Plan Database
BY THE NUMBERS: SAFETY DATA AND ANALYSIS
Report to Congress Recommends Safety Data Improvements for Tribal Roads
Serious Injury Data – The Missing Puzzle Piece in Safety Performance Management
New! Videos Highlight DDSA Applications in Common Transportation Processes
MORE COMPLETE STREETS
SAFETY FOCUS AREA: ROADWAY DEPARTURE
New! Study Evaluates Benefits of the SafetyEdgeSM, Develops New CMFs
NEW! FHWA-FRA Joint Webinar Series!
AWARDS NEWS
FHWA Safety Leadership Peer Awards and the Howard Anderson Lifetime Achievement Award
ANNOUNCEMENTS

Since 2009, the Federal Highway Administration's Every Day Counts (EDC) initiative, now in its fourth round, has broadened the use of effective tools and methods to make roads safer and last longer, reduce the use of resources, and decrease project delivery times. The work accomplished through the four rounds of EDC has sparked the dissemination of innovative technologies and processes throughout the U.S. transportation sector.
A great example of this success is the SafetyEdge (a 30-degree angled taper at the edge of the paved roadway). Selected for promotion under the first round of EDC, the SafetyEdge was virtually unknown in 2011. However, 2 years later, 36 State DOTs had adopted a standard specification with the SafetyEdge (related story on p. 13) or some equivalent design. Another example is high friction surface treatment (HFST), an innovation promoted under EDC-2. Within a 2-year period, the number of States using HFST grew from 14 to 37, and 14 States had made the use of HFST a standard practice for reducing crashes at critical locations.
Two innovations selected for promotion under EDC-3 have been so successful that they are being continued under EDC-4: Road Diets (related story on p. 9) and Data-Driven Safety Analysis (related stories on pp. 7-8). The Road Diet countermeasure is an element of the EDC-4 Safe Transportation for Every Pedestrian (STEP) suite of countermeasures. Innovations promoted through STEP—including Road Diets, pedestrian hybrid beacons, and refuge islands, among others—will help transportation agencies address pedestrian-involved crashes by advancing the use of cost-effective safety countermeasures with known safety benefits (story on p. 11).
Practitioners are not the only ones who have recognized the value of the EDC program; legislators, too, have recognized the initiative's success through the Fixing America's Surface Transportation (FAST) Act, signed on December 4, 2015. As part of this law, Congress directed FHWA to continue the EDC program, identifying and promoting a new collection of market-ready innovations and best practices at least every 2 years. With four rounds and counting, the EDC initiative will continue to foster and promote safety innovations that improve the Nation's roadways for all users.
By: Frank Gross, VHB, and Karen Scurry, FHWA Office of Safety
The Highway Safety Improvement Program (HSIP) is a core Federal-aid highway program intended to help States achieve a significant reduction in fatalities and serious injuries on all public roads through implementation of highway safety improvement projects. States analyze and assess the results of highway safety improvement projects in terms of contributions to improved safety outcomes and the attainment of safety performance targets. As such, project, countermeasure, and program evaluations are key to understanding a State's progress toward achieving annual safety performance targets, the return on investment, and ultimately, the long-term success of the program.
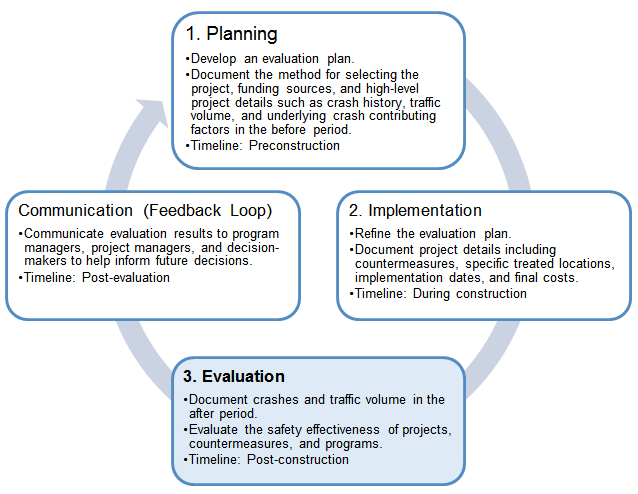
Three levels of HSIP evaluation:
The HSIP comprises three components: planning, implementation, and evaluation, as shown in Figure 1. Evaluation is the third component of the HSIP process, but it is not the final step. While evaluation focuses on the effectiveness of past efforts, it provides a critical feedback loop to improve processes and inform future planning and implementation decisions.
In general, evaluations help agencies understand the effectiveness of a given effort with respect to a specific performance measure. Common performance measures relate to safety, economics, and efficiency. States can analyze these various measures to perform HSIP evaluation at three levels—project, countermeasure, and program. Specifically, States can collect desired performance measure data for individual projects, analyze project-level data to evaluate projects, aggregate individual projects to evaluate countermeasures, aggregate countermeasure evaluation results to evaluate overall program effectiveness, and use the results of HSIP evaluations to inform future decisions.
Evaluating the safety effectiveness of individual projects, countermeasures (i.e., groups of similar projects), and programs, allows agencies to:
FHWA created the HSIP Evaluation Guide (the Guide) to support States' HSIP evaluation efforts and to suggest practical ways to incorporate regular evaluations into HSIP management practices. The Guide aims to help program managers, project managers, data analysts, and researchers involved with project, countermeasure, or program evaluations. The objectives of this Guide are to help readers:
This Guide will help answer questions such as:
Readers will learn about the different levels of evaluation and the associated methods, data requirements, and considerations. Employing more consistent and reliable evaluation methods will support safety decision making, positively affect processes intended to reduce crashes, optimize return on safety investments, and increase the effectiveness of projects and programs.
An evaluation plan should address the following questions:
To establish and sustain a successful HSIP evaluation practice, there must be support from HSIP staff and management, including adequate staffing, guidance, and the use of appropriate evaluation tools. The Guide examines potential challenges and opportunities to prepare for successful evaluations, providing real-world examples from agencies that have excelled in these areas. The Guide also discusses how to use the results from HSIP evaluations to enhance future decisions. For example, agencies can use the results from project, countermeasure, and program evaluations to update the State Strategic Highway Safety Plan (SHSP).
While evaluation occurs after implementation, it is useful to develop an evaluation plan to guide data collection during the planning and implementation stages. For example, project tracking provides the foundation for HSIP evaluations and should begin during planning and continue through programming, implementation, and post-construction. The Guide describes practices to monitor and track individual projects, including a tracking timeline, relevant project data, use of templates, and opportunities to engage stakeholders to gain support for the process.
By considering evaluation during the planning and implementation stages, agencies will be prepared for a proactive, rather than reactive, evaluation process.
For more information on each stage of the HSIP process, please visit FHWA's Highway Safety Improvement Program page, or contact Karen Scurry at Karen.Scurry@dot.gov.
By: Danielle Betkey, FHWA Office of Safety
The Strategic Highway Safety Plan (SHSP) Database provides a wealth of information about the data-driven approaches States are using to reduce roadway fatalities and serious injuries. The database compiles key data from each State's SHSP in one easy-to-use database. Since most of our work relates to the SHSP, the database is a quick reference resource that can help inform our programs. States may also find this database to be a useful tool in updating their SHSPs.
The database includes information about emphasis area strategies and action plans; safety partners within the 4E's (engineering, education, enforcement, and emergency medical services); approaches States are using to update, implement, and evaluate plans; and much more. Users can search the database by Key Components (e.g., vision and mission statement, emphasis area, and lead agency); Special Topics (e.g., emphasis area action plans and local and rural roads); Emphasis Area Categories (e.g., infrastructure and behavioral); or by using a Keyword Search.
When using the SHSP Database, users should note the following:
You can also access the database through the SHSP website or the SHSP Community of Practice website. For more information, please contact Danielle Betkey at Danielle.Betkey@dot.gov.
By: Adam Larsen, Office of Tribal Transportation
The safety data available for Tribal roadways is often low quality, making it difficult to fully understand the transportation safety problem in Tribal areas and develop appropriate countermeasures. With improved information, better tailored programs and projects can help to reduce transportation incidents that result in fatalities and serious injuries. On May 24, 2017, FHWA published a report to Congress titled Tribal Governments and Safety Data.
The report contains several recommendations to help improve the quality and availability of safety data in Tribal areas. Already FHWA and NHTSA have coordinated on changes to the Traffic Records Assessment Manual that reflect the need for States to involve Tribal data when assessments are being conducted. In addition, the Tribal Transportation Program Safety Fund will now encourage Tribal governments to conduct crash data self-assessments to evaluate the benefits of improved crash data collection, sharing, and use. Guidelines for conducting such an assessment can be found in National Cooperative Highway Research Project Report 788. The Tribal Transportation Safety Management Steering Committee plans to serve as a national-level traffic records coordinating committee.
This report to Congress is the first in a series of two required by the Fixing America's Surface Transportation (FAST) Act. The second report will provide a list of options for improving transportation safety in Tribal areas. This second report will be based on a National Strategic Highway Safety Plan for Tribal Areas that is under development by the Tribal Transportation Safety Management Steering Committee. This national safety plan will be based on an analysis of data in Tribal areas from the Fatality Analysis and Reporting System. To learn more about the committee's activities, please visit TribalSafety.org, or contact Adam Larsen at Adam.Larsen@dot.gov.
By Michael S. Griffith, FHWA Office of Safety
Performance measurement is evident in all aspects of society. It's seen from an early age during school gym classes, later in workplace reviews, and throughout our lives. Performance is also a critical element in highway safety and is measured in strictly objective terms: the number of lives lost and serious injuries sustained on America's highways. But up until now, serious injury data has been incomplete—it is the missing piece of the puzzle when it comes to safety performance management.

A new requirement places greater attention on highway safety performance and focuses on the numbers, but leaders in the profession recognize the tragedy behind each number. The FHWA's Highway Safety Improvement Program (HSIP) has transitioned to a performance-based system. The November/December 2016 Public Roads article titled "What Drives Highway Safety Improvements?" provided an overview of the HSIP and safety performance management (PM) final rules. The safety PM final rule established a process for State departments of transportation (State DOTs) and metropolitan planning organizations (MPOs) to establish and report their safety targets. State DOTs and MPOs will set performance targets for the following measures:
(1) The number of fatalities.
(2) The rate of fatalities per 100 million vehicle-miles traveled (VMT).
(3) The number of serious injuries.
(4) The rate of serious injuries per 100 million VMT.
(5) The number of non-motorized fatalities and non-motorized serious injuries.
Highway fatality data exists in the National Highway Traffic Safety Administration's (NHTSA) Fatality Analysis Reporting System; however, a national data system covering all serious highway injuries does not exist, in part because States use different classification systems and coding for serious injuries. This practice has led to inconsistent reporting among States and even within some States. In response, the USDOT established a national definition for serious injuries to improve data quality and consistency in support of the national goals. FHWA's Safety Performance Management Measures regulation (23 CFR Part 490, Subpart B) and NHTSA's Uniform Procedures for State Highway Safety Grants Programs Interim Final Rule (23 CFR Part 1300) establish a single, national definition for States to report serious injuries per the Model Minimum Uniform Crash Criteria (MMUCC) 4th Edition's "Suspected Serious Injury (A)." States must report serious injuries using the MMUCC definition by April 15, 2019, and USDOT encourages States to begin using the MMUCC 4th Edition injury attributes on or before January 1, 2019, to produce a consistent and compliant data set for the entire year.

The USDOT's Traffic Records Executive Committee created a serious injury reporting subcommittee made up of representatives from FHWA, NHTSA, and the Federal Motor Carrier Safety Administration to assist in the implementation of the new Federal serious injury reporting requirements. In 2015, FHWA conducted a needs assessment and determined that only 3 out of the 57 jurisdictions surveyed demonstrated use of the MMUCC 4th Edition definition. The USDOT is developing resources to help the States in obtaining the "missing puzzle piece"—standard and consistent reporting of serious injury data, including:
The USDOT stands ready to help States solve the serious injury puzzle. It is recognized that the uniform definition for reporting serious injuries will lead to improved implementation of safety countermeasures to help support the national safety goal of reducing fatalities and serious injuries on our roadways.
For more information and resources for meeting the new safety performance management requirements, please visit the Safety Performance Management page, or contact Dana Gigliotti dana.gigliotti@dot.gov.
By: Jerry Roche, FHWA Office of Safety
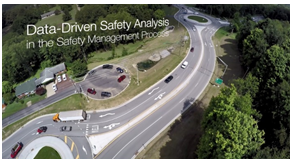
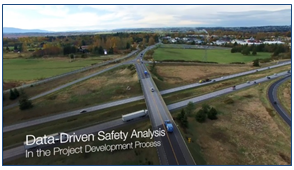
The FHWA Office of Safety recently released a series of new videos highlighting the application of Data-Driven Safety Analysis (DDSA) in developing State and local transportation projects. DDSA applies the latest generation of tools to analyze crash and roadway data and helps agencies to make more informed decisions, which in turn helps them better target transportation investments and reduce severe crashes

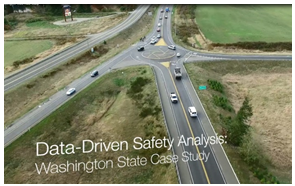
As Washington State Secretary of Transportation Roger Millar states, "This isn't simple. Its hard work… [but it] is paying off for the Washington State DOT."
To learn more about DDSA and how it might benefit your agency, please visit our website or contact Jerry Roche at Jerry.Roche@dot.gov.
By: Robert Pollack, FHWA Office of Safety
Representatives from several offices within FHWA participated in the 2017 Association of Transportation Safety Information Professionals (ATSIP) Annual Traffic Records Forum (TRF) in New Orleans, LA from August 6-9, 2017. The TRF is the single biggest event in the United States focused solely on traffic records and safety data improvement issues. FHWA was represented at this year's TRF by staff from the Office of Safety, Office of Safety Research and Development, the Office of Planning, Environment and Realty and by the Louisiana Division Office. TRF programs related to roadway data included workshops, panels, and presentations covering a broad array of issues, including:
Given the diverse collection of individuals and agencies that participate on the TRF, this event presents a great opportunity to reach potential new partners in FHWA's safety data and analysis efforts. For more information on FHWA participation in the TRF, please contact Robert Pollack, Robert.Pollack@dot.gov.
By:Stuart Thompson, FHWA Office of Safety; Anita Vandervalk,Cambridge Systematics, Inc.;and Dena Snyder, Cambridge Systematics, Inc.
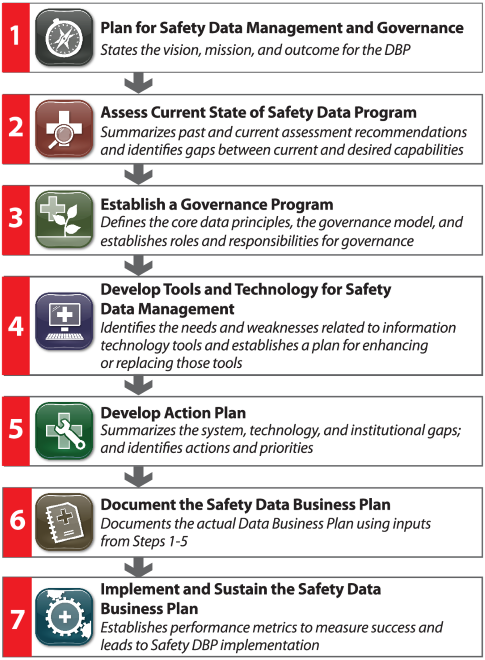
FHWA has completed a project that will assist States in developing, enhancing, managing, maintaining, and governing effective safety data systems. The Guide for State DOT Safety Data Business Planning (the Guide) provides practical instructions for State DOTs to follow in developing, implementing, and maintaining a safety data business plan (DBP). A safety DBP describes a State's data management challenges, vision, and mission for safety data, framework for data governance, and actions for improving its crash, roadway, and traffic data systems.
Data business planning is a relevant topic as State DOTs work to advance their capabilities for safety data management, performance management, and asset management systems. Effective data management practices are necessary to integrate crash data with roadway and volume data to investigate systemwide and site-specific conditions. Safety practitioners require integrated and readily available data to support quantitative safety analysis. State DOTs must coordinate their safety data collection efforts with a variety of internal and external partners that manage safety data programs to support safety data analytics. Safety data business planning efforts provide a framework to enhance this coordination.
The Guide was developed as part of the FHWA Safety Data Management Systems and Processes project. For this project, a technical advisory group was established to assist with the Guide development. The group included representation from the American Association of State Highway and Transportation Officials (AASHTO), Federal, State, and local government transportation agencies. The group participated in regular meetings about the project, reviewed draft deliverables, and provided input for the Guide from a State and local government perspective.
The project team also conducted a literature review of available resources for safety data management based on the framework presented in NCHRP Re-port 666: Target-Setting Methods and Data Management to Support Performance-Based Re-source Allocation by Transportation Agencies,1 inter-viewed nine State DOTs to identify safety data management noteworthy practices and challenges, and summarized issues, gaps, and challenges in cur¬rent literature and in State data management systems and processes. The final product was the Literature Review and Synthesis report.
The project team selected four case study States to represent noteworthy practices in different subject areas supporting safety data management. FHWA then hosted a Safety Data Peer Exchange that included 10 State transportation agencies selected for participation based on their progress and interest in data governance and safety data business planning. The peer exchange discussion led to many useful suggestions for the Guide.
Based on the information discovered during the literature review, interviews, and examination of noteworthy practices, FHWA then developed the Guide. The project team worked with two States to pilot test the Guide and help them develop their own safety DBPs. The final Guide incorporates the lessons learned from these pilot efforts.
FHWA sponsored several safety data webinars to communicate the results of these tasks to States at key milestones throughout the project. A final webinar was conducted in late July to present the results of the pilot studies and introduce the Guide.
More information about the Safety Data Systems and Processes project, including the Guide, case study reports, pilot studies, and other resources, is available on the project website (/rsdp/manage.aspx). For questions or more information about the Guide, please contact Stuart Thompson at Stuart.Thompson@dot.gov.
_________________
1 Transportation Research Board, NCHRP Report 666: Target-Setting Methods and Data Management to Support Performance-Based Resource Allocation by Transportation Agencies, National Academy of Sciences, 2010. Available at: http://onlinepubs.trb.org/onlinepubs/nchrp/nchrp_rpt_666.pdf
By: Rebecca Crowe, FHWA Office of Safety

Planning is critical when designing and placing bicycle lanes within the transportation ecosystem. In 2016, transportation leaders, planners, and engineers from Northwest Arkansas, as well as the Walton Family Foundation (The Foundation) explored techniques for effective bicycle lane implementation. Faced with designing routes to meet the needs of an international mountain biking summit, these leaders developed temporary solutions to bring protected bicycle lanes to their region.
Northwest Arkansas lies within the rugged Ozark Mountains. The International Mountain Bicycling Association chose this location to host its November 2016 World Summit, where approximately 500 mountain bicyclists participated in this first-ever, sold-out event in its 12-year history.
While designing for an international summit is fundamentally complex, transportation stakeholders viewed this process as an opportunity to assess and analyze everyday bicycle ridership. A spring 2015 study of the trail system in Northwest Arkansas1 revealed that usage is comparable to other major bike- and pedestrian-friendly metropolitan areas.
A major finding from this study determined that there are nearly as many daily bicyclists per capita using the trail system in Northwest Arkansas as there are in San Francisco.
In preparation for the 2016 World Summit and surrounding activities, The Foundation explored bicycle transit options in the Arkansas cities of Bella Vista, Bentonville, and Rogers.
Although bicycle ridership was high in these areas, peak usage was for recreational purposes rather than commuting because neighborhood streets were disconnected. Riders had no real alternative commuting option than to travel by vehicle.
To gain a different perspective on how to plan for a better bicycling transit network, transportation stakeholders from all three cities traveled to Copenhagen. There, they were able to see first-hand how the Danish plan their bicycle transit using a technical planning method—Tactical Urbanism.
Tactical Urbanism an umbrella term used to describe a collection of low-cost, temporary changes to the built environment, usually in cities, intended to improve local neighborhoods and city gathering places and to inspire long-term change.2 For North-west Arkansas, the tactic was to install a temporary roadway reconfiguration, or Road Diet, and to perform a robust analysis to determine how the changes affect local transit usage and business.
Three different pilot projects were conducted within the three cities of Bella Vista, Bentonville, and Rogers. Funding for these projects was provided by The Foundation in the form of grants given to municipalities and the regional planning commission. The cost per linear foot was minimal due to the temporary nature of these infrastructure changes.
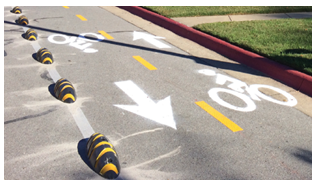
All three projects were launched and completed around the same time frame. The temporary modifications consisted of roadway restriping to allow for two-way bicycle lanes, bicycle lane buffering materials, and signage.
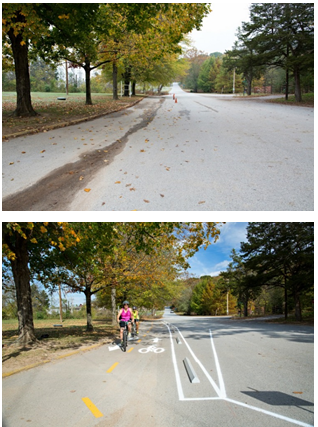
For the project in Bella Vista, which was deemed the most successful, the roadway reconfiguration was implemented where bicyclists were already using the route. Originally more than 42-ft. wide, the pilot roadway was reconfigured to include a protected 12-ft. bi-directional bike lane with 8-ft. parking lanes and two 10-ft. through-traffic lanes.
In Bentonville, while the 1500 linear feet of new protected bike facilities modifications made for a safer route, they did not necessarily make it quicker to get from "Point A to Point B." Users here suggested the creation of a more direct route to increase commuting efficiency.
Karen Minkel, who is the Home Region Program Director for the Walton Family Foundation and has a background in urban planning and public policy, said of the Bentonville project, "The effectiveness of the Bentonville model goes back to our experience in Copenhagen. There we asked why so many people rode their bicycles. We were told that this is because bicycling is often the most efficient way to get around. It's not just for safety or just to help the environment, it is also more efficient."
The Rogers City pilot project was the longest of the three pilot projects, coming in at just under a half mile. Both on-street protected bike lanes and a neighborhood greenway were implemented, complete with traffic diverters, mega sharrows (green-backed shared lane markings), and four types of delineators.
It incorporated bicycle lanes in the downtown area and through several neighborhoods. It was well executed, but following the 2016 World Summit, traffic volumes remained low. Further studies are being conducted on this route to determine how the city could promote the use of safe bicycling while providing support for the surrounding neighborhoods and local businesses.
Having witnessed the effectiveness of these projects, stakeholders are working with transit users and neighborhood associations to back the full implementation of permanent bicycle networks.
Support for these types of projects is strong and growing. The public is increasingly embracing tactical urbanism for more livable transit solutions.
"One minute you can be riding your bicycle in the city and the next, you will find yourself in the Ozark woods," says Ms. Minkel, "these modifications are really going to change the way we think about getting out on our bikes and commuting."
For more information and a detailed description of each project, please download the Bike NWA Final Report. For more information on how you can apply Tactical Urbanism to improve bicycle safety on your local roadways, please contact Tamara Redmon at tamara.redmon@dot.gov.
Material for this article has been contributed by the Walton Family Foundation.
______________
1 Walton Family Foundation, Summary of NWA Trail Usage Report, Nov 2, 2015, Online. http://www.waltonfamilyfoundation.org/~/media/documents/trails-report-memo_final_20151104.pdf?la=en
2 L. Pfeifer, "The Planner's Guide to Tactical Urbanism," Montreal, Canada 2013. Available at: http://reginaurbanecology.files.wordpress.com/2013/10/tuguide1.pdf
By: Rebecca Crowe, FHWA Office of Safety
In 2015, pedestrians accounted for more than 17 percent of all roadway fatalities, with 66 percent of those deaths occurring at uncontrolled crossing locations such as mid-block or unsignalized intersections. The FHWA is working to reduce fatalities and injuries at such crossings through STEP (Safe Transportation for Every Pedestrian).
STEP is part of the fourth round of Every Day Counts (EDC-4), and its extensive outreach and technical assistance activities are promoting cost-effective countermeasures with known safety benefits to State and local transportation agencies nationwide.
The STEP program advocates the use of treatments designed to improve pedestrian safety. FHWA is promoting five cost-effective countermeasures and their associated benefits through STEP:
Since the kick-off of EDC-4 innovations in early 2017, staff has presented on STEP at multiple workshops, conferences and training events. During these presentations and events, State and local transportation officials are confirming that pedestrian safety is a priority concern, and agencies are eagerly looking for more resources to assist with implementation of pedestrian safety countermeasures.
At his June workshop at the Connecticut Technology Transfer Center, Peter Eun, Transportation Safety Engineer with the FHWA Resource Center discussed uncontrolled intersection design with engineers, public works directors, highway supervisors, planners, and law enforcement personnel. Feedback from attendees at the event indicated that their workshop experience would help them in the future by enabling them to suggest the most appropriate countermeasures when working with towns and cities, apply what they learned about Road Diets and pedestrian crosswalk information on future projects, and use the skills and tactics they learned when designing highway facilities.
If you are ready to "STEP forward," there are various forms of free technical assistance available to advance STEP countermeasures. If you're interested in holding a workshop or want more detailed information or assistance on deploying these countermeasures, please contact Rebecca Crowe, FHWA STEP Program Manager, at Rebecca.Crowe@dot.gov or (202) 507-3699.
By: Guan Xu, FHWA Office of Safety
The primary purpose of traffic calming is to support the livability and vitality of residential and commercial areas through improvements in non-motorist safety, mobility, and comfort. These objectives are typically achieved by reducing vehicle speeds or volumes on a single street or a street network. Traffic calming measures consist of horizontal, vertical, lane narrowing, roadside, and other features that use self-enforcing physical or psycho-perception means to produce desired effects. Because there are many different ways to employ traffic calming measures, traffic calming is a broad and complex topic.
To promote understanding of this complicated issue, FHWA, in partnership with the Institute of Transportation Engineers, has released the Traffic Calming ePrimer. This ePrimer is a free, publicly available online resource representing many decades of traffic calming experience in the United States. It has also been vetted by key community stakeholders, including transportation, safety, and emergency management officials.
The ePrimer presents an overview of the toolbox of individual traffic calming measures and its relationship to other transportation initiatives, offers research findings as to the impacts of the tool in regards to mobility and safety from the standpoint of different user types, outlines different applications, and provides numerous case studies. For ease of use, the ePrimer has been separated into 8 distinct topical modules, each of which is broken down into smaller sections.
Modules contained in the traffic calming ePrimer include:
For more information, visit the Traffic Calming ePrimer page or contact Guan Xu at Guan.Xu@dot.gov.
By: Cathy Satterfield, FHWA Office of Safety
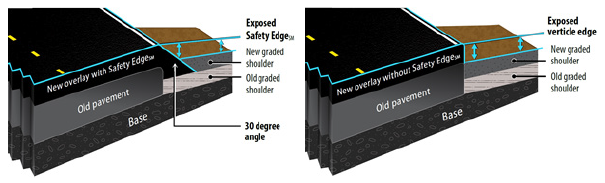
FHWA recently released a highly anticipated report summarizing the results of an extensive safety and economic evaluation of the SafetyEdgeSM pavement treatment. In addition to the assessment of safety benefits realized by agencies installing this treatment, the report, Safety Effects of the SafetyEdgeSM Technical Summary of Crash Modification Factors, leveraged these findings to develop benefit-cost (B/C) ratios for the application of the treatment. This research builds on past studies of the SafetyEdge by using a multi-State database and state-of-the-art analysis methodology. Researchers employed a large sample of repaving projects with and without the SafetyEdge, which gave them the opportunity to develop statistically significant crash modification factors (CMFs) for several crash types using the scientifically rigorous Empirical Bayes analytical method. The CMFs were then used along with cost data from analysis by the National Center for Asphalt Testing (NCAT) to develop benefit-cost ratios for the SafetyEdge treatment on two-lane rural highways.
The SafetyEdge is constructed with a low-cost paver attachment that enables the pavement edge to be paved and compacted to a finished 30-degree angle to eliminate vertical edges and promote a smooth return to the travel lane after one or more wheels leave the pavement. Figure 1 illustrates typical overlay cross-sections of roadways where the backfill material adjacent to the edge of the pavement has settled or eroded, exposing the edge. Settling and erosion is common and may begin as soon as a few months after construction is completed. The left image shows how the angled SafetyEdge can be easily traversed by vehicles attempting to re-enter the roadway, while the image at right shows how the vertical or near-vertical pavement edge drop-off that occurs with traditional paving techniques can cause tire-scrubbing, which may lead to loss of control.
The Empirical Bayes observational before-after evaluation used data from the States of Iowa, North Carolina, Ohio, and Pennsylvania, along with that from Marion County, Florida. Researchers found statistically significant CMFs aggregated across the three States for which drop-off-related crash data were available (in Pennsylvania, the sample of drop-off-related crashes was too small to develop a CMF for this crash type). The drop-off-related CMF for Iowa, North Carolina, and Ohio combined was 0.655. The analysis also found statistically significant CMFs aggregated across the five agencies' study sites for run-off-road crashes, opposite-direction crashes, and fatal injury crashes. The resulting CMFs for the combined sites for run-off-road and opposite direction crashes were 0.790 and 0.813, respectively. These CMFs were consistent with past studies, indicating that the SafetyEdge does address these specific crash types. The resulting fatal injury CMF of 0.892 is also reasonable based on past research, which indicates that drop-off-related crashes are often quite severe, although they are still only a relatively small proportion of crashes. The total crash CMF was not statistically significant at the 95-percent confidence level, which was somewhat expected because the effect of the SafetyEdge is not likely to be seen amongst the large number of "property damage only" crashes in the total crash data sample.
The economic evaluation found that the SafetyEdge treatment is very cost-effective. Even with conservative estimates for pavement service life, value of a statistical life, and the depth of the pavement surface (i.e., construction costs), the B/C ratios ranged from 590 to 1,180 for run-off-road crashes, and from 730 to 1,460 for fatal injury crashes. This huge B/C ratio is the result of the nominal added cost to repave a roadway with the SafetyEdge.
A longer technical report entitled Safety Effects of the SafetyEdge details the original analysis and will be available later this year. For more information about the SafetyEdge, a focus innovation under Round 1 of the Every Day Counts initiative, contact Cathy Satterfield at cathy.satterfield@dot.gov.
The FHWA Office of Safety recently partnered with the Federal Railroad Administration (FRA) to host a new joint webinar series that will address a variety of highway-rail grade crossing issues, as well as tools and strategies to enhance safety. The first joint webinar was held on June 20th and focused on the new Highway-Railway Grade Crossing Action Plan and Project Prioritization Noteworthy Practices Guide that was recently published through an FHWA and FRA partnership. Recordings from the joint webinar series will be posted on the FHWA Office of Safety Rail-Highway Crossings Program website as they become available.
The second webinar is scheduled for Wednesday, October 18th, 2017, from 1:00 to 2:30 ET. The topic for this webinar will focus on the Highway-Railway Crossing Inventory and will include a discussion on National Highway-Rail Crossing Inventory Reporting Requirements, an overview of the Grade Crossing Inventory System on the FRA Safety Data website, and how inventory information is used. Registration is FREE, but is required to participate. Please register no later than Friday October 13th.
By: Jessica G. Rich, FHWA Tennessee Division
Since 2012, the FHWA Tennessee Division has worked with the Tennessee Department of Transportation (TDOT) to implement Data Driven Safety Analysis (DDSA) into the Tennessee Highway Safety Improvement Program (HSIP). Peer exchanges have proven to provide a platform for information sharing and implementation plan development. The Tennessee Division Safety Engineer developed Highway Safety Manual (HSM) Peer Exchanges with Kentucky, North Carolina, and Virginia, which were funded by the Tennessee Division and the Tennessee Department of Transportation using T2 funds.
These face-to-face meetings, held in May of 2017, gave TDOT staff the opportunity to learn the structure of other HSIP programs and how these programs use the HSM to predict crashes, develop crash modification factors, and prioritize projects. TDOT staff also had the opportunity to gain full understanding of other HSIP projects and develop ideas on how to implement HSM practices into the Tennessee HSIP.
For each peer exchange, the host State gave a presentation on the structure of its HSIP, including current HSM practices. Following the presentations, there was a roundtable discussion that included topics such as crash data analysis systems and capabilities, safety performance function development and calibration, and systemic safety programs.
TDOT believes that this peer exchange provided a better opportunity to ask as many questions as attendees needed to ask to understand how to implement the HSM. These peer exchanges also fostered new relationships that will be useful for future endeavors to improve the Tennessee Safety Program.
For more information on the Tennessee peer exchanges, please contact Jessica Rich at Jessica.Rich@dot.gov.
The author would like to thank Ryan Tenges (Kentucky Division), Aaron Williams (North Carolina Division) and Karen King (Virginia Division) for assisting her in the development of these peer exchanges.
By: FHWA Office of Safety, National Highway Institute, and the Office of Safety Research and Development
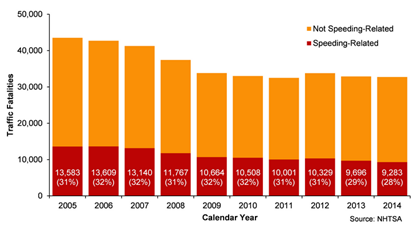
Speeding is a factor in almost one-third of all fatal car crashes in the United States. More than 112,500 people died in speeding-related US highway crashes from 2005-2014. This is roughly equal to the number who died in alcohol-involved crashes over the same period; however, speeding gets far less attention.
Findings from a recent study by the National Transportation Safety Board, Reducing Speeding-Related Crashes Involving Passenger Vehicles, indicate that substantial reductions in highway crashes cannot be achieved without a renewed emphasis among safety partners on reducing speeding.
FHWA agrees and considers speed management to be a key safety program for FHWA, which has identified improvements in three safety focus areas—roadway departures, intersections, and pedestrians and bicyclists—as having strong potential to reduce speeding-related fatalities.
Because speeding is impacted by a variety of cross-cutting factors, preventive safety measures should be addressed by State and local governments in a comprehensive speed management program. To support governmental agencies in creating speed management programs, the training and education arm of FHWA, the National Highway Institute (NHI), has released a new Speed Management training course. The course is a one-day, in-person event led by an NHI-certified instructor. In it, participants learn about life-saving countermeasures to shape speed management programs and how these programs can help communities reduce speeding-related injuries and deaths.
The training also explains the negative impact of speeding on community safety and describes how State and local governments can improve safety and reduce fatalities by specifically focusing on effective countermeasures for reducing speeding-related intersection, roadway departure, and pedestrian and bicycle crashes.
Participants who complete this training will be able to appropriately apply safety strategies and countermeasures to reduce speeding-related traffic fatalities as part of a comprehensive speed management program.
The course is ideal for transportation professionals from every level of government, as well as law enforcement and other public safety advocates who are interested in having safer roadways through the application of speed management principles. To learn more, visit the NHI website and search for "Speed Management 380116."
FHWA recently announced the recipients of the FHWA Safety Leadership Peer Awards and the Howard Anderson Lifetime Achievement Award. These awards are presented annually to recognize employees for their demonstrated leadership and accomplishments in highway safety.
Caroline Trueman, New Jersey Division Office. This award recognizes Caroline's outstanding efforts to advance highway safety in New Jersey and other states. Caroline has worked with the New Jersey Department of Transportation to institutionalize data-driven safety analysis in the state's Highway Safety Improvement Program (HSIP). She has also been a partner in the adoption of the AASHTO Highway Safety Manual (HSM) and incorporating data-driven safety analysis in project development and safety management. Her partnering efforts led to the development of a robust and formal HSIP process to advance safety projects in New Jersey, emphasizing the FHWA Safety Focus areas and proven safety countermeasures. Through Caroline's leadership, New Jersey also adopted the Toward Zero Deaths strategy as part of the state's updated Strategic Highway Safety Plan. In addition to her success in New Jersey, Caroline is a vital member of the Data Driven Safety Analysis Core Team and helps deliver technical assistance, training and other outreach activities across the country. Caroline exemplifies leadership in advancing safety initiatives and demonstrating FHWA values.
Tony Young, Kentucky Division Office. This award recognizes Tony's passionate contributions to highway safety in the Commonwealth of Kentucky and beyond. Tony was a driving force in the initiative to pass Kentucky's primary seat belt law and their "Click It or Ticket" campaign. He implemented and coordinated the annual Kentucky Lifesavers Traffic Safety Conference to improve the safety of motorists across the state. He led the recent update to the Kentucky Strategic Highway Safety Plan including organizing a peer exchange on safety performance measures and coordinated safety targets. Tony is also a champion of the FHWA National Traffic Incident Management (TIM) Responder Training Program, institutionalizing the training in the Kentucky State Police Academy, the Kentucky Board of EMS and the Kentucky Fire Commission training programs. Tony's outstanding efforts significantly improved highway safety in Kentucky and helped the state see a downward trend in fatalities since 2006.
Jerry Roche, Headquarters Office of Safety. This award recognizes Jerry's tireless leadership of the Every Day Counts (EDC) Data Driven Safety Analysis (DDSA) initiative. His personal oversight of 134 requests for technical assistance over the last 2 years has directly influenced the increase in the number of states incorporating DDSA practices into their safety management policies and processes. This has, in turn, contributed to better HSIP project selection and overall improved safety programs. Jerry's partnership with national research efforts and assistance to Division Office Safety Engineers and Specialists also advance DDSA practices nationally. Jerry often repeats his favorite fishing analogy - "Give a man a fish and you feed him for a day. Teach him to fish and you feed him for a lifetime." He applies this every day in his work because he believes the best way to lead is to teach others how to become successful at implementing and institutionalizing data-driven safety practices. In addition to this very deserving award, Jerry will also get to continue leading the DDSA EDC Round 3 again in EDC Round 4.
Howard Anderson Lifetime Achievement Award
In 1974, Howard Anderson was named the first FHWA Associate Administrator for Safety. In honor of his safety contributions to FHWA, the Howard Anderson Lifetime Achievement Award was established in 2014 to recognize a current or retired Federal Highway Administration employee who exemplifies outstanding and significant service to the safety discipline over his or her career. Nominees are evaluated for continuous efforts to champion safety both internally and externally to FHWA.
Nicholas Artimovich, Safety Engineer, is the recipient of the 2016 Howard Anderson Lifetime Achievement Award. With 41 years of service to FHWA, Nick has been an unflagging advocate for highway safety. Nick is known as a national expert in roadside safety hardware and roadside design. Nick provided crucial guidance and technical assistance to Division Offices, State DOTs and the design industry. Nick fostered strong relationships with FHWA, AASHTO, ATSSA and the Transportation Research Board. He served as Secretary of the AASHTO-ARTBA-AGC Task Force 13 since 1997 and the Secretary of the AASHTO Technical Committee on Roadside Safety since 2007. He played a major role in drafting the first AASHTO Roadside Design Guide and has been a primary author and contributor for all subsequent revisions. He was a major contributor in the development of the AASHTO Manual for Assessing Safety Hardware (MASH). These are all tools safety professionals across the country regularly use to ensure our nation's highways employ safe roadside hardware and design practices. Nick's expertise and leadership helped to bring research and practice together as well as contributing to the effective deployment of innovative technologies in safety devices.
Nick's dedication to the safety field began as an FHWA Highway Engineer Trainee in 1975. He joined the Office of Highway Safety in 1978, and then served in the Maryland Division from 1980 to 1988 as a Safety Coordinator and later as an Area Engineer. Since 1988 he has been with the Headquarters Office of Engineering (which later became part of the Office of Safety). To quote his nomination, "Nick has touched the lives of many people, and likely helped save many lives on our roadways. Although there is no way we can easily replace his wealth of knowledge and expertise, the information he shared and guidance he provided will be invaluable as we continue the important work of the agency."
It is for this dedication to a lifetime of work in highway safety that Nicholas Artimovich is the recipient of the 2016 Howard Anderson Lifetime Achievement Award. Nick was presented with his award upon retirement.
Earlier this year, FHWA's Acting Director of the Office of Safety Programs Michael S. Griffith and Roadway Safety Foundation (RSF) Executive Director Greg Cohen made a joint appearance on Federal News Radio to talk about how lives are being saved from the innovative safety improvements that are recognized by the National Roadway Safety Awards program.
The 2017 National Roadway Safety Awards, now in its 22nd year, is a biennial competition sponsored jointly by the FHWA and the Roadway Safety Foundation. The program is designed to acknowledge successful engineering solutions that agencies have integrated into their roadway safety programs and that move the United States towards zero deaths and serious injuries on the Nation's roadways. The award program is one way for the FHWA to recognize and celebrate life-saving projects and help State and local agencies to replicate them in other areas. Awards are given in two categories:
The Blue-Ribbon judges' panel, which reviews nominated projects and selects awardees, comprises a wide array of safety partners, including representatives from the Transportation Research Board, American Association of State Highway Transportation Officials, academia, FHWA's Local Technical Assistance Program, and the private sector. The winning projects, which will be announced in November 2017, exemplify innovative and effective safety activities that maximize the cost effectiveness of projects using Federal, State, local, and private sector funds.
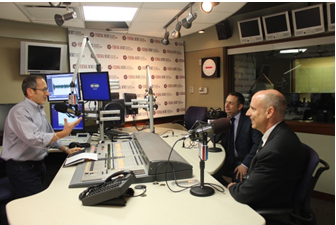 (Left to right) Tom Temin of Federal News Radio interviews Greg Cohen of the Road Safety Foundation and Michael Griffith of FHWA about their joint efforts to promote innovative approaches to improving roadway safety (photo courtesy of Federal News Radio).
 "We're very interested in recognizing noteworthy practices from around the country," Griffith said. "By shining a light on these projects that are actually saving lives, it allows us to give visibility to projects that other State and local agencies can learn from. Once the word gets out about these innovative treatments, other agencies can start to implement these improvements on their own roads."
For example, Kentucky, a 2013 award winner saw a 69 percent decrease in skid-related roadway departure crashes and fatalities on horizontal curves treated with high-friction surface treatment. The word spread very quickly about the effectiveness of such treatments, and other agencies were quick to explore the possibilities. A project from Arkansas, a 2015 award winner, saw an astonishing 93 percent drop in wet-weather crashes on the treated segment. In another example, Michigan spent only pennies per foot to install rumble strips on all high-speed, rural, non-freeway highways. After installation, crashes were reduced systemwide by nearly 50 percent.
In addition to safety and cost effectiveness, innovative use of technology is a key criterion for many winning entries. Florida DOT, another 2015 award winner, used an Advanced Lighting Measurement System to solve the labor intensive, expensive, and dangerous process of collecting crucial data on lighting intensity by using a vehicle-mounted sensor that collects data in real time, along the normal traffic stream. Data collection rates are now 300 times greater than traditional methods. After winning its RSA, FDOT received multiple requests from public agencies outside Florida for more information about the agency's approach to measuring corridor street lighting levels.
"One of the things we love about this program is that often the engineers and planners that do this work are the unsung heroes of transportation agencies," noted Cohen. What's more, "these projects are often not the projects that get the politicians out for ribbon cuttings…these are often little projects like changing the edge of the road so that the drop off isn't so bad, or putting in that high friction surfacing so motorcycles don't fly off the side of the road. Giving those folks some attention and recognition is what this is all about," he added.
The application deadline for nominations was June 9th, but look for a full report on the winning practices in the winter 2018 issue of Safety Compass. Don't want to wait? Visit the Office of Safety's National Roadway Safety Awards web page beginning in early November for a list of the winning projects!
Tenth SHRP 2 Safety Data Symposium: From Analysis to Results, October 6, 2017, Washington, D.C. Sponsored by the Transportation Research Board, this symposium will exhibit current research projects and serve as a forum for the exchange of ideas among researchers and practitioners from the private and public sectors. The second Strategic Highway Research Program produced research studies such as the Naturalistic Driving Study and the Roadway Information Database. Registration is limited to 150 participants and has no fee. Once the 150 participation limit is met, those wishing to attend will be placed on awaiting list, so don't wait to register!
American Society of Civil Engineers 2017 Convention, October 8–11, 2017, New Orleans, LA. The program for the Convention is integrated, cross-cultural, technical, and educational in nature – meeting the needs of the civil engineer. The attendees are the leaders in the civil engineering profession from across all disciplines and levels of experience. Visit the Annual Convention information page to learn more.
American Public Transportation Association Annual Meeting and Expo, October 8–11, 2017, Atlanta, GA. At this year's APTA Annual Meeting, keynote speakers and educational sessions explore hot topics, including transformative technology, community building, innovative funding and finance, safety, workforce development, worldwide mega projects, and more. This year's convention is also host to APTA's triennial EXPO, where more than 12,000 professionals from around the world come to connect, share, and discover the most innovative public transportation solutions. Visit the Annual Meeting and Expo information page to learn more.
National Association of City Transportation Officials Designing Cities 2017, October 30–November 2, 2017, Chicago, IL. This conference brings together 800 officials, planners, and practitioners to advance the state of transportation in cities. Workshops will address topics ranging from safe intersection design to signal strategies for bikes and transit. Attendees will also be taken on guided "Walkshops" to gain an in-depth understanding of how concepts translate into real-world applications. From bike lanes to bus bulbs, City of Chicago staff and local partners will host 30+ on-the-ground project tours. Visit the information page to learn more.
Transportation Research Board 97th Annual Meeting, January 7–11, 2018, Washington, D.C. The information-packed program is expected to attract more than 12,000 transportation professionals from around the world. The meeting program will cover all transportation modes, with more than 5,000 presentations in over 800 sessions and workshops, addressing topics of interest to policy makers, administrators, practitioners, researchers, and representatives of government, industry, and academic institutions. The spotlight theme for the 2018 meeting is Transportation: Moving the Economy of the Future. Visit the annual meeting information page to learn more.
ATSSA 48th Annual Convention and Traffic Expo, January 26-30, 2018, San Antonio, TX. The ATSSA annual expo brings together more than 3,000 business leaders, government officials, manufacturers, corporate roadway department personnel, and roadway safety stakeholders. The expo will showcase a variety of cutting edge traffic safety solutions and offer education and information sessions that will ensure attendees are operating safely and efficiently and are able to take away an understanding of the latest safety techniques and innovations. Visit the Convention information page to learn more.

The Office of Safety's 2017 STIPG interns
(left to right) Wilmari Valentin, Deja Jackson, and Nicole Wilson.
Each year, FHWA selects 80 to 100 law and graduate school students as well as undergraduate rising juniors and seniors from across the country to participate in the Summer Transportation Internship Program for Diverse Groups (STIPDG). This program provides a unique opportunity for students to gain valuable professional experience and skills that will complement their academic pursuits. Offering a 10-week period of paid hands-on training, STIPDG is designed to mentor and cultivate tomorrow's leaders, strengthen their understanding of the transportation industry, and prepare them for future public service opportunities. The STIPDG is open to all qualified applicants but is designed to provide qualified women, persons with disabilities, and members of diverse groups with summer opportunities in transportation where these groups have been under-represented.
This year, three of these interns are working in the Office of Safety, learning about activities ranging from how to evaluate educational materials to developing new interactive tools for States, to developing and calibrating SPFs.
Wilmari Valentin, University of Puerto Rico, Civil Engineering. During her internship, Wilmari has been working with the Safety Design Team. Her work has included evaluating web-based course materials, assisting the High Friction Surface Treatment (HFST) team in updating the HFST FAQ's document, developing an interactive U.S. map showing each State's progress on the implementation of HFST, and conducting research on connected vehicles and safety technologies.
Deja M. Jackson, University of Florida, Civil Engineering. Deja is a doctoral candidate whose research focus is in traffic safety, and she has a particular interest in motorcycle safety. In addition to reviewing the Road Safety Fundamentals textbook, she has been doing work related to the Highway Safety Manual, including performing sensitivity analyses and tracking state-specific SPF calibration and development efforts.
Nicole Wilson, Civil Engineering, University of Maryland, College Park. Nicole has been helping Office of Safety staff by working on updates to the Safety Data Dashboard, researching possible pedestrian and bike studies that will have benefits for the office, and supporting development of the new Road Safety Fundamentals Textbook.
is a publication of the U.S. Department of Transportation, Federal Highway Administration.
The Federal Highway Administration publishes the Safety Compass newsletter three times a year. We can be reached at:
FHWA Office of Safety
1200 New Jersey Ave. SE
Room E71-320
Washington, DC 20590
The Safety Compass is available online at the FHWA Office of Safety web site at: https://safety.fhwa.dot.gov/newsletter/safetycompass/.
We welcome your comments and highway safety-related articles. The purpose of this newsletter is to increase highway safety awareness and information and to provide resources to help save lives.
We encourage readers to submit highway safety articles that might be of value to the highway safety community. Send your comments, questions and articles for review electronically to Tara McLoughlin at: tara.mcloughlin@dot.gov

