U.S. Department of Transportation
Federal Highway Administration
1200 New Jersey Avenue, SE
Washington, DC 20590
202-366-4000
Best for printing: PDF Version (1.7 MB)
In this issue:
A Message from the FHWA Associate Administrator for Safety, Beth Alicandri
AWARDS NEWS
2017 Roadway Safety Awards Recognize Nine Noteworthy Road Safety Projects
SUPPORTING THE STATES: FEDERAL AID PROGRAMS
Strategic Safety Plan for Tribal Transportation Identifies High Priority Needs
BY THE NUMBERS: SAFETY DATA AND ANALYSIS
Roadway Safety Data Program – Tool and Toolbox Updates
MORE COMPLETE STREETS
FHWA Adds Six New Proven Safety Countermeasures for 2017
New FHWA Pedestrian Countermeasure Tech Sheets Now Available
FHWA Issues Revised Guide on How to Develop a Pedestrian and Bicycle Safety Action Plan
Walk Friendly Communities Program Advances Pedestrian Safety Countermeasures
SAFETY FOCUS AREA: ROADWAY DEPARTURE
New Report Details Results of 3D Ultra Laser Imaging for Pavement Surface Analysis
LEARNING TOGETHER
Attendees at CT Local Safety Data Integration Peer Exchange Share Lessons, Gain Insight
FHWA Holds Second Railway-Highway Grade Crossings Safety Webinar Series
ANNOUNCEMENTS
Seeking Agency Participation – Safety Data Business Planning

October marked the first anniversary of the Road to Zero (RTZ) Coalition, a key partnership among the FHWA, the National Highway Traffic Safety Administration, the Federal Motor Carrier Safety Administration, and the National Safety Council, which has dedicated itself to eliminating traffic fatalities by 2050. The urgency to assemble and grow the Coalition increased after the United States began losing momentum on the record roadway fatality reductions that had been achieved over the last decade. As the Coalition enters its second year, members are working hard to honor the 37,461 lives lost in 2016 from traffic crashes and will continue to work to prevent similar needless tragedies on our Nation's roads in the future.
This dynamic public-private partnership is already making a difference—and shortening the road to zero. One of the Coalition's great achievements is the broad, national support it has raised from over 400 members. Their time, willingness, energy, and talents are helping to cross-pollinate related disciplines at the national, State, and local levels.
The RTZ Grant Program, another coalition achievement, has dedicated $1 million to seven innovative grants focusing on research, behavioral modification and education, training, and roadway countermeasures. These grants will help to stimulate innovation and deploy lifesaving interventions that can quickly be replicated nationwide, saturating areas where consistently high numbers of transportation-related fatalities persist.
A third accomplishment is the creation of the RTZ advocacy platform. Currently under development, the first platform will include strategies stakeholders can implement to increase the use of safety belts in all seating positions. Several additional highway safety platforms are being drafted by coalition members to address infrastructure, truck underride, and others.
The Coalition has been hard at work planning our route toward a future transportation system in which zero fatalities is the norm. The RTZ Roadmap, which will be finalized and released in 2018, will outline the steps we need to undertake to reach zero by 2050.
"Some say ending roadway deaths is a moon shot, and it's impossible," said Debbie Hersman, president and CEO of the National Safety Council. "It's not impossible – it just hasn't been done yet."
We agree.
If you are attending the 97th Annual Transportation Research Board meeting this January, be sure to stop by booth 422 in the exhibit hall to check out all the Office of Safety has to offer.
We will be featuring free materials from all of our program areas, including:
Exhibit Hours will be as follows:
Sunday, January 7: 4:00 PM – 7:00 PM
Monday, January 8: 9:00 AM – 4:00 PM
Tuesday, January 9: 9:00 AM – 4:00 PM.
For more information, please contact Tara McLoughlin at 202-366-2176 or tara.mcloughlin@dot.gov
By: Tara McLoughlin, FHWA Office of Safety, and Lisa Bedsole, Leidos
On November 15, the 2017 National Roadway Safety Awards ceremony was held on Capitol Hill to honor exemplary highway safety projects and programs from across the country. Judged by a blue-ribbon panel comprising members from government, academia, associations, engineering institutions, and industry, this biennial awards competition honors noteworthy efforts by public agencies across the country to save lives on our Nation's roadways. The awards were conferred in two categories: Infrastructure and Operational Improvements and Program Planning, Development, and Evaluation.

"These awards recognize real and innovative solutions to some of the nation's biggest safety challenges," said Acting Federal Highway Administrator Brandye L. Hendrickson. "We commend this year's winners for their efforts in saving lives on our nation's roads, and invite others across the country to put these life-saving solutions to work."
Since 1999, FHWA and the Roadway Safety Foundation have partnered to sponsor this prestigious, national awards program. "The National Roadway Safety Awards are an opportunity to recognize the unsung heroes who plan, engineer and implement creative measures to help save lives on a daily basis and rarely receive credit for doing so," said RSF Executive Director Gregory Cohen.
Winners are selected based on criteria including effectiveness, innovation, and efficient use of available resources. Brief summaries of each winning project follow with more detailed descriptions appearing in the National Roadway Safety Awards 2017 Noteworthy Practices Guide.
Delaware's Systemic Safety Improvements Using High-Friction Surface Treatment. Roadway departures account for nearly 40 percent of Delaware's fatal crashes, and of these, half occur on curves. Focusing on roadway departure crashes on wet/snowy/icy pavement for all roadway segments in the State, Delaware installed more than 33,396 square yards of HFST at over 20 locations. Before/ after crash data shows that roadway departure crashes decreased by an average of 56 percent.
Florida's Wrong-Way Driving (WWD) Mitigation Initiative. In response to an uptick in WWD crashes, FDOT developed a high-level framework that focused departmental policy on reducing WWD crashes, revised design standards to more aggressively discourage wrong-way entry onto limited-access facilities, installed and evaluated emerging and experimental traffic control devices specifically designed to mitigate WWD, and instituted a WWD monitoring and tracking system. Preliminary indications show positive results: In Tampa Bay, which had experienced 7 WWD crashes and 11 fatalities in 2014, there were no WWD crashes in 2015 and only 1 crash resulting in 2 fatalities in 2016.
Michigan's Improved Incident Scene Safety with Partnerships. In Grand Rapids, MI, firetrucks responding to incidents were being struck by passing traffic, endangering both responders and the public. In response, the traffic incident management team established specific strategies to prevent further crashes of this type, including creating and deploying the Nation's first dump-truck-mounted crash attenuator to protect fire trucks. Instant Dispatch Towing, wherein tow trucks are immediately called to the scene of a wreck at the same time that other emergency vehicles are summoned, has also been implemented to facilitate quick clearance. These initiatives have resulted in a 31 percent decrease in the time it takes tow trucks to arrive on scene and a 45 percent reduction in crashes.
Minnesota's Implementation of Data-Driven Safety Solutions. To improve safety on county roads in Minnesota, which account for half of all fatal crashes, the State embarked on an ambitious undertaking in 2010 to develop County Road Safety Plans (CRSPs) for all 87 counties. Using the systemic approach to safety, the CRSPs focused on implementing proactive, low-cost safety strategies on a systemwide basis rather than reactive, higher cost safety projects at fewer locations. For a total of cost of $80 million, the Highway Safety Improvement Program funded 330 projects, leading to a 25 percent reduction in the county road fatality rate during the 4-year period following the CRSP process.
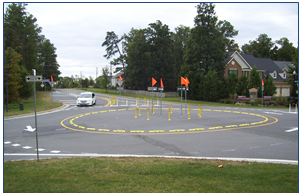
Virginia's Instant Roundabout. An intersection in Northern Virginia had a critical crash problem: as many as nine incidents were occurring each year, with nearly half involving injuries. The best traffic control for the intersection was a full-size roundabout, but this solution was both costly and time consuming. Instead, engineers developed an "instant roundabout" using off-the-shelf markings, tubular markers, and plastic curb sections instead of concrete. With community support, VDOT installed the instant roundabout in less than 6 days at a cost of only $90,000. As a result, crashes dropped by 30 percent, and the roundabout operated for nearly 3.5 years without a single injury crash.
Alaska's Safety Corridor Program. To eliminate two-lane, high-speed, head-on collisions, Alaska established "Safety Zones" on stretches of State roads with the highest fatal and major injury crash rates and traffic volumes at or near capacity. The resulting multi-disciplinary safety program, funded by traffic fines, uses the "4E's" (engineering, education, enforcement, and emergency medical services) approach to combat high-risk driving behavior and mitigate capacity problems within these Safety Zones until long-term improvements are built. Since 2006, fatal and major injury crashes are down in Alaska's four established Safety Corridors by 45 percent overall.
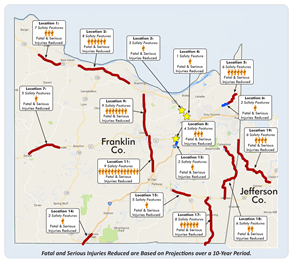
Missouri's "Road to Saving Lives" Design-Build Project. Searching for an effective way to implement its zero deaths strategy, MoDOT's St. Louis District identified 31 locations with the highest safety concerns in 2 counties and invited 5 teams to propose ways to address these locations. For this invitational bid, MoDOT chose a design-build procurement format that emphasized cost-effective safety treatments based on Highway Safety Manual analyses. The chosen team targeted safety improvements at all 31 locations and included a systemwide application of high-friction surface treatment, inlaid pavement markers, transverse rumble strips, LED stop signs, an intersection conflict warning system, and a roundabout. Over a period of 10 years, the project is expected to prevent 73 fatal and serious injury crashes.
New Jersey's Roundabout Implementation Program. The intersection of CR 528 and CR 660 in Chesterfield Township had experienced severe crashes and had been identified for improvements, with a modern roundabout being the preferred design alternative. Engineers and local officials were able to use innovative data-driven safety analysis tools to communicate the benefits of modern roundabouts to skeptical citizens, earning their support. Since installation, a before-and-after crash analysis indicated a 100 percent reduction of right-angle and left-turn crashes on the roundabout, which was completed in 2014. Due to the success of this installation, construction of modern roundabouts has since been approved in nine counties, and several others are in the process of submitting applications.
Tennessee's Safety Projects Evaluation. To determine the effectiveness of a variety of safety improvements made in recent years, the Tennessee DOT (TDOT) committed to analyzing the effectiveness of safety projects implemented in its Highway Safety Improvement Program between 2011 and 2014 in a two-phase analysis. Using 3 years of pre-treatment ("before") crash data and 3 years of post-treatment ("after") crash data, the Phase One analysis examined 261 sites and found that the TDOT safety program has been successful in reducing crash frequency by 60 percent. In Phase Two, TDOT conducted an Empirical Bayes before-and-after evaluation of 45 sites and found that 56 percent of treated sites had seen a reduction in after-crash frequency compared to before-crash frequency.
By: Adam Larsen, Office of Federal Lands Highway
Transportation safety issues are overrepresented among Native American and Alaska Native populations. Based on the available data, which is known to be underreported, motor vehicle crashes caused an average of 655 fatalities each year in Tribal areas.
What causes these fatal crashes to happen? To answer this question, the Tribal Transportation Safety Management System (SMS) Steering Committee researched 5 years of fatality data, transportation safety plans developed by tribes, and other data sources. The committee used this analysis to identify seven topics to emphasize in a Tribal Transportation Strategic Safety Plan (the Safety Plan), which was published in August. A follow-on report to Congress summarizing this safety plan will be published soon.
The Safety Plan also identifies overall trends, which may help to guide national technical assistance efforts and may be useful for State and Tribal planning efforts. However, each Tribal government is strongly encouraged to develop a local road safety plan that reflects a local data analysis and safety priorities.
The seven topics that the committee identified as being of greatest concern in Tribal areas include:
General Topics:
Emphasis Topics:
The Safety Plan also provides strategies and resources that can be used by Tribal governments to address these trends and improve safety within these focus areas.
At present, the SMS Steering Committee is identifying and discussing a variety of options for supporting the Tribes in improving safety in these seven areas. These efforts may include a national Tribal safety conference, a webinar series dedicated to safety concerns within the focus areas, pilot projects, and case studies. In addition, the agencies on the committee will continue to provide technical assistance in these and other areas of concern where Tribes may request support.
Additional resources and information, including a copy of the safety plan and a link to listen to live SMS meetings are on the SMS Steering Committee website. A mailing list is also available to those interested in regular updates on committee meetings and other items of interest related to Tribal transportation safety.
By: Stuart Thompson and Yanira Rivera (FHWA) and Frank Gross and Meg Bryson (VHB)
As any mechanic knows, using the right tools for the job is crucial. When the job is collecting, managing, and analyzing roadway safety data, where do you start? In December 2014, the FHWA Roadway Safety Data Program (RSDP) team launched a new resource–the Roadway Safety Data and Analysis Toolbox–to help users answer that question. The virtual Toolbox serves as a clearinghouse of roadway safety data and analysis tools such as guides, software, and databases from diverse sources. A web-based interface helps users to search and filter through nearly 200 safety data and analysis tools based on self-identified needs, capabilities, and resources.
FHWA performs regular maintenance to make sure that the Toolbox stays up to date. Since the launch of the Toolbox, FHWA has added new tools in direct response to States' requests, updated hyperlinks, and removed and replaced obsolete tools. The following list highlights the select new tools added to the Toolbox in 2017. Users can click each tool title to read more and access the tool from the Toolbox.
| FHWA's Roadway Safety Data and Analysis Toolbox New Tools Available | Primary Topic Area | |||
|---|---|---|---|---|
| Manage | Analyze | Collect | Research | |
| Roadway Data Extraction Tool User Guide This application guide introduces users to the importance (and value) of high-quality safety data, safety data analysis tools and methods, and data-driven decision making. It focuses on the needs of safety data collectors and teaches users how to assess equipment, costs, and other resources required to collect and manage safety data. |
✓ | ✓ | ||
| Roadway Data Extraction Tool Implementation and Programming Guide This application guide helps users better understand the needs of safety analysts and safety data collectors. It can help agencies measure, maintain, or improve quality safety data by employing either traditional or state-of-the-art techniques to collect high-quality safety data efficiently and cost effectively. |
✓ | ✓ | ||
|
Bicycle and Pedestrian Data Collection Manual This application guide offers allows users to improve their understanding of safety data collection, management, and improvement with a focus on bicycle and pedestrian data. |
✓ | ✓ | ✓ | ✓ |
| A Performance-Based Highway Geometric Design Process This information guide supports user understanding of the value of high-quality safety data and state-of-the-art safety data analysis tools and methods. It also focuses on the importance of safety data integration in supporting data-driven decision making in the safety management and project development processes as it relates to the performance-based design process. |
✓ | ✓ | ||
In conjunction with the development of the Toolbox, FHWA developed several new tools to address priority gaps identified by the States. One of these is The Calibrator, which will help users calibrate safety performance functions (SPFs) and assess the compatibility and applicability of SPFs. The tool automates the calibration process and provides goodness-of-fit measures to assess how the SPF performs over the range of data. Version 2.0 of The Calibrator corrects bugs identified in Version 1.0 and includes an accompanying user guide and training materials on how to use the tool.
FHWA is currently developing Version 3.0 of The Calibrator. It will include new material developed for the second edition of the Highway Safety Manual. Specifically, it will allow users to estimate and assess calibration functions. It will also add new SPFs that will be included in the second edition of the Highway Safety Manual. If you have other suggestions for enhancements to The Calibrator, now is the time to act. Please click the following link to provide feedback or email Stuart Thompson directly at stuart.thompson@dot.gov.
By: Abdul Zineddin, FHWA Office of Safety R&D
On September 15, 2017, the Federal Highway Administration (FHWA) released version 13.0.0 of the Interactive Highway Safety Design Model (IHSDM), a suite of software analysis tools for evaluating the safety and operational effects of geometric design decisions. With the addition of a new Economic Analyses (EA) Tool in this NEW 2017 IHSDM release, users can now conduct economic analyses within IHSDM using Crash Prediction Module (CPM) evaluation results (crash frequencies and severities). The initial version of the IHSDM EA Tool applies to freeways and will be expanded to include all facility types covered by Part C of AASHTO's Highway Safety Manual (HSM).
IHSDM supports the Data-Driven Safety Analysis initiative as part of FHWA's Every Day Counts 3 (EDC3) efforts. The CPM, for example, is a powerful tool that implements HSM Part C, Predictive Methods, for rural two-lane highways, rural multilane highways, urban/suburban arterials, and freeways and interchanges. Typical applications of the CPM include evaluating the safety impact of highway improvements, comparing the relative safety performance of design alternatives, and assessing the cost effectiveness of design decisions vis-á-vis the safety result.
IHSDM includes six evaluation modules, which provide quantitative information on the expected safety and operational performance of a highway design: Crash Prediction, Policy Review, Design Consistency, Traffic Analysis, Intersection Review, and Driver/Vehicle.
IHSDM software can be downloaded free of charge at the Interactive Highway Safety Design Model web site. For more information, contact Abdul Zineddin at abdul.zineddin@dot.gov
By: Esther Strawder, FHWA Office of Safety
The foundation for effective highway safety decisions is great data. While crash data has played a vital role in safety planning to date, crashes are only part of the larger safety picture; roadway and traffic data are also essential. By incorporating roadway and traffic data into network screening analysis, prioritization, and countermeasure selection, decision makers can better identify safety barriers and prescribe solutions to improve safety and make more efficient and effective use of safety resources.
The first State Safety Data Capability Assessment contributed to the evolution of more robust roadway data systems in each State by helping them identify gaps in their own programs while simultaneously collecting the information necessary to provide an understanding of the national state of roadway data systems and capabilities. To assist States and Division offices in advancing the collection, analysis, and management of roadway safety data, the Office of Safety, in cooperation with NHTSA, is again evaluating the States to reassess their current safety data capability with a focus on roadway data. This second data capability assessment–an essential component of our long-term vision towards zero deaths and serious injuries on all public roadways–will identify gaps and initiate activities to move the Nation forward in safety data analysis.
The first step in the second assessment has been to update the process for assessing the data capabilities of the States and pilot the new process in Arizona, Missouri, Washington, and Louisiana. This process is based on the Capability Maturity Model (CMM) concept, which originated in the information technology arena to track the development of sophisticated software systems. These models are now being more widely applied as a means for identifying phases of growth and development from a combined qualitative and quantitative perspective. Using the updated CMM platform, each State will be given an objective review of its current capabilities status and an action plan framework that outlines steps for moving forward to strengthen less developed data capabilities and maintain or advance areas that have already achieved higher capability levels.
Over the next several months, FHWA will compile existing information for each of the pilot States to fill out as much of the assessment questionnaire as possible prior to meeting with agency staff. The project team will review all of the resources that contain information on a State's safety data that currently exist, including:
While the results of this project will serve as an important snapshot of the current systems and capabilities, they will also serve as an internal scorecard by which agencies can measure their own improvement and provide a gap analysis for future enhancements. Long-term, this effort will give FHWA and the pilot States a very valuable performance measure for funding future projects that will also be useful in tracking longer term economic impacts of data investment.
While this project is expected to be complete in October 2018 and will inform a national report on these important State Safety Data Capability Assessments, the FHWA's RSDP will also be enhanced to continue advancing all safety data management practices. It's worth noting that FHWA recognizes the importance of confidentiality, so the results of individual State assessments will not be shared with other States. States may do whatever they wish with their own results, but FHWA will not share these results.
If you have further questions or comments about this project, or if you want to learn more about this assessment and how your State can benefit from additional technical assistance, please contact: Esther Strawder at (202) 366-6836 or via email at esther.strawder@dot.gov.
By: Emeka Ezekwemba, FHWA CO Division, Jerry Roche, FHWA Office of Safety, and Abdul Zineddin, FHWA Office of Safety R&D
I want to thank you for all the work on this project. Without your help and expertise in the IHSDM software this project would not have been able to go to construction.
— Jacob Southard, CDOT Project Engineer
I-225 is a 13-mile freeway that links I-70 and I-25 in the Denver metropolitan area. This critical connector provides major access to numerous municipalities in Denver, Adams, and Arapahoe counties. In 2016, the Colorado Department of Transportation (CDOT) started development on an interim project to eliminate a 2-mile bottleneck on southbound I-225 by restriping the existing facility. Although the primary purpose of the project was congestion relief, CDOT also wanted to understand how both I-225 and the downstream I-25 corridor would perform from a safety perspective prior to implementation. There is a great deal of data that documents the effects of reducing lane widths from 12 ft. to 11 ft., but CDOT wanted to understand the impacts of reduced lane widths in combination with a new travel lane, in conjunction with short sections of narrow shoulders, and concurrent with new access restrictions. Furthermore, the agency also wanted to gauge the corresponding impact to the surrounding local roadway network.
To answer these questions, the Every Day Counts (EDC), Data Driven Safety Analysis (DDSA), and TFHRC's Geometric Design Laboratory (GDL) teams provided technical assistance to CDOT and its partners by developing a Predictive Safety Model using the Interactive Highway Safety Design Model (IHSDM).
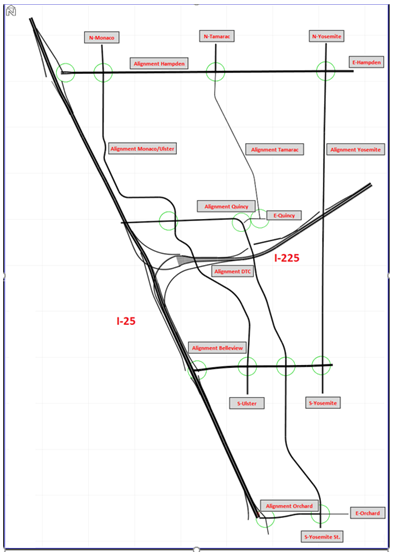
IHSDM, or specifically the IHSDM Crash Prediction Module (CPM), directly implements the Highway Safety Manual (HSM). Its major benefit is that it automates much of the segmentation and data entry processes by allowing the user to upload design files directly (Figure 1). This automation then allows more complex data analysis and alternatives development to be completed on an accelerated schedule. In addition to the geometric design files, two other primary sets of data were supplied to run the model: historic crash data supplied by CDOT and existing and forecasted volumes supplied by the Denver Regional Council of Governments (DRCOG).
By using the IHSDM tool, the project team quickly analyzed a combination of alternatives and effects. The notable features, combinations, and concepts that the Predictive Safety Model needed to address included:
The Predictive Safety Model was very helpful in eliminating subjective arguments and expediting complex decision making to meet CDOT's project schedule. The results of the analysis showed no significant adverse impact to safety.
The primary purpose of the project is to provide congestion relief, and that goal was supported by a traffic operations model that predicted an over-whelming amount of time savings. In the end, however, the project was enhanced to include additional measures that would balance safety with operations. As noted in the list above, CDOT provided an upstream entry ramp to ensure emergency services could still access SB I-25 via I-225 from the restricted on-ramp in the Denver Technical Center. Minor shoulder widening was also included. In addition, CDOT and its partners committed to performing a before-and-after study and identified a near-term resurfacing project that could be used to implement any additional improvements.
By: Jeffrey Shaw, FHWA Office of Safety
In September 2017, the FHWA Office of Safety introduced an additional six proven safety counter-measures to enhance the already robust portfolio of safety strategies for State and local transportation professionals to consider implementing as part of their efforts to improve safety on the Nation's roadways.
The Proven Safety Countermeasures initiative (PSCi) began in 2008 with nine countermeasures and strategies. The vision and goal of the PSCi established then remains the same today: to encourage the widespread implementation of select, proven safety treatments and strategies to accelerate efforts to save lives and prevent injuries on our Nation's roads. The initiative was updated in 2012 with five additional countermeasures that aligned with the data-driven, focused approach pillars of the FHWA Safety Program: Roadway Departure, Intersections, and Pedestrians/Bicycles. This most recent update of the initiative adds six new countermeasures and crosscutting strategies.
The comprehensive list of all 20 Proven Safety Countermeasures is diverse and broad, and while it aligns with the three FHWA Safety Focus Areas, it also includes crosscutting strategies. Visit the Proven Safety Countermeasures web page today to learn more about these and other effective safety countermeasures for rural roads and urban streets alike.
For more information or assistance, please contact Jeffrey Shaw at jeffrey.shaw@dot.gov.


By: Becky Crowe, FHWA Office of Safety
The newly released EDC-4 Safe Transportation for Every Pedestrian (STEP) tech sheets provide information to transportation planners, traffic safety engineers, and other decision makers about the safety benefits and design considerations for the five STEP countermeasures. Each tech sheet is a two-page, full-color summary with illustrations and safety statistics for the following countermeasures: crosswalk visibility enhancements, raised cross-walks, pedestrian refuge islands, pedestrian hybrid beacons (PHB), and Road Diets.
The first page of each tech sheet prominently displays the Crash Reduction Factor (CRF) for the countermeasure. The CRF is the percentage crash reduction that might be expected after implementing a given countermeasure at a specific site. PHBs, advance stop/yield signage, and pedestrian refuge islands feature updated CRFs from the newly published NCHRP Report 841: Development of Crash Modification Factors.1 For example, this report found a CRF of 32 percent for pedestrian crashes at locations with pedestrian refuge islands. The remaining countermeasures include CRFs from other sources, including the 2008 report "NCHRP Report 617: Accident Modification Factors for Traffic Engineering and ITS Improvements"2 and the 2012 Accident Prevention & Analysis article "Safety Countermeasures and Crash Reduction in New York City–Experience and Lessons Learned."3 The second page provides additional photo examples and design considerations including AADT, roadway speeds, and long-term maintenance concerns. For example, when considering crosswalk visibility enhancements, the designer should place parking restrictions, advance warning signs, and advance stop/yield markings at least 20 feet from the crosswalk. When considering raised crosswalks, the designer should avoid priority transit or emergency routes and consider drainage, snow removal, and maintenance of in-street warning signs.
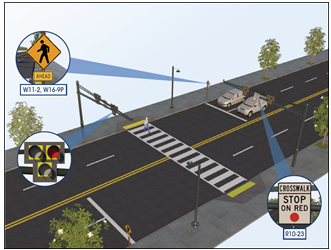 Figure 1. Pedestrian hybrid beacon tech sheet rendering.
 Each tech sheet also provides helpful graphics, such as the rendering of a PHB installation shown in Figure 1, which includes an advance stop bar and warning sign, overhead lighting placed before the crosswalk, and the beacon head. Other countermeasure renderings show options for parking restrictions, curb extensions, bicycle lanes, and other roadway design features. Agencies can refer to these renderings for examples of how the countermeasure may appear on a roadway or in combination with other safety features, such as pavement markings and overhead lighting. Illustrations also include signage that may increase visibility of the crossing or are recommended per the Manual on Uniform Traffic Control Devices.
The tech sheets also include per-unit cost averages or ranges to install the countermeasure based on the 2013 Pedestrian and Bicycle Information Center article "Costs for Pedestrian and Bicyclist Infrastructure Improvements: A Resource for Researchers, Engineers, Planners, and the General Public."4 For example, the tech sheet for pedestrian refuge island explains that the cost to install is an average of $10 per square foot, but costs can be higher when using concrete instead of asphalt FHWA is producing additional guidance–planned for release by early 2018–to assist agencies with the countermeasure selection. The tech sheets are available on the FHWA STEP website.
State and local transportation professionals should consider sharing the tech sheets as educational materials when discussing pedestrian safety and design improvements with the public and decision-makers. The tech sheets' succinct descriptions, updated safety benefits, and illustrations of the countermeasures may help agencies take "steps" towards a safer pedestrian environment.
For more information, contact your local FHWA Division office or Becky Crowe, STEP program manager, at rebecca.crowe@dot.gov.
1 C. Zegeer et al., NCHRP Report 841: Development of Crash Modification Factors for Uncontrolled Pedestrian Crossing Treatments. Washington, DC: Transportation Research Board of the National Academies, 2017.
2 D.L., Harkey et al., NCHRP Report 617: Crash Reduction Factors for Traffic Engineering and ITS Improvements. Washington, D.C.: Transportation Research Board of the National Academies, 2008.
3 L. Chen, et al., "Safety countermeasures and crash reduction in New York City–Experience and lessons learned." Accident Analysis & Prevention 50 (2012): pp. 312-322.
4 M., Bushell, B. Poole, C. Zegeer, & D. Rodriguez., Costs for Pedestrian and Bicyclist Infrastructure Improvements: A Resource for Researchers, Engineers, Planners, and the General Public. Pedestrian and Bicycle Information Center, 2013.
As bicycling and walking both for better health and as a transportation mode become more popular across the Nation, the number of fatalities and serious injuries among this vulnerable user group has increased, with 2015 witnessing a 9.5 percent surge in pedestrian fatalities and a 2.3 percent rise in bicycle fatalities from 2014, according to the National Highway Traffic Safety Administration.
Accordingly, the Office of Safety has revised and re-issued the guide entitled How to Develop a Pedestrian and Bicycle Safety Action Plan, which is aimed at helping State and local officials decide where to begin to address pedestrian and bicycle safety issues. The newly updated guide, issued in the fall of 2017, is designed to help agencies enhance existing safety programs and activities, including identifying safety problems and selecting optimal solutions. The guide also serves as a reference for improving pedestrian and bicyclist safety through a multidisciplinary, collaborative approach to safety that includes enhanced street designs and countermeasures, policies, and behavioral programs. Engineers, planners, safety professionals, public health and injury prevention professionals, and decision makers who have responsibility for improving pedestrian and bicycle safety at the State or local level will find this guide useful. Users will be able to develop Pedestrian and Bicycle Safety Action Plans that will:
The guide also offers options for funding strategies and a variety of other resources for planning and implementing identified countermeasures, projects, and activities. For more information on the guide or for assistance with developing your Pedestrian and Bicycle Safety Action Plan, contact Tamara Redmon at tamara.redmon@dot.gov.
By: Becky Crowe, FHWA Office of Safety
Walk Friendly Communities (WFC) is a national recognition program developed to encourage municipalities across the United States to prioritize support for safe and comfortable walking environments. Supported by the Pedestrian and Bicycle Information Center and operated by the University of North Carolina Highway Safety Research Center, WFC supports the twin goals of increasing the level of walking and reducing pedestrian crashes through policies, projects, and programs.
Since 2010, over 160 communities have submitted applications for assessment and recognition as a "Walk Friendly Community." While every community receives detailed feedback, 64 communities have been recognized with a designation of Bronze, Silver, Gold, or Platinum. The WFC assessment tool was developed through a review of relevant programs, guides, and research; collaboration among a diverse group of pedestrian experts; and pilot testing among communities. The designations are good for 5 years, so communities must reapply to maintain their designation or move up a level.
In addition to assessing planning, education, encouragement, enforcement, and evaluation practices, the WFC assessment tool asks applicants to explain their design guidelines and implementation of proven safety countermeasures for both pedestrians and other roadway users. Many of these countermeasures used among communities recognized as being Walk Friendly are being promoted through the Every Day Counts (EDC-4) Safe Transportation for Every Pedestrian (STEP) program; for example, crosswalk visibility enhancements, raised crosswalks, pedestrian refuge islands, Road Diets, and pedestrian hybrid beacons.
Communities that have received a Walk Friendly designation have a demonstrated commitment from staff, advocates, and elected officials to ensure that street projects include safety improvements for pedestrians. Some communities have programs that support standalone pedestrian improvements like sidewalks or the systemic installation of a safety countermeasure like high-visibility crosswalks, refuge islands along corridors, or pedestrian hybrid beacons.
In October 2017, the WFC program recognized eight communities. Columbus, OH, received a silver-level designation and seven other communities were re-designated:
Gold:
Silver:
Bronze:
These communities range in size from 8,000 to 850,000 residents. Regardless of size, however, they all offer examples of how to make streets safer for pedestrians. For example:
Columbus, OH, (pop. 824,000) evaluates locations for midblock crosswalks and visibility improvements when roadways are resurfaced or improved, when development occurs in the area, and in response to safety concerns. The city is currently working on a street design manual that will formalize many of the city's practices for installing pedestrian crash countermeasures.
Since first applying in 2012, Washington, D.C. (pop. 674,000), has installed dozens of curb extensions and pedestrian refuge islands to improve visibility and shorten the crossing distance for pedestrians. The city has also installed 16 pedestrian hybrid beacons in the last 5 years and routinely conducts safety evaluations for many of its countermeasure projects.
In Northampton, MA (pop. 28,000), the Public Works department includes sidewalks and pedestrian improvements in their roadwork projects, and Northampton is currently transforming a gateway road into the city with lane narrowing, curb extensions, pedestrian refuge islands, raised crosswalks, sidewalks, and a raised intersection.
WFC applications are accepted twice each year, so check the WFC website for important information about the process and to access an assessment tool that helps communities plan for and prepare their applications. For more information, please send an email to info@walkfriendly.org. For more information about STEP or other information on improving pedestrian safety, please contact your local FHWA Division office or Becky Crowe, STEP program manager, at rebecca.crowe@dot.govBy: Karen King, FHWA Virginia Division
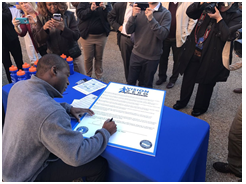
Embracing the goal of eliminating traffic deaths, Mayor Levar Stoney signed a pledge to make Richmond, VA, a Vision Zero city on October 27, 2017. That commitment puts the city in alignment with others striving to dramatically reduce and even eliminate traffic fatalities and severe injuries by 2030. The City's Safe and Healthy Street Commission is charged with developing the Vision Zero plan and plan to have it complete by February 2018. This commission is multidisciplinary with active participation from the police department, public health, engineering and active citizen involvement.
City leadership is focusing on a different message each month for 2018, encouraging discussion and awareness of community meeting announcements, neighborhood newsletters and social media discussion groups. Messages will focus on increasing awareness of people who walk; drive unbelted, drowsy, or impaired; walk across railroads; work on the roads; bike; and ride motorcycles, among others.
By: Joseph Cheung, FHWA Office of Safety
The FHWA Office of Safety – Safety Design Team recently completed a Pavement Safety Analysis research project entitled "Safety Analysis Opportunities Using Pavement Surface Characterization Based on 3D Laser Imaging." This project demonstrated the use of the state-of-the-art 3D Ultra Laser imaging data collection methodology, which incorporates an integrated data platform and higher data resolution. This technology offers full-width pavement coverage, less interruption to traffic, and more robust software solutions that will result in a more efficient and cost-effective data collection process. It may also potentially lead to new measurement standards that will improve pavement safety evaluation, as pavement surface properties play critical roles in maintaining proper interaction between tire and pavement in addition to allowing for the necessary level of drainage for both pavement and safety management.
The project, which collected pavement surface characteristic data in several States, also demonstrates the value of continuous friction measurement with state-of-the-art safety analysis tool as part of pavement friction management program. Specifically, three applications based on 3D Ultra have been investigated in this study for various aspects of pavement surface safety analysis:
The project is now available on the Office of Safety's Pavement Friction Resources page. For additional questions, please contact Joseph Cheung at joseph.cheung@dot.gov.
By: Stuart Thompson, FHWA Office of Safety
The Connecticut Local Safety Data Integration Peer Exchange was held in Wethersfield, CT, on September 7, 2017. Sponsored by the FHWA Office of Safety's Roadway Safety Professional Capacity Building Program, the peer exchange drew participants from Federal, State, and local agencies in Connecticut, Kansas, Louisiana, and New York. Attendees shared perspectives on data sharing systems and data governance related to local roadway and crash data.
The peer exchange is one element of an overall technical assistance effort in which FHWA is working with Connecticut DOT (CTDOT) to identify improvements in safety data integration using strategies identified in the Informational Guide for State, Tribal, and Local Safety Data Integration. With support from FHWA, Connecticut is working with groups composed of target agencies to develop a data business plan for the integration of safety data to improve safety capabilities on all public roads. The intent of this peer exchange was to review the steps in the safety data integration process presented at an earlier CTDOT workshop and to assess local agencies' capability to collect integrate, and analyze safety data. The lessons and insights gained from the peer exchange will be incorporated into the Connecticut Safety Data Integration Business plan and shared with local participants.
Some overarching takeaways from the event that may be applicable to other States include:
FHWA's State and Local Data Integration Project is designed to help State, Tribal, and local agencies identify cost-effective ways to develop safety data systems that integrate safety data on all public roads. For more information or to request technical assistance, please contact Stuart Thompson at stuart.thompson@dot.gov.
By: Kelly Morton, FHWA Office of Safety
The Federal Highway Administration (FHWA) and the Federal Railroad Administration (FRA) held their second webinar in a new joint Webinar Railway-Highway Grade Crossings Safety Series on Wednesday, October 18, 2017. The webinar series discusses a variety of highway-rail grade crossing issues, as well as tools and strategies to enhance safety. This second webinar focused on the Grade Crossing Inventory reporting requirements, inventory systems and uses of inventory data. There were approximately 150 participants in this webinar, which was open to all partners including Federal, State, local, and railroad agencies. Recordings of the webinars are posted on the Rail-Highway Crossings Program webpage under the Resources section. The next webinar will be held in late January or early February 2018.
Data business planning helps State DOTs and partner agencies meet the need for safety data collection, integration, and analysis to support a safety data system. FHWA is seeking opportunities to work closely with agencies to improve safety data management and governance using strategies identified in the recently published Guide for State Department of Transportation Safety Data Business Planning (FHWA-SA-17-047). FHWA invites States to request technical assistance in developing their own SDBP. The State DOT must be involved, but does not need to take the lead on the technical assistance. Technical assistance is available to help agencies produce a fully implementable plan by navigating the seven steps of developing an SDBP. If interested, please contact Stuart Thompson stuart.thompson@dot.gov.
2018 National Bike Summit, March 5–7, 2018, Washington, D.C. (http://bikeleague.org/summit). This year's theme is "Grass Roots Grow Together," and the focus will be on showcasing successes at the local level, learning how they happen and exploring ways to expand their reach. Peer learning is a critical component of growing and strengthening the bicycling movement, and will play an important role in this year's event.
2018 National Work Zone Awareness Week, April 9-13. The 2018 National Work Zone Awareness Week will be hosted by the state of Illinois, with a national kick-off event scheduled for Tuesday, April 10. The proposed location for the kick-off event is the Jane Byrne Interchange reconstruction Project in the Chicago metro area. Visit https://ops.fhwa.dot.gov/wz/outreach/wz_awareness.htm to learn more about this event and for resources that can help you improve work zone safety in your State.
2018 Lifesavers Conference, April 22-24, 2018, San Antonio, TX (https://lifesaversconference.org/). The Lifesavers Conference brings together a unique combination of public health and safety professionals, researchers, advocates, practitioners and students committed to sharing best practices, research, and policy initiatives that are proven to work. Workshops will address a wide variety of safety-related issues from across the 4Es of safety.
NACE, April 22-26, 2018 Annual Meeting/Management & Technical Conference, Wisconsin Dells, WI (http://www.naceevents.org/about-nace-2018). This annual conference will allow attendees to compare competing technologies and services, yet spend quality time with the solution providers and peers. The conference includes a series of sessions on topics related to construction and construction management, pavement surfacing and preservation, emergency management, local road safety plans, and much more.
is a publication of the U.S. Department of Transportation, Federal Highway Administration.
The Federal Highway Administration publishes the Safety Compass newsletter three times a year. We can be reached at:
FHWA Office of Safety
1200 New Jersey Ave. SE
Room E71-320
Washington, DC 20590
The Safety Compass is available online at the FHWA Office of Safety web site at: /newsletter/safetycompass/.
We welcome your comments and highway safety-related articles. The purpose of this newsletter is to increase highway safety awareness and information and to provide resources to help save lives.
We encourage readers to submit highway safety articles that might be of value to the highway safety community. Send your comments, questions and articles for review electronically to Tara McLoughlin at: tara.mcloughlin@dot.gov


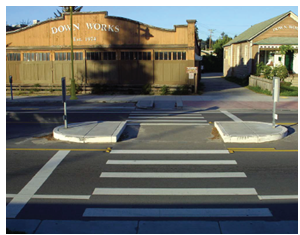 Example of a pedestrian refuge island.