U.S. Department of Transportation
Federal Highway Administration
1200 New Jersey Avenue, SE
Washington, DC 20590
202-366-4000
Downloadable Version
PDF [1.95 MB]

Chapter 2 – Understanding the Data
How is crash a reported?
Unreported Crashes
Accident Reports & Definitions
Interpretation & Assumptions
What is NOT captured in the data?
Notes about Terminology
Chapter 3 – Approach & Methodology
Approach
Context, Environment & Injuries
Pedestrian Information
Motorist Information
Overview
When are crashes occurring?
Environmental Conditions
Pedestrian Age
Pedestrian & Driver Condition
Pre-crash Maneuver
Roadway Type
Injury Severity/Fatalities
Cost of Crashes
Where are crashes occurring?
Chapter 5 – Discussion, Approaches & Recommendations
Summary of Findings
Approaching Pedestrian
Safety
Action Plan
The 2010 Louisville Pedestrian Master Plan has two primary goals: (1) to improve and expand current pedestrian deficiencies – by preparing a capital improvement process that enables Louisville to increase that pedestrian facility network through retrofitting and expanding current deficient sidewalk and pedestrian crossing locations between 2010 and 2030, and (2) to simultaneously reduce the rate of pedestrian crashes between 2010 and 2030. The findings in this report should be used to inform and influence the design of new pedestrian facilities, the redesign of existing roadways, the development of education programs and enforcement campaigns for pedestrians and motorists.
Overall traffic crashes; 2006 – 2010:
|
Accidents involving pedestrians; 2006 – 2010:
|
When crashes occur:
Who is involved:
Injuries and fatalities:
Causes of crashes:
Where crashes are occurring:
Fatalities per 100,000 Population (2010 data1,2)
Compared to peer cities with comparable populations, Louisville's traffic fatality rate is only less than Oklahoma City's.
The analysis of pedestrian-motorist crashes found that crashes are complex events and there is no one factor that is contributing to crashes. However, four primary conclusions emerge from the data:
The recommendations aim to:
Education
Encouragement
Enforcement
Engineering
Evaluation
Of all the fatalities occurring on Metro roadways, 23% are pedestrian fatalities. That is why Louisville has conducted a 5-year pedestrian crash analysis to identify trends, high risk populations and high crash locations to target efforts to reduce pedestrian injuries and fatalities.
Vision: For Louisville to become the safest and most appealing community for pedestrians!
Mission: Create a community wide culture that supports pedestrians through physical improvements, policies and pedestrian programs by increasing the pedestrian system network while simultaneously reducing the rate of pedestrian crashes.
The 2010 Louisville Pedestrian Master Plan has the goals of (1) to improve and expand current pedestrian deficiencies – by preparing a capital improvement process that enables Louisville to increase the pedestrian facility network through retrofitting and expanding current deficient sidewalk and pedestrian crossing locations between 2010 and 2030, and (2) to simultaneously reduce the rate of pedestrian crashes between 2010 and 2030. These goals outline the steps Louisville will take in several areas to achieve the Vision.
Because this is the first comprehensive crash analysis conducted by Louisville Metro, the data are presented in a comprehensive manner – thoroughly educating readers about crash data sources, the findings of the analysis and most importantly, how the data can inform countermeasures.
The report begins by providing crash data and reporting in Chapter 2. Chapter 3 discusses the approach and methodology used for this analysis. Chapter 4 is the results section – covering when, why and where crashes are occurring. Chapter 5 closes with a discussion about approaches to improve pedestrian safety and utilize the results to implement countermeasures. The Appendix includes supplemental data, a comparison of peer cities, additional maps, crash rates and corridor analysis.
Planners and engineers should refer to this document when designing new facilities to ensure pedestrian comfort is prioritized and prevalent crash types are considered in the design. Those educating road users should incorporate the findings into curriculum, safety campaigns and other media. Policy makers and enforcement officers should use the findings to affect behavior change that engineering or education cannot efficiently address. And lastly, Public Works staff can reference this report to determine methods for continued crash reporting and efficient evaluation of safety measures.
A traffic crash is an unfortunate and complex event. There are often multiple contributing factors, multiple parties involved and several layers of interpretation and reporting. In Kentucky, if a police officer is not immediately called to the scene, involved parties have up to ten days to notify authorities.3
Once a police officer collects the necessary information, he or she completes a Kentucky State Police accident report. Location, time, personal information, weather, roadway conditions, roadway surface, road character and other attributes are recorded using a standardized coding system. To supplement the codes, a crash narrative and diagram are also completed as part of the report.4
The Louisville Metro Public Works Department receives copies of accident reports from the Louisville Metro Police Department upon request. The reports are used to better understand the crash data and improve public outreach. Select information documented by Public Works and the crash reports are then destroyed.
This report examines data from reported traffic crashes. Crashes of all types go unreported, but it is estimated that bicycle and pedestrian crashes are overrepresented among unreported crashes. Reasons for not reporting a crash may be that no party was injured, property damage was marginal, and individuals fled the scene or were not aware that they are required to report a crash. Crashes are mandatory to report if there is injury or death as well as property damage of $500 or more occurs.
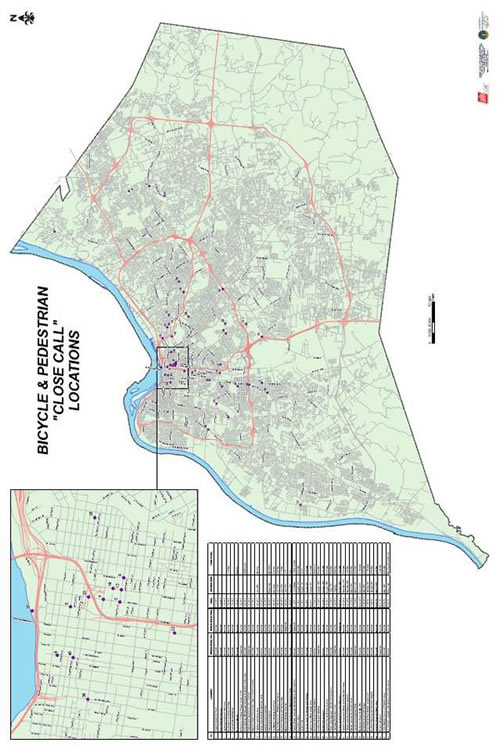
A possible method for determining the number of unreported crashes is to examine the Close Call Form. The close call form is another tool we use to assess potential conflict points and the frequency of near misses at these locations. The form asks: At the time of the incident were you a bicyclist, pedestrian or motorist? Did you have a close call with a bicyclist, pedestrian or motorist? Please let us know where you had your close call, intersection or specific address or landmark. Please let us know what time of day this incident occurred. The form concludes with a space for more detail on the close call. This form offers another way to address issues before they result in a crash.
On a crash report, an array of information is compiled by the police officer assigned to the case. A series of standardized codes are used to efficiently categorize crash attributes. While all codes help explain the cause(s) and circumstance(s) of a crash, the two codes of particular interest are contributing factor and pre-crash maneuver.
Pre-crash maneuvers describe the actions of each party just prior to the collision. Common pre-crash maneuvers are going straight ahead, making a left turn and making a right turn. While other crash attributes are useful in determining cause, it is primarily pre-crash maneuvers that allow for the determination of crash causes and crash typing.
While accident reports are the most reliable source of pedestrian-motorist crash information, only the information available from the Kentucky Collision Analysis for the Public database was used for these evaluations due to the number of pedestrian collisions. This website is developed and maintained by the Kentucky State Police to give the public the ability to analyze data related to collisions occurring in the state of Kentucky. This repository contains information gathered from collision reports submitted by Kentucky law enforcement agencies.
The integrity of the data is dependent upon both the accuracy and frequency with which the data is entered and user's interpretation.
All pedestrian crashes, including crashes on private property are included in these analyses.
A number of attributes are not collected on accident reports or analyzed as part of this research.
Pedestrian position prior to the crash – While some reports describe the pedestrian's position in detail, reporting is not consistent and the information is not recorded by the Louisville Metro Police Department.
No effort was made to determine if the collision was "preventable." A preventable collision is one in which the driver failed to do everything that they reasonably could have done to avoid it.
The terms "accident" and "crash" are used in this report, although not interchangeably. In the discussion of traffic safety, "crash" is becoming the accepted term when describing a collision. According to the National Highway Traffic Safety Administration, "Continued use of the word accident promotes the concept that these events are outside of human influence or control."5
To yield patterns of statistical and spatial significance, planning was done to determine an appropriate sample size of pedestrian crash records.
Motivation for a larger time period was selected to avoid the possibility of false readings. A San Francisco study on corridor level analysis of bicyclist and pedestrian crashes found that, "Basing decisions on individual intersections and single year is of limited efficacy and will yield substantial numbers of… false positives and false negatives."6 The same study recommends a three year period as it, "provides a good balance between changes in the intersections over time." Although, it is noted that five years is better for intersections with a relatively low number of crashes.
Public Works selected a sample period of 5 years because little was understood about local pedestrian safety and there was a desire to gain a broad understanding of crashes in Louisville.
As outlined in Chapter 2, Public Works evaluated select crash attributes from the Kentucky Collision Analysis for the Public database. The primary attributes available for each crash are:
The analysis of pedestrian-motorist crashes found that crashes are complex events and there is no one factor that is contributing to crashes. That said, four primary conclusions emerge from the data:
This chapter provides support for these conclusions and highlights other prevalent crash attributes.
Topics presented in the chapter are:
|
By Year Between 2006 and 2010, there was an average of 404.4 pedestrian-motorist crashes per year. The peak occurred during 2010 with 429 crashes and the low was in 2006 with 371 crashes. |
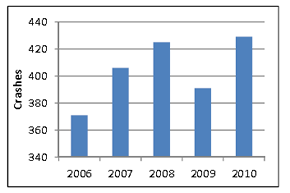 Figure 1 – Crashes by Year, 2006-2010 |
| By Month Crashes are decrease in the winter and summer months then increase in the spring and fall. The most common month was October with 201 crashes and the least common was July with 139 crashes. |
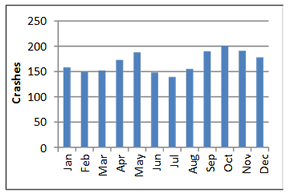 Figure 2 – Crashes by Month, 2006-2010 |
| By Day Crashes are more prevalent on weekdays than weekends. The most common day is Friday with 358 crashes and the least common day is Sunday with 212 crashes. The lowest weekday is Tuesday with 261 crashes. |
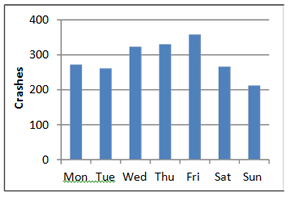 Figure 3 – Crashes by Day, 2006-2010 |
| By Time of Day Most crashes occur during the afternoon peak period between 3:00-6:00 p.m. Crashes increase throughout the day, peak in the late afternoon and drop off into the evening. The lowest period of the day is from 3:00-6:00 a.m. These patterns adhere closely to pedestrian traffic patterns and traffic patterns for all modes in Louisville. |
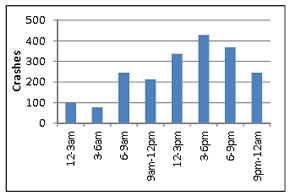 Figure 4 – Crashes by Time of Day, 2006-2010 |
|
Road Condition The road condition at the time of crashes was generally favorable. Conditions were dry 82.1 percent of the time and wet 16.3 percent of the time. Snow, slush and ice were present for 1.1 percent of the time. |
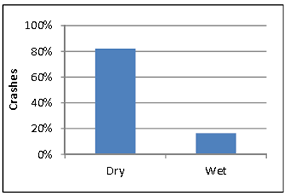 Figure 5 – Crashes by Road Condition, 2006-2010 |
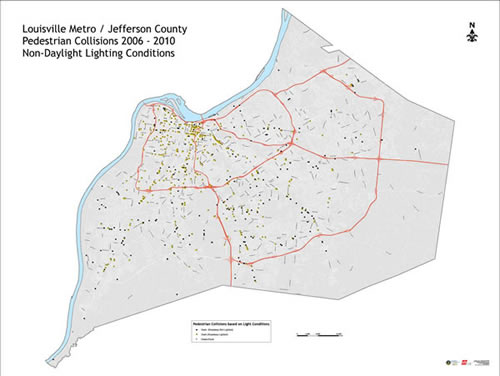
| Light Condition The light condition for crashes was generally favorable. Crashes occurred during daylight 59.9 percent of the time and dark-lighted roadway 22.8 percent of the time. Crashes occurred during dusk and dawn only 7.3 percent of the time. |
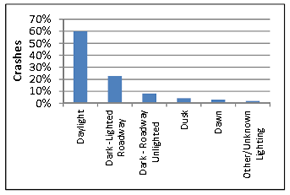 Figure 6 – Crashes by Light Condition, 2006-2010 |
PEDESTRIAN AGEPedestrian age 51-64 is the most prevalent cohort representing 16.1% of pedestrians. The least common age groups were under 16 years of age. |
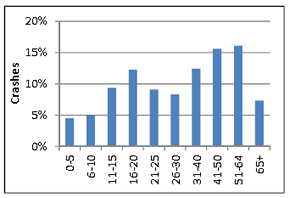 Figure 7 – Crashes by Pedestrian Age, 2006-2010 |
| PEDESTRIAN FACTORS The top pedestrian factors for all crashes were darting into road (18.0 percent), walking in roadway (17.0 percent), crossing with signal (13.2 percent), not at intersection (12.2 percent) and in crosswalk (12.0 percent). |
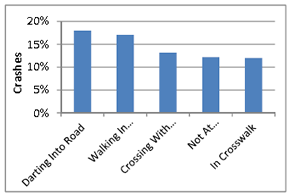 Figure 8 – Crashes by Pedestrian Condition, 2006-2010 |
|
Top Motorist Condition The top motorist factors for all crashes were inattention (22.1 percent), failed to yield right of way (8.8 percent), alcohol involvement (2.1 percent), distraction (1.9 percent), disregard traffic control (1.8 percent) and other (7.8 percent). No factor was provided 47.1 percent of the time. |
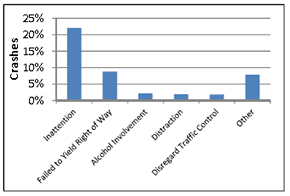 Figure 9 – Crashes by Motorist Condition, 2006-2010 |
| Top Motorist Condition – Intersection The top motorist factors for crashes in intersection were inattention (26.5 percent), failed to yield right of way (14.2 percent), disregard traffic control (2.8 percent), distraction (2 percent) and other (6.2 percent). No factor was provided 38.7 percent of the time. |
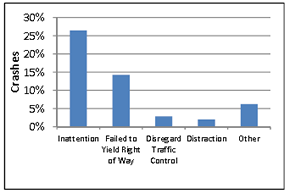 Figure 10 – Crashes by Motorist Condition in Intersection 2006-2010 |
| Top Motorist Condition – Non Intersection The top motorist factors for crashes not in intersection were inattention (17.8 percent), failed to yield right of way (3.5 percent), alcohol involvement (2.6 percent), distraction (1.8 percent), not under proper control (1.8 percent) and other (9.3 percent). No factor was detected 55.2 percent of the time. | 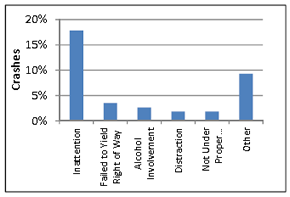 Figure 11 – Crashes by Motorist Condition not in Intersection 2006-2010 |
|
Top Motorists Pre-Crash Maneuvers The top motorist pre-crash maneuvers were going straight ahead (54.2 percent), making left turn (19.9 percent), making right turn (8 percent), backing (3.9 percent), starting in traffic (1.9 percent) and unknown (2.9 percent). |
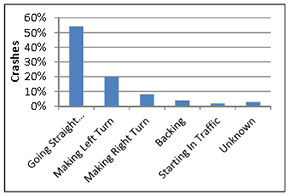 Figure 12 – Crashes by Motorist Pre-Crash Maneuvers 2006-2010 |
| Top Motorists Pre-Crash Maneuvers – Intersection The top motorist pre-crash maneuvers in an intersection were going straight ahead (39.3 percent), making left turn (32.5 percent), making right turn (13.6 percent), starting in traffic (2.5 percent) and unknown (3.2 percent). |
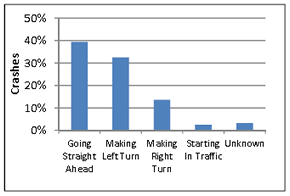 Figure 13 – Crashes by Motorist Pre-Crash Maneuvers in Intersection, 2006-2010 |
| Top Motorists Pre-Crash Maneuvers – Non Intersection The top motorist pre-crash maneuvers not in an intersection were going straight ahead (67.7 percent), making left turn (8.5 percent), backing (6 percent), making right turn (3 percent) and unknown (2.6 percent). | 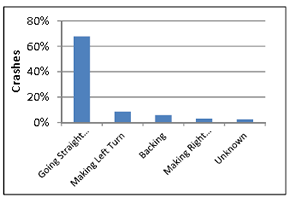 Figure 14 – Crashes by Motorist Pre-Crash Maneuvers not in Intersection, 2006-2010 |
ROADWAY TYPEMost crashes occurred on local streets with 793 crashes, or 40 percent of the time. The fewest crashes occurred on interstates with 35 crashes, or 1.8 percent of the time. |
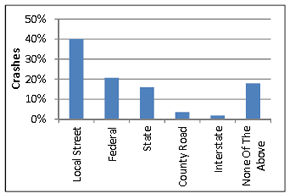 Figure 15 – Crashes by Roadway Type, 2006-2010 |
|
Crash Severity Detailed analysis of crash reports from 2006-2010 found that 89.8 percent of pedestrian crashes result in some level of injury. 37.1 percent of crashes resulted in possible injuries, 31.7 percent evident injuries, 16.2 percent disabling injuries and 0.7 percent of crashes were unknown injuries. |
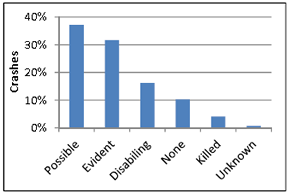 Figure 16 – Crashes by Injury Severity, 2006-2010 |
| By Year There were 82 fatalities from 2006-2010, or an average of 16.4 fatalities per year. The most fatalities occurred in 2008 with 23. The fewest fatalities occurred in 2009 with 8. | 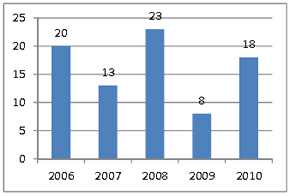 Figure 17 – Fatalities by Year, 2006-2010 |
| Top Pedestrian Factors – Fatalities The top pedestrian factor for crashes resulting in fatalities was dark clothing/not visible (43.9 percent). Other top factors include not at intersection (35.4 percent), walking in roadway (20.7 percent), darting into road (18.3 percent), and drinking (17.1 percent). |
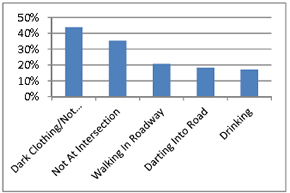 Figure 18 – Fatalities by Pedestrian Factor, 2006-2010 |
| Roadway Type – Fatalities The majority of crashes resulting in fatalities occur on state roads (34.1 percent). The least amount of fatal crashes occurs on county roads (2.4 percent). |
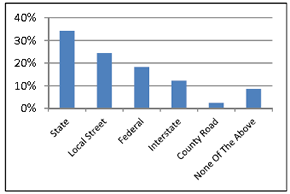 Figure 19 – Fatalities by Roadway Type, 2006-2010 |
Following are the top five leading causes of death per 100,000 population of youth ages 5 to 25 years of age in Jefferson County for 2009:
| • | Unintentional injuries | 53.2 |
| • | Assault (Homicide) | 25.8 |
| • | Motor vehicle crash | 21.2 |
| • | Suicide | 14.6 |
| • | Cancer | 7.7 |
Unintentional injuries were the leading cause of death in 2009 of children nationwide and in Metro Louisville. Though traffic deaths among the young are a small portion of the total, these crashes are a leading cause of death among people ages 5 to 24. Only unintentional injuries and homicide kill more people in this age group in Louisville Metro.
There are added social costs to fatalities in this age group as they are in their prime productive years and are likely to have dependent family members(7).

Street and neighborhood design focused on pedestrian safety encourage children and families to incorporate walking into daily living. Research indicates that people who live in areas with high quality sidewalks are more likely to be active and less likely to be overweight.8
Since crashes often strike people in their prime productive years, are usually accompanied by property damage and cause extensive injury as well as death, the economic impacts of crashes are substantial.
The United States Department of Transportation (USDOT) estimates the national impact of crashes at $230.6 billion, representing 2.3% of GDP in 2003. To put this in perspective, Medicare annual costs in 2008 were just above 3% of GDP.
USDOT also broke down the total costs for motor vehicle crashes by state. According to the National Transportation Research Group, motor vehicle crashes cost Kentucky $3.1 billion per year, $771 for each resident, in medical costs, lost productivity, travel delays, workplace costs, insurance costs and legal costs. State cost per capita varied due to differing state income levels and state medical, insurance and legal costs. Based on these state costs the annual cost of all traffic crashes in Louisville Metro are estimated at $460 million dollars annually.
Traffic fatalities and injuries do not impact all people equally. Certain demographic groups are threatened more by road safety problems than others, requiring solutions tailored to reach and protect specific populations. Seniors comprise 12% of the population whereas they make up over 17% of all traffic fatalities while 25-34 year olds make up 14% of the population, but 18% of the total traffic fatalities.9
Moreover, national studies have shown that populations with low socioeconomic status (lowest income level, low educational attainment, blue-collar occupation) and unemployed status are at a higher risk for traffic fatalities. Gender is also an indicator of risk. During 2009 in Louisville men died in crashes at more than twice the rate of women.
Access to care is also part of the equation: A study from Wisconsin found that the medically uninsured receive 20% less care when hospitalized after a serious crash. This disparity appears to lead to higher mortality rates, as the uninsured experienced a crash mortality rate 39% higher than the average.
Louisville's Center for Health Equity has a commitment to address issues of race and social justice, and the design and implementation of pedestrian projects are no exception. The Pedestrian Master Plan will provide for the needs of all of Louisville's neighborhoods, with the goal of improving the walking environment for Louisville's diverse populations.
Sustainable transport is about finding ways to move people, goods and information in ways that limit the impact on the environment, economy and society. Choosing to walk or bicycle rather than travel by automobile may help individuals get exercise, save money, interact with neighbors, and reduce tailpipe emissions. Yet, non-motorized transportation modes may require more time and physical effort, be less convenient for carrying packages and traveling in bad weather, and be perceived as having a higher risk of traffic crashes or street crime than driving. Safety risks, both real and perceived, are two factors that limit pedestrian trips, especially for children and seniors. Many of these trips are handled instead by less sustainable modes.

Street safety (and perceived safety) is a major quality of life concern, especially for families with children. Guaranteeing street safety, like reducing crime, is a key factor in attracting and retaining a middle class population. Unsurprisingly, traffic calming improvements that reduce speed and volume have been strongly linked to increased home values, a key factor in family location decisions.
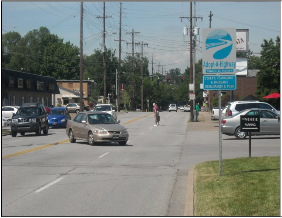
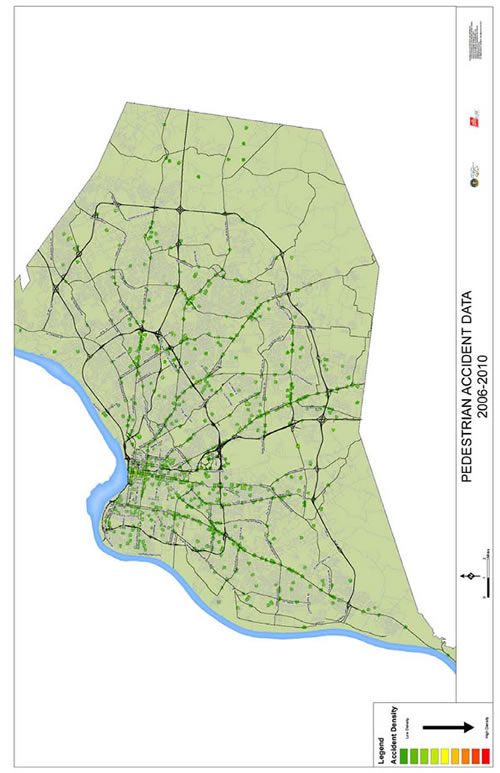
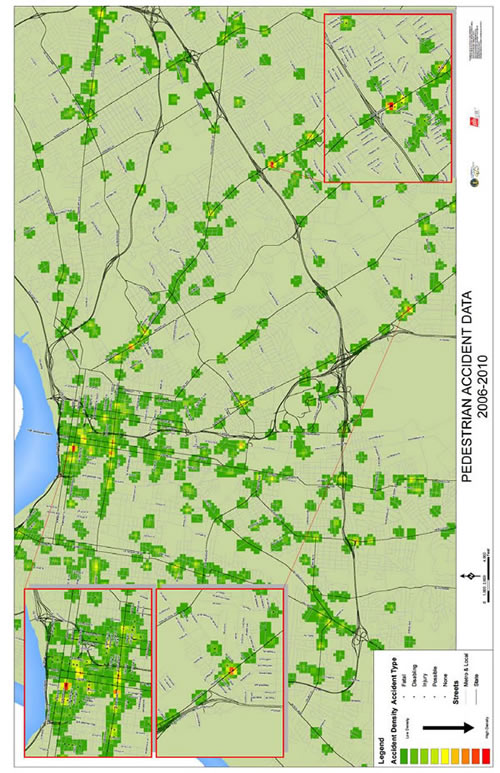
Pedestrian-motorist crashes are occurring in all parts of Louisville Metro, although crashes are most prevalent in the Central Business District (CBD). There is also a clear connection along principal arterials such as Bardstown Road, Baxter Avenue, Dixie Highway, Hikes Lane, New Cut Road, and Preston Highway.
To simplify the discussion and illustration of the results, crash locations are weighted by severity (fatal, disabled, injured, possible and none).
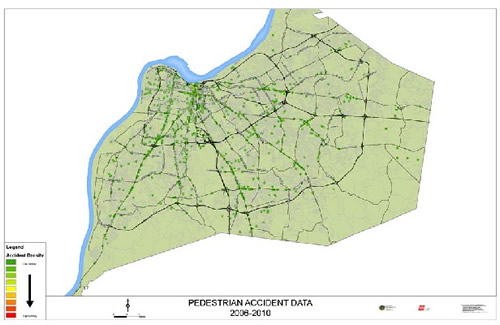
Figure 20: Pedestrian Collisions Ranked by Severity map, 2006-2012
To summarize the data presented in the previous chapter,
Reducing these findings further, four primary conclusions emerge:
These four conclusions help simplify the complex nature of crashes. However, translating the findings into effective countermeasures is the next task. While posed with good intentions, the discussion of countermeasures can quickly become detailed and itemized: Which intersections should be improved first? How should pedestrians be educated? How should motorists be educated? How can the police be involved?
Before moving forward, a framework for implementation should be established and a clear understanding of who the countermeasures are intend for is needed. Safety is an evolving goal and it may be better to front load the discussion with high-level considerations, rather than specific countermeasures. Taking the same approach as Safe Routes to School, this section applies The Vie E's of Safe Routes to School to improve pedestrian safety.
Five E's" of Safe Routes to School to ensure that projects are well-rounded, multi-prong and time-tested approaches to getting more students walking and bicycling. The Five E's of Safe Routes to School include:
Known as the Five E's of Five E's" of Safe Routes to School10, this straightforward approach is becoming the norm in cities across the U.S. and was used as a framework for the Louisville Pedestrian Master Plan, 2010-2020. While originally intended as a checklist for increasing walking, it can easily be applied to decreasing crashes. Developing a set of countermeasures to increase pedestrian safety should use the Five E's approach.

Recommendations for Improved Pedestrian Safety
This analysis confirms that many of the improvement made are effective and should continue. The findings also highlight the need for new focus areas, including continued use of best practices in engineering. The recommendations for improved pedestrian safety are the following:
Education |
|
|
 Safe Routes to School program increases awareness and improves navigation for young students. |
|
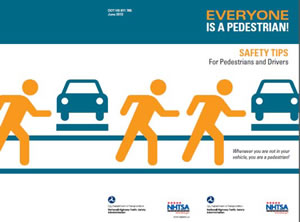 Whenever you are not in your vehicle, you are a pedestrian! This brochure offers tips for both drivers and pedestrians to stay safe while sharing the road. |
|
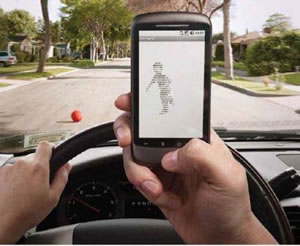
Cell phones make it easy for drivers to multitask. In 2009, 20 percent of injury crashes involved distracted driving, and of "those killed in distracted-driving-related crashed," 995 involved cell phone distraction, according to the National Highway Traffic Safety Administration. |
Enforcement |
|
|
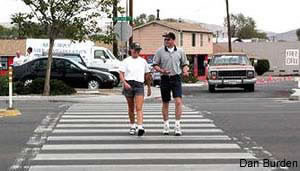 Police officers in highly visible civilian clothes pose as pedestrians crossing the street. |
Engineering |
|
|
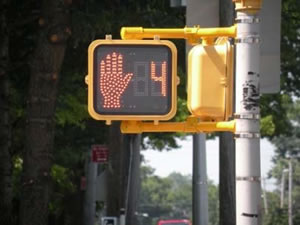 LPI, also known as a "pedestrian head start," provides increased visibility and safety for pedestrians when drivers are turning, especially at right turns. 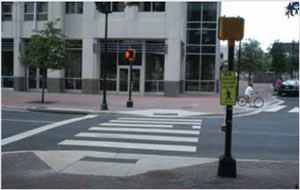 Improving facilities, such as the one above, will improve safety by increasing crosswalk visibility. |
Evaluation |
|
|
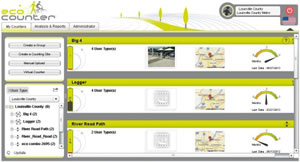 Analyzing pedestrian automated counts will allow Public Works to target necessary facility improvements and justify future pedestrian projects. |
"Accident Guide in Kentucky." DMV.org. Web. 11 June 2013. http://dmv.org/ky-kentucky/accident-guide/.
Amsden, Michael and Thomas Huber. Bicycle Crash Analysis for Wisconsin Using a Crash Typing Tool (PBCAT) and Geographic Information System (GIS). Wisconsin Department of Transportation. June 30, 2006.
"Civilian Traffic Collision Report." Kentucky State Police. Commonwealth of Kentucky, Web. 11 June 2013. http://www.kentuckystatepolice.org/pdf/CivCorRpt.pdf.
"Collision Data Wizard." Collision Data Wizard. Web. 27 June 2013. http://crashinformationky.org/KCAP/KYOS/SearchWizard.aspx. Safe Routes to School. http://www.saferoutespartnership.org/local/getting-started-locally/5es.
Ragland, David, et. al. Strategies for Reading Pedestrian and Bicyclist Injury at the Corridor Level. UC Berkeley Safe Transportation Research and Education Center. July 2011.
| Targeted Crash Condition | |
|---|---|
| Alcohol/Drugs | Education:
|
Encouragement:
|
|
Enforcement:
|
|
| Inattention | Education:
|
Encouragement:
|
|
Enforcement:
|
|
| Failure to Yield Right-of-Way | Education:
|
Encouragement:
|
|
Enforcement:
|
|
| Pedestrian age 51-64 is the most prevalent cohort age for crashes | Education:
|
Encouragement:
|
|
Enforcement:
|
|
Engineering:
|
|
| Dark Clothing/Not Visible | Education:
|
Encouragement:
|
|
| Not at Intersection; Darting Into Road | Education:
|
Encouragement:
|
|
Enforcement:
|
|
Engineering:
|
|
| Walking in Roadway | Education:
|
Encouragement:
|
|
Engineering:
|
|
| All Crashes/Programs | Evaluation:
|
NOTES:
– 60% of fatalities occur on federal/state roads
– Meet with LMPD to discuss reports
The close call form is another tool we use to assess potential conflict points and the frequency of near misses at these locations. As you may know, bicycle and pedestrian related crashes are under reported and this offers another way to address issues before they result in a crash.
The form allows you to fill out your personal information and detailed questions about your close call. At the time of the incident were you a bicyclist, pedestrian or motorist? Did you have a close call with a bicyclist, pedestrian or motorist? Where did you have your close call, intersection or specific address or landmark? What date did this incident occur? What time of day did this incident occur? Finally, the form asks for a description of the close call.
The map below entitled Bicycle and Pedestrian "Close Call" Locations provides the exact locations of each reported close call. The table in the left hand corner provides the location, where were you, where were they, date, incident date and time of day. Pedestrian reported close calls were at ID locations 6,8,25, 29, 34 and 40.
Key Findings from close call reports include
Select close call descriptions
Entrance to Humana Fitness Center on 5th
I was leaving my Yoga class at approx. 6:20 yesterday evening and when I exited the door of Humana's Fitness Center and turned the corner to head south on fifth, I was moved over by a cyclist who was on the sidewalk. I was knocked completely down with all my weight, purse and gym bag landing directly on my right hip. Very sore today! The cyclist took the blame in that he admitted he was not paying attention; however he made excuses when I pointed out to him that cyclists are not allowed under ordinance to be on the sidewalk. This is very frustrating to me.
Hurstbourne and Tamarisk
Light at intersection does not seem to be timed with other lights along Hurstbourne and cross walk light does not seem to work correctly either, so cars on Tamarisk who get tired of waiting for green sometimes run the red light. I was nearly hit by car running the red turning from Tamarisk southbound onto Hurstbourne.
Frankfort Avenue
Frankfort Ave. is notorious for bicycles on the sidewalks and nobody does anything about it. This venue to me is worthless as the police don't do anything regardless how many times someone complains. I don't believe the police do anything but carry the little yellow "WARNING" tags.
Cherokee Park Scenic Loop
This is an ongoing issue in the park: Cyclists of all kinds either straddle the pedestrian/vehicle line or often they use the pedestrian lane to navigate the loop. Many pedestrians utilize the loop and the cyclists don't indicate they are coming up behind us, making us vulnerable to getting hit if we were to veer unexpectedly to the right or the left. It would be much less stressful for pedestrians if riders were to use the appropriate lane to navigate through the park, since they are technically a vehicle. Several of us in our running group express fear that we will one day get hit because they come up behind us quickly.
Trevilian and Ridgefield Road
I was crossing Trevilian with my child at the intersection with Ridgefield Rd. and a motorist rounded the hill headed towards Poplar Level at a relatively high speed. No obvious attempt was made by the motorist to slow down before I was able to clear the intersection.
2nd near College of Business and Freedom Park
Neither of the 2 crosswalk buttons on the EAST side of 2nd (College of Business and Freedom Park crosswalk) are functioning properly. The west side buttons do seem to work. Students rarely wait or even hit the buttons at all, but the traffic signal is not responding when they do. The signal seems to immediately respond to the west side buttons.
5th and Jefferson
[Restaurant name] delivery people have no respect for anyone on sidewalks or crosswalks and should be accountable for their reckless riding this is an ongoing problem that will result in someone being injured.
Chestnut and Jackson by U of L Hospital
A colleague and I were crossing West on Jackson at the corner of Chestnut and a motorist turning left onto Jackson almost hit us. She was asking someone for directions and we stopped in the middle of the road. We had the ped signal and luckily we were paying attention.
1 http://2010.census.gov/2010census/popmap/
2 "Did You Know??" FARS Encyclopedia. Web. 18 July 2013. <http://www-fars.nhtsa.dot.gov/>.
3 "Accident Guide in Kentucky." DMV.org. Web. 11 June 2013.
4 "Civilian Traffic Collision Report." Kentucky State Police. Commonwealth of Kentucky, n. d. Web. 11 June 2013.
5 Amsden, Michael and Thomas Huber. Bicycle Crash Analysis for Wisconsin using a Crash Typing Tool (PBCAT) and Geographic Information System (GIS). Wisconsin Department of Transportation. June 30, 2006
6 Ragland, David, et. al. Strategies for Reducing Pedestrian and Bicyclist Injury at the Corridor Level. UC Berkeley Safe Transportation Research & Education Center. July 2011.
7 "Did You Know??" FARS Encyclopedia. Web. 18 July 2013. <http://www-fars.nhtsa.dot.gov/>.
8 Active Living Research. 2009. Active Transportation: Making the Link from Transportation to Physical Activity and Obesity, Research Brief. San Diego: San Diego State University
9 "Census Bureau Homepage." Census Bureau Homepage. Web. 18 July 2013. http://www.census.gov/.
10 Safe Routes to School http://www.saferoutespartnership.org/local/getting-started-locally/5es

