U.S. Department of Transportation
Federal Highway Administration
1200 New Jersey Avenue, SE
Washington, DC 20590
202-366-4000
![]()
U.S. Department of Transportation
Federal Highway Administration
View the PDF Version [515 KB]
In this issue:
Florida and New York City have Success with Leading Pedestrian Intervals
NEW! Pedestrian and Bicyclist Safety Information Search Tool
Revised! How to Develop a Pedestrian and Bicycle Safety Action Plan
Resources Now Available from FHWA
The Federal Highway Administration (FHWA) Safety Office has been promoting the use of specific countermeasures that are proven to increase safety for almost a decade, and recently revised the list. This list of Proven Safety Countermeasures (PSC) has now reached a total of 20 treatments and strategies that practitioners can implement to successfully address roadway departure, intersection, and pedestrian and bicycle crashes. Among the 20 PSC are several crosscutting strategies that address multiple safety focus areas.
The "Proven Safety Countermeasures" initiative began in 2008, when FHWA issued a "Guidance Memorandum on the Consideration and Implementation of Proven Safety Countermeasures," which highlights when and where FHWA believes certain safety countermeasures should be used. Many of the countermeasures promoted in 2008 have been widely applied, and this is the second time FHWA has updated its previous guidance.
To address pedestrian safety, FHWA is promoting the following countermeasures:
| Medians and Pedestrian Crossing Island in Urban and Suburban Areas |
|
Pedestrian Hybrid Beacon |
|
Road Diet |
|
Walkways |
|
| Leading Pedestrian Intervals |
As an overview, more than 15% of highway fatalities involve pedestrians and 2% involve bicyclists. Pedestrian fatalities have been increasing since 2009 and bicyclist fatalities have been trending up as well.
Midblock crossings account for over 70% of these fatalities, so four of the five pedestrian countermeasures being promoted are geared towards reducing the frequency and severity of pedestrian midblock crossings.
The Leading Pedestrian Interval is a countermeasure just added to the list, even though it has been around for a while. LPI is the first pedestrian safety PSC to focus on intersection safety.
LPI is an inexpensive countermeasure that allows the pedestrian a 3 to 7 second head start before the signal turns green for vehicle traffic. It helps pedestrians to establish themselves in the crosswalk before vehicles have priority to turn left. LPIs are particularly helpful for older or disabled pedestrians who may be slower to start into the intersection than other pedestrians, thus giving them better visibility to turning drivers.
Costs associated with LPI implementation are simply those required to alter signal timings, making LPIs an extremely inexpensive countermeasure that can be incorporated into pedestrian safety action plans or policies and can become routine agency practice. See page 2 of this newsletter for examples of how two transportation agencies are using LPI and found them to be effective.
As mentioned on page 1 of this newsletter, the FHWA is now promoting the use of LPI as an inexpensive pedestrian safety counter measure. Below are highlights from two FHWA focus locations that have had good results from the use of LPIs.
Contributed by Rob Viola
New York City Department of Transportation (NYDOT) studied the before/after effects of LPIs in its Left Turn Pedestrian and Bicycle Crash Study. NYCDOT developed the Left Turn Study to advance New York City's Vision Zero initiative to eliminate traffic deaths and serious injuries. Between 2010 and 2014, 108 pedestrians and bicyclists were killed by left turning vehicles (out of 859 pedestrian and bicyclist fatalities 2010-2014) in New York City. In 2016, New York City Mayor Bill de Blasio made it his priority to reduce these failure to yield crashes, noting that left turns account for more than twice as many pedestrian and bicyclist fatalities as right turns and over three times as many serious injuries and fatalities.
The effects of this treatment were very dramatic– where LPIs were installed there was a 37% drop in overall pedestrians and bicyclists killed or severely injured (KSI). You can read more about the study here. The graphic below illustrates the results achieved.
For more information contact Rob Viola.
Contributed by Trenda McPherson
The state of Florida conducted an integrated study to determine the suitability and effectiveness of LPI implementation at signalized intersections to improve pedestrian safety. In addition, the state is in the process of developing statewide guidelines for LPI implementation.
A comprehensive literature review was conducted regarding successes and lessons learned from LPI implementation. As part of the process, traffic engineers and Florida Department of Transportation district representatives provided input through surveys, interviews, and teleconferences. In addition, pilot data was collected and analyzed before and after LPI implementation at nine geographically diverse intersections to provide measures of effectiveness to evaluate and further refine the preliminary LPI implementation guidelines.
The Florida study of LPI yielded some positive results, including reducing the percentage of vehicle-pedestrian conflicts between 25% to 100% for different intersections. The project will be complete in January 2018, with the study results and the statewide guidelines for LPI available at that time.
Contact Trenda McPherson or Alan El-Urfali for more information.
Purpose: Give pedestrians and bicyclists a conflict-free head start in the crosswalk
Evaluation:
| Left | Right | Through | Other* | Total | ||
|---|---|---|---|---|---|---|
| Pedestrian and Bicyclist Injuries | Before (3 Years) | 282 | 113 | 304 | 137 | 839 |
| After (3 Years) | 243 | 102 | 265 | 145 | 749 | |
| Change | -14% | -10% | -13% | 6% | -11% | |
| Pedestrian and Bicyclist KSI |
Before (3 Years) | 41 | 19 | 40 | 16 | 115 |
| After (3 Years) | 18 | 5 | 40 | 15 | 73 | |
| Change | -56% | -74% | 0% | -6% | -37% | |
*"Other" includes "U-Turn" and "Unknown"
Source: NYSDOT (2000-2014)
New Safety Tool: NYCROSSWALK provides information on pedestrian collisions on a heat map of Manhattan, Brooklyn, Queens, The Bronx, and Staten Island. The resource allows New York City pedestrians access to data that shows them how, when and where pedestrian crashes are most likely to happen so they can be more informed about the relative safety of their walking route choices. |
The FHWA's Safety Office just launched the Pedestrian and Bicyclist Safety Information Search Tool, a page-by-page assessment of more than 100 carefully selected reports, guidebooks, and training materials, cross-referenced by mode, the "Es" (Engineering, Education, Enforcement, Evaluation, etc.), topics addressed, and other categories. Reports and guidance documents abound for anyone engaged in planning, designing, or advocating for safe pedestrian and bicycle facilities. The information packed into these resources is valuable, but practitioners must track it down from a wide variety of websites, clearinghouses, and printed documents. Not all documents are readily or freely available, and readers must sometimes assess on their own the quality of what they find.
Anyone with a web connection can search the library by typing keywords, picking from drop-down lists, or using other search filters available on the site. Whether you are a community member looking for ways to make your neighborhood safer for kids on bicycles, a researcher studying the application of safety countermeasures, a planner writing a local policy on multimodal safety, or an engineer designing a cycle track, this library can help you find the resources you need.
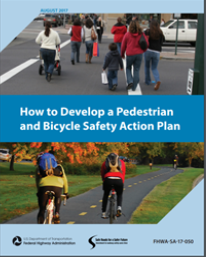
The FHWA Safety Office worked to update and re-issue the revised guide entitled, How to Develop a Pedestrian and Bicycle Safety Action Plan, which helps State and local officials decide where to begin to address pedestrian and bicycle safety issues. The guide, issued fall of 2017, is designed to help agencies enhance their existing safety programs and activities, including identifying safety problems and selecting optimal solutions.
The guide also serves as a reference for improving pedestrian and bicyclist safety through a multidisciplinary and collaborative approach to safety, including enhanced street designs and countermeasures, policies, and behavioral programs. Engineers, planners, traffic safety, and enforcement professionals; public health and injury prevention professionals; and decision makers who have the responsibility for improving pedestrian and bicycle safety at the State or local level can use this guide.
Simple objectives for what a Pedestrian and Bicycle Safety Action Plan should accomplish include:
The guide also offers options for funding strategies and a variety of other resources for planning and implementing identified countermeasures, projects, and activities. For more information, contact Tamara Redmon.

Tamara Redmon, Pedestrian Safety Program
Manager
Federal Highway Administration
1200 New Jersey Avenue SE
Room E71-303
Washington, DC 20590
Phone: 202-366-4077
Fax: 202-366-3222
E-mail: tamara.redmon@dot.gov
This Pedestrian and Bike Forum is available
on the Web at http://safety.fhwa.dot.gov/ped_bike/pedforum/
To receive information on future newsletters,
please use the esubscription service provided
on this site: http://safety.fhwa.dot.gov/esubscribe.cfm. Scroll down to "Pedestrian and Bicycle Safety" and select "subscribe" next to "Pedestrian Forum."
Helping Communities to provide safe and convenient transportation choices to all citizens, whether it's by walking, bicycling, transit, or driving is a high priority of the U.S. Department of Transportation. Each year, unfortunately, pedestrian and bicyclist fatalities comprise about 17 percent of all traffic fatalities and there are approximately 6,000 pedestrian and bicyclist deaths. Another 115,000 pedestrians and bicyclists are injured in roadway crashes annually. Pedestrian and bicyclist safety improvements depend on an integrated approach that involves the four E's: Engineering, Enforcement, Education, and Emergency Services. The Pedestrian and Bicyclist Forum highlights recent pedestrian and bike safety activities related to the four E's that will help save lives.
FHWA hosted a webinar on Design Innovation and the MUTCD Experimentation Process on September 13 that was recorded and is available for viewing here. When designing intersections for bicyclists and pedestrians, communities can take advantage of a growing toolbox of treatments that promote the safety and comfort of non-motorized road users. During this webinar, panelists shared information about how new and innovative traffic control devices can be tested and evaluated, even if they aren't currently included in the Manual of Uniform Traffic Control Devices (MUTCD).
Bill DeSantis, of VHB, shared an overview of the MUTCD experimentation process, highlighting the importance of testing new countermeasures and providing details for communities interested in experimenting with new and innovative designs. Dave Kirschner (FHWA) discussed how agencies can navigate the range of allowable designs and treatments in the MUTCD, from adopted traffic control devices to those with interim approval. He highlighted the experience of testing the two-stage turn box for bicyclists, which was recently granted interim approval.
In the Spring 2017 edition of this newsletter, FHWA announced the availability of the guide, Noteworthy Local Policies that Support Safe and Complete Pedestrian and Bicycle Networks on the web. The document has now been printed and up to 3 copies of the guide can be ordered here.
FHWA developed this guide to provide local and state agencies with tools to complement new infrastructure and program development. The guide is accompanied by case studies from across the country that support safe and complete street networks. The guide also provides information on evaluating a policy framework's strengths, weaknesses, opportunities, and threats to help develop implementation steps for advancing these policies

