U.S. Department of Transportation
Federal Highway Administration
1200 New Jersey Avenue, SE
Washington, DC 20590
202-366-4000
![]()
![]()
The Federal Highway Administration's (FHWA) Highway Safety Improvement Program (HSIP) is a data driven program that relies on crash, roadway, and traffic data for States to conduct effective analyses for problem identification and evaluation. The FHWA developed the Model Inventory of Roadway Elements (MIRE) to provide a recommended listing and data dictionary of roadway and traffic data elements critical to supporting highway safety management programs. MIRE is intended to help support the States' HSIPs and other safety programs.
The MIRE Management Information System (MIRE MIS) was a project to explore better means of collection MIRE data elements, using and integrating MIRE data, and identifying optimal data file structures. The resulting products include a report documenting the MIRE MIS Lead Agency Program, a MIRE Guidebook on the collection of MIRE, a suggested MIRE data file structure report, and a report on Performance Measures to Assess Quality that will assist the States in conducting a more effective safety program. The intent of the MIRE MIS project is the integration of MIRE into States' safety management processes.
The Development of a Structure for a MIRE MIS Report is one of the products of the MIRE-MIS effort. The report identifies issues State's should be cognizant of when collecting, correcting, and maintaining information for a safety management system. The report presents a conceptual model that identifies the business functions a state is likely to need from a safety management system. This document will provide data managers with information and issues they should address in establishing or improving an integrated safety data file structure to enhance the safety performance of the state's roadways.
 |
 |
| Michael S. Griffith
Director, Office of Safety Technologies |
Monique R. Evans Director, Office of Safety Research and Development |
This document is disseminated under the sponsorship of the U.S. Department of Transportation in the interest of information exchange. The U.S. Government assumes no liability for the use of the information contained in this document. The U.S. Government does not endorse products or manufacturers. Trademarks or manufacturers' names appear in this report only because they are considered essential to the objective of the document.
The Federal Highway Administration (FHWA) provides high-quality information to serve Government, industry, and the public in a manner that promotes public understanding. Standards and policies are used to ensure and maximize the quality, objectivity, utility, and integrity of its information. FHWA periodically reviews quality issues and adjusts its programs and processes to ensure continuous quality improvement.
| 1. Report No. FHWA-SA-13-007 |
2. Government Accession
No. |
3. Recipient's Catalog No. | |||
| 4. Title and Subtitle
Development of a Structure for a MIRE Management Information System |
5. Report Date
January 2013 |
||||
| 6. Performing Organization Code | |||||
| 7. Author(s)
Michael Altobello, Michael Thurber, Nancy Lefler, Hugh McGee, and Barbara Hilger DeLucia |
8. Performing Organization Report No. | ||||
9. Performing Organization Name and Address
|
10. Work Unit No. |
||||
| 11. Contract or Grant No. DTFH61-05- D-00024 (VHB) | |||||
| 12. Sponsoring Agency Name and Address
Federal Highway Administration Office of Safety 1200 New Jersey Ave., SE Washington, DC 20590 |
13. Type of Report and Period
Final Report – January 2013 |
||||
| 14. Sponsoring Agency Code FHWA |
|||||
| 15. Supplementary Notes
The contract managers for this report were Robert Pollack (HSA) and Dr. Carol Tan (HRDS-20). |
|||||
16. Abstract
|
|||||
| 17. Key Words:
MIRE, safety data, roadway inventory data, traffic data, data collection, crash data, management information system |
18. Distribution Statement
No restrictions. |
||||
| 19. Security Classif. (of this report) Unclassified | 20. Security Classif. (of this page) Unclassified | 21. No. of Pages 51 |
22. Price | ||
Form DOT F 1700.7 (8-72) Reproduction of completed pages authorized
SI (Modern Metric) Conversion Factors
Figure 1. Role of Improved Data Collection Efforts in Safety Outcomes
Figure 2. MIRE MIS Data Flow Diagram.
Figure 3. Model MIRE MIS Entity Relationship Diagram
| DBMS | Database management system |
| DFD | Data flow diagram |
| DOT | Department of Transportation |
| ERD | Entity relationship diagram |
| FHWA | Federal Highway Administration |
| FIPS | Federal Information Processing System |
| FK | Foreign key |
| GIS | Geographic information system |
| GUI | Graphical User Interface |
| HPMS | Highway Performance Monitoring System |
| HSIP | Highway Safety Improvement Program |
| HSIS | Highway Safety Information System |
| HSM | Highway Safety Manual |
| IHSDM | Interactive Highway Safety Design Manual |
| IT | Information technology |
| LIDAR | Light detection and ranging |
| MIRE | Model Inventory of Roadway Elements |
| MIS | Management Information System |
| NCHRP | National Cooperative Highway Research Program |
| NHDOT | New Hampshire Department of Transportation |
| NHTSA | National Highway Traffic Safety Administration |
| Portable document format | |
| PK | Primary key |
| RDBMS | Relational database management system |
| SQL | Structured Query Language |
Safety data are the key to making sound decisions on the design and operation of roadways. The need for improved and more robust safety data is increasing due to the development of a new generation of safety data analysis tools and methods. The ability to link roadway and traffic data with other safety data sources allows States to better identify where the problems are, what those problems are, how best to treat them, and how to evaluate the treatments. The Federal Highway Administration (FHWA) developed the Model Inventory of Roadway Elements (MIRE) as a listing and data dictionary of the roadway and traffic data elements critical to safety management (1). A critical step toward acceptance and implementation of MIRE is the conversion of MIRE, which is now a listing of variables, into a management information system (MIS). FHWA has undertaken the MIRE MIS project to assist States in developing and integrating the MIRE into an MIS structure that will provide greater utility in collecting, maintaining, and using MIRE data. The MIS project includes the exploration, development, and documentation of the following objectives:
The purpose of this report is to address the last three objectives. The first two objectives are covered in other reports under the MIRE MIS effort. This report provides a detailed overview of the MIRE MIS effort which involved developing a conceptual structure of a MIRE MIS, developing a prototype based on the conceptual structure, testing the prototype using data from one of the Lead Agency Program States, and identifying the lessons learned and implications for further development and implementation.
The key lessons learned from this effort are that in order for the MIRE MIS to be most functional, the data in the system needs to be of a high quality (better data = better analysis). In addition, while developing the MIRE MIS prototype, two issues became clear. One was that the structure of the State's data did not match the MIRE structure (i.e., the specific attributes), so data needed to be transformed to the MIRE structure on import. A second issue was that the structure and referencing system of the data collected by the States changed from year to year. One of the keys to the success of an MIS is the ability to correlate data from disparate systems to the relevant roadway elements. A full MIRE MIS implementation will contain data collected over time and will need a way to compare data from different collection periods. This way the system can provide analysis of conditions before and after improvements are made, and allow comparative analysis of data quality. This underscores the importance of a consistent data structure and referencing system that can be used in the collection of safety data.
The MIRE MIS conceptual design includes several aspects of the system that could tie into a geographic information system (GIS) to aid in data entry, querying, and spatial analysis. A GIS can also be used to address some of the key concerns of data structure and spatial references changing over time. A GIS can apply an absolute spatial reference and provide spatial analysis tools as an alternate way to match data points from different systems, whether these represent the same data collected at different times (e.g., roadway segments from different years), or they represent different data with independent referencing systems (e.g., crash data and bridge data). Adding a GIS component does introduce platform dependencies that may differ from State to State; however, regardless of the platform, tying the data into a GIS is an important part of the MIRE MIS.
The results of this effort show that the MIRE MIS concept offers many potential benefits to agencies' safety programs. The MIS brings together data from many sources. Each of these sources pertain to safety issues and can provide valuable information in determining where safety can be improved and what measures may be most effective.
Integrating quality roadway and traffic data with crash data helps agencies make better decisions and more effective use of limited funds to improve safety. The overall MIRE MIS effort provides lessons on how to collect, integrate, manage, and measure data for improved safety decision-making. This effort to develop and test an MIS helps bring State and local agencies one step closer to realizing the benefits of establishing an MIS to support their own safety programs.
The need for improved and more robust safety data is increasing due to the development of a new generation of safety analysis tools and methods. These include the 2010 Highway Safety Manual (HSM) (2) the Interactive Highway Safety Design Model (IHSDM) (3), SafetyAnalyst (4), as well as the National Cooperative Highway Research Program (NCHRP) Series 500 Data and Analysis Guide (5). All these tools require crash, roadway, and traffic data to achieve the most accurate results. Having additional data can also help support States' Highway Safety Improvement Programs (HSIP) as discussed in the Federal Highway Administration's (FHWA) guidance (6).
Safety data are the key to making sound decisions on the design and operation of roadways. By having the necessary roadway, traffic, and crash data and merging those datasets, an agency can make more informed decisions and better target their safety funds. The ability to merge these data helps agencies to better:
As shown in Figure 1, improvements in the data collection effort can drive more informed decision-making, which can lead to improved knowledge for decision makers to better target investments that provide the highest returns in reduced crashes and fatalities.
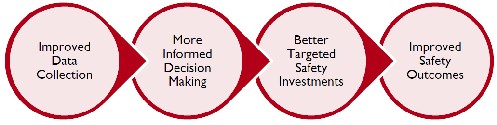
Figure 1. Role of Improved Data Collection Efforts in Safety Outcomes.
The Model Inventory of Roadway Elements (MIRE) is a recommended listing of roadway inventory and traffic elements critical to safety management. MIRE provides a data dictionary with definitions and attributes for each listed element (1). MIRE is a guideline on the traffic and roadway data agencies should collect to improve their transportation safety management system. It provides a basis for a standard data inventory and helps agencies move toward the use of performance measures to track data quality and safety outcomes.
While MIRE provides a recommended listing of what roadway and traffic data to collect, agencies still struggle with how to merge and analyze those datasets. A critical step toward acceptance and implementation of MIRE is the conversion of MIRE, which is now a listing data elements, into a management information system (MIS) that will allow agencies to analyze and merge datasets. FHWA has undertaken the MIRE MIS project to assist States in developing and integrating the MIRE into an MIS structure that will provide greater utility in collecting, maintaining, linking, and using MIRE data. The MIS project includes the exploration, development, and documentation of the following objectives:
The purpose of this report is to address the last three objectives. The first two objectives are covered in other reports from the MIRE MIS effort. This report provides a detailed overview of the MIRE MIS development effort which involved developing a conceptual structure of a MIRE MIS, developing a prototype based on the conceptual structure, testing the prototype using data from one of the Lead Agency Program States, and identifying the lessons learned and implications for further development and implementation.
The project team held a vetting workshop with representatives from nine States with expertise in safety data (e.g., roadway, traffic, and crash data), database management, and information technology (IT). The purpose of the workshop was to vet the structure of the MIS and obtain feedback on the feasibility of the MIS, barriers to implementation, and potential strategies to overcome those barriers. The feedback received from the participants was considered in the development of this report. The overall purpose of this report is to describe the concept of the MIRE MIS. This is not intended as requirements or a functional specification document.
FHWA released MIRE Version 1.0 in 2010 and is available online at the FHWA Office of Safety website (http://safety.fhwa.dot.gov/tools/data_tools/mirereport/). There are a total of 202 elements that comprise the MIRE listing. These elements are divided among three broad categories: roadway segments, roadway alignment, and roadway junctions. Examples of the MIRE data include:
Each data element has a priority rating, either "critical" or "value added." "Critical" elements are deemed necessary for States to conduct basic safety management and/or to use emerging safety analysis tools. Elements rated as "value added" are useful information, but not crucial in current versions of safety analysis tools. Each element listing also includes descriptions of alternatives to the preferred data elements if the intended data element is not readily available.
FHWA envisions MIRE as the primary standard for roadway inventory and traffic data variables; however, it does not contain all possible inventory data elements needed for every safety decision. Examples of additional supplemental databases include:
Agencies or groups within departments of transportation (DOTs) may already be collecting these supplemental data elements in addition to what is in the primary roadway inventory. Identifying and linking these databases with the primary roadway, traffic, and crash databases can help provide safety practitioners a more robust dataset to support their safety analysis efforts. This report will explore methodologies for enabling these linkages.
The MIRE MIS will help agencies in several ways. The MIS will provide a way to aggregate data from several existing systems to identify and objectively support cost-effective ways to improve safety. A secondary benefit will be the ability to identify high value targets for increased/improved data collection. Decision makers should feel more confident knowing that they are using data from a system that incorporates standardized data definitions and that the information provides a valid description of the roadways in a State or jurisdiction. Decision makers are increasingly mindful of the cost and value of the data they have available. Implementing a MIRE MIS can help a State save money on data collection by bringing in information through system interfaces, sharing resources, reducing overlaps, and utilizing more automated methods for merging data sets. States capable of doing this stand to benefit by providing decision makers with an enriched set of information. In addition to the benefits to safety, other areas may benefit as well. Asset management, highway operations, and maintenance functions of a typical DOT rely heavily on roadway inventory information to provide a first-cut analysis of where to spend current year resources and to project future resource needs. These programs will be able to work from reliable data to identify sites that share common features and descriptions. This information does not eliminate the need for field review, but it does help target the locations that are most likely to have a particular need based on their similarity to locations already programmed for work. Planners share in these benefits of a MIRE MIS with data that support detailed analyses of proposed project areas by having more precise and complete data on the roadway attributes at each site.
MIRE is intended as a guideline to help transportation agencies improve their roadway and traffic data inventories. Given the current economic constraints, it is not likely that any one agency will collect all 202 elements on all roadways. Rather, agencies should identify which elements are most important to help improving their safety programs, and use MIRE as a guideline for how to define the elements and recommended attributes. The MIRE MIS effort will provide guidance on implementing MIRE. In addition to this report on the structure of the MIRE MIS, there are additional products available as a result of the MIRE MIS project. These are:
Data Collection:
Performance Measures:
Development and testing of MIS structure:
These products are intended to further help State and local agencies improve the collection, maintenance, linkage, and use of their safety data. The lessons learned from the MIRE MIS effort and accompanying recommendations are intended as guidance to help support agencies efforts. Agencies are encouraged to tailor the recommendations and described practices to help fit their individual needs and agency objectives. All of the products of this effort will be available on the FHWA website http://safety.fhwa.dot.gov/rsdp/.
The purpose of the lead agency program was to determine the feasibility of collecting MIRE data and integrating it into a State's roadway inventory database. FHWA selected two States, New Hampshire and Washington, for the lead agency program through an application process. The pilot agencies determined where their inventories were deficient, and what elements they needed to add to accomplish their safety goals. New Hampshire served as a pilot for testing the MIS structure.
The first objective of this project was to develop a conceptual model of a MIRE MIS. This section provides a broad overview of the conceptual model including the potential business functions and methodologies an agency would need to undertake in order to implement a MIRE MIS. The research team predominantly based the design of the MIRE MIS on the MIRE data inventory published in 2010 (1). Ideally, agencies will integrate MIRE MIS with other roadway- related and supplemental databases that a State needs for safety analyses. Most State DOTs have not achieved this level of integration. As more DOTs adopt geographic information systems (GIS) for their network base mapping, integration of various types of safety data will continue and improve.
MIRE MIS involves the integration of several safety-related databases.
The MIRE MIS is designed as a relational database that States can map using their current GIS capabilities. The design of the MIRE MIS allows a State flexibility in obtaining its MIRE data elements, whether the State stores its existing systems in Oracle or another relational database, or whether the State imports/exports data elements from legacy systems. Once the State adds data elements to the MIRE MIS, they should already be familiar with processes used in State or Federal safety and spatial analysis tools.
Several States distribute the responsibility for various aspects of roadway-related data across departments. For example, the planning department is typically responsible for establishing the network based on original plans, change orders, and as-built plans. Once the department completes a roadway project and opens it to the public, the data for that roadway become available within the roadway database. At that time, other units and departments are responsible for collecting, correcting, and updating specific data elements within the roadway inventory database pertaining to that location. Figure 2 illustrates this flow of roadway data types in the MIRE MIS data flow diagram (DFD).
The DFD is a graphical representation of the flow of data through an information system. The DFD shows how a system is divided into smaller portions, and highlights the flow of data between those parts. The programmer can expand the context-level, or overview, DFD to show more details of the system as it is modeled. As the programmer adds more details to the model, the DFD allows users to visualize how the system will operate, what the system will accomplish, and how the system will be implemented. Appendix A contains the key describing the components of a DFD.
The DFD illustrated in Figure 2 shows the concept of the MIRE MIS as a decision support system that is available for safety-related reporting and analysis. It depicts the interaction and relationships between various inventories and processes.
MIRE MIS will use the various roadway-related databases that DOTs currently have. The DFD illustrates, for example, that the user will import roadway segment data from the existing roadway inventory database, bridge data elements from the bridge inspection and appraisal database, crash data elements from the crash database, and so forth. By establishing the MIRE MIS in this manner, reporting and analysis activities will not interfere with operational uses of the existing roadway-related databases.
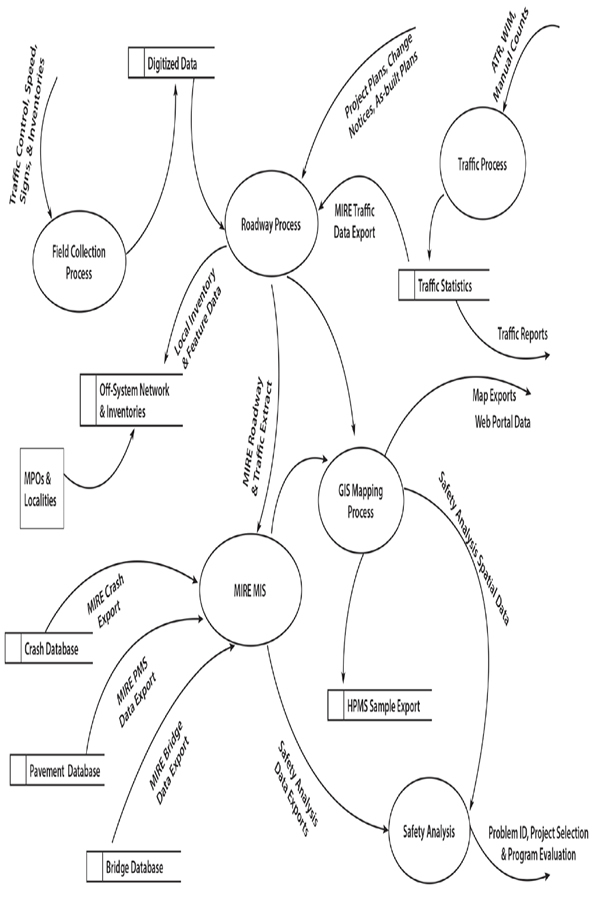
Figure 2. MIRE MIS Data Flow Diagram (see Appendix A for legend).
The research team evaluated data collection methods to document assets that can be included in a MIRE MIS. Examples of data collection methods include using an instrumented van, conducting a field survey, examining photogrammetry or aerial photography, and use of light detection and ranging (LIDAR) measurements. The report from that study, MIRE Element Collection Mechanisms and Gap Analysis, documents more specific information about the data collection process (7). The project team also conducted a pilot data collection effort through the Lead Agency Program. A report documenting that effort will be available as well. An additional outcome of this project is the MIRE Guidebook which provides guidance on how to collect MIRE data elements. All of these documents will be available online at the FHWA website http://safety.fhwa.dot.gov/rsdp/.
Entity Relationship Modeling is a technique used to analyze and model data using an Entity Relationship Diagram (ERD). There are two primary types of models discussed in this document: a conceptual model and a logical model. A conceptual model provides a quick, global reference of data structures. A logical model is a translation of the conceptual model into structures that can be implemented using a database management system (DBMS). Figure 3 is a conceptual model of a potential MIRE MIS illustrated in an ERD. Further description of the logical model is provided in the next section on the development of the MIRE MIS prototype.
An entity is an aggregation of a number of data elements, and an entity type is a class of entities with the same attributes. The ERD illustrates the relationship or association between two or more entities by showing the degrees of relationship (one-to-one, one-to-many, and many-to- many). Defining the degrees of relationship is known as cardinality. For this ERD, crow's foot notation is used to indicate the relationship between entities. The crow's foot indicates that there may be many matches between the two entities (e.g., many segments of roadway have many guardrails). The addition of a circle indicates that not all segments of roadway may have a guardrail on it. The connectors with double bars indicate a one-to-one relationship (e.g., this segment of roadway has one, and only one, pavement type).
The primary key (PK) represents the unique identifier for an entity. In a relational database, the entity is typically represented as a row in a table. The foreign key (FK) represents a reference within one entity (such as a roadway segment) to another entity (such as the State highway to which the segment belongs). Entities with clear backgrounds are the collection of MIRE data elements. The entities shaded in green are the supplemental data types outlined in MIRE Version 1.0 that are useful for safety analysis, but are not included in the specific 202 MIRE data element listing. These are the potential tables that States can define in a relational database for use as the MIRE MIS.
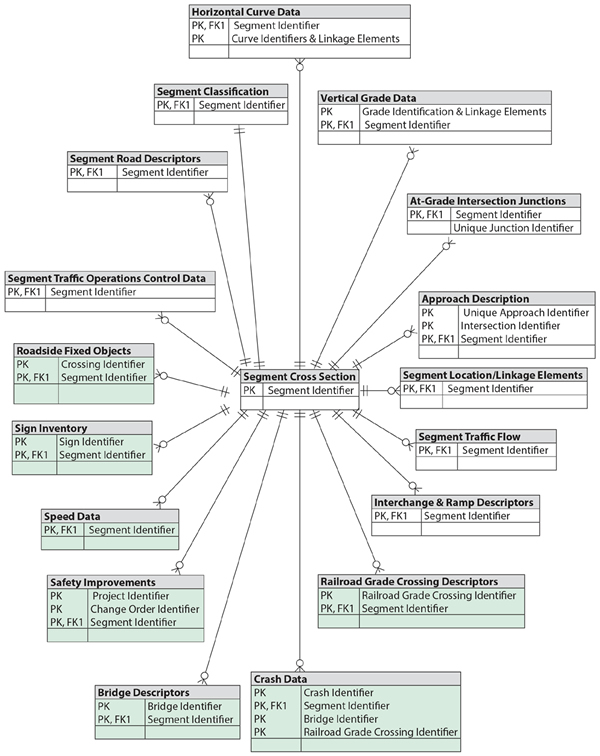
Figure 3. Model MIRE MIS Entity Relationship Diagram.
The following section provides an overview of the potential business requirements that a developer would satisfy if developing the MIRE MIS.
Address key State-approved performance indicators.
The suite of performance indicators will vary among States, but there are three main types of performance measures that can be supported:
Software/system service levels: these are indicators of the function of the software itself, useful in benchmarking and data management by users. Examples include tracking the number of records processed, proportion of records rejected, number of users, and system downtime. These measures would also be useful in tracking the cost of the system, including the costs associated with obtaining and storing the data.
System performance: these are comprised of data gathered to support agencies' indicators of performance in key areas (such as safety, mobility, asset management, etc.). Indicators that could be useful in linking the availability of MIRE-compliant data to improved safety (lives saved, injury levels reduced, and crashes avoided) would be included in this set of measurements.
Data quality: these are measures of the timeliness, accuracy, consistency, and completeness of the data in the MIRE MIS.
Work within context and framework of State-specific approach.
The MIRE MIS must fit within and support a State's existing business practices. For example, States define and combine data across segments in a variety of ways. The MIRE MIS will require flexibility to support multiple segmentation methods including those defined by changes in roadway features as well as those defined by distance, or a combination of both. Varying methods of aggregating data across segments must be accommodated including aggregation based on similar features, by route, by contiguous segments, rolling averages, and others. In essence, the segmentation in the core roadway inventory data will be mirrored by MIRE MIS.
Using a modeling tool such as an ERD or other modeling tools, document State-specific information required for creation of the database.
Modeling tools are useful from the IT perspective in that they provide a succinct view of the data, data sources, and the interactions among those sources. State-specific entity relationships are incorporated into the data model to guide the database design and insure that all necessary inputs, outputs, and linkages are supported.
Develop a technical diagram that identifies the groupings of data and elements used by name and description.
The technical diagram complements the system's data dictionary and the data model described in the ERD by showing the flow of data through the system and the major groupings of data by sources and outputs.
Develop a technical diagram that defines the relationship between the data groups and correctly structures (normalizes) the data.
Data relationships are described as one-to-one, one-to-many, many-to-one, and many-to-many. For example, crashes have a many-to-one relationship with any particular segment in the database. That is, many crashes can occur in one segment. In a fully normalized database, each data element is present once, but can (by virtue of its specific relationships) be accessed through multiple paths.
Document the location and structure of system integration points both for import and export data relevant to the MIRE MIS.
As part of identifying the sources and outputs for the MIRE MIS, all of the points for importing into and exporting data out of the system are defined in terms of the interface requirements, the point in the system's process the import or export occurs, how the operations run (on demand, automated batch processing, as a step in the records management processes at the source, etc.), and how often.
Provide ability to accept both original data entry and import from other data sources.
In addition to data import points, the system must accommodate manual data entry both from a central location and via remote access (e.g., web-based users with permission to add or update the data). The processes for both importing data electronically and manual data entry will be documented.
Provide ability to validate both electronic transmission and direct data entry based on defined business rules.
Systems evolve over time. It is anticipated that all implementations of MIRE MIS will begin with a set of data validations arising from the MIRE data dictionary as well as any State-specific data definitions that must be accommodated. Over time, as States identify errors that could be trapped through automated means, it is anticipated the number and complexity of validation checks will increase. The MIRE MIS will be designed with a basic set of error checks, but it will also accommodate the addition of new edit checks as defined by the users.
Provide electronic notification for critical and non-critical data errors.
Detect and reject any invalid manual data entry. During any form of automated data import, individual records or items will be flagged whenever any validation rule is violated. These rules generally are grouped by severity into critical (often called "fatal errors") and non-critical ("warnings"). Most commonly, fatal errors cause a record to be rejected—such records are held in a pending database awaiting correction and resubmittal. Errors generating a warning message may be allowed to remain uncorrected—the data are passed into the production database and updated if a correction is received. All errors are logged so that they may be analyzed and used for aggregate reporting of data quality measurements of accuracy, completeness, and consistency.
Establish communication protocol or use existing secure protocols based on industry standard mechanisms.
The MIRE MIS must be capable of one- and two-way communication with various system users, including data collectors, as well as interface with a variety of other systems. These communications typically require a secure connection between the user/source and the centralized system both to insure data integrity and to protect sensitive information from release. MIRE MIS will be designed to accommodate existing secure communications protocols in States where these exist, but it will also require some new communication protocols to be established in some States.
Provide standard templates for data entry and validation through browser interface.
The MIRE MIS data entry function will be web-based. Screens that open in a browser on a secure website will be built around a standardized template for all MIRE MIS implementations (customizable to meet a State's specific needs). Validation (including edit checks and interfaces with other systems) will take place during data entry and immediately upon submission of the data through the web. Data quality feedback (edit check results) will be provided to the user via the same web interface.
Provide notifications to log and track data input, updates, and deletions.
System management reports available to the custodian of the MIRE MIS records and IT support staff will track user's inputs, updates, and deletions. Error logs will also be stored to support management reporting of data quality.
Provide data collection tools via browser, such as GIS or mobile mapping.
The user interface for data collectors will be web-based. This interface will include standard screens for data entry as well as screens for users to access assistive technologies such as a GIS or map-based location validation and input.
Provide electronic submission for added digital or scanned attachments.
For specified types of entities (such as roadway segments and intersections), the system will provide a means to associate images with the entity. Users will have the option of directly uploading scanned or digital images into an image archive in the MIRE MIS. Because the data and images are associated, data managers and users will have the ability to search images in the database using a variety of search terms limited only by their access to the data elements in the database.
Provide the ability to accept data from other local or State databases.
MIRE MIS will accept data from local or other State roadway inventory files for which an interface has been defined or provided. This serves to reduce the amount of data that must be entered manually into the system and reduces the cost of data collection to the State by taking advantage of already existing sources—thus reducing redundancy.
Document and publish standards for data collection and transmission.
In order to ensure consistent and error-free data, all entries into the system must be validated prior to acceptance into the production database. A single unified set of validation rules and data definitions will be supplied to all data collectors. In addition, a package for those wishing to implement electronic data sharing (e.g., uploads and downloads) will also be provided with data transmission guidelines and required file structures. A testing protocol for acceptance of electronic data will also be developed and shared with these external sources of data.
Provide an imaging system that contains a database that can provide access to all supporting documentation associated with any roadway segment.
The imaging system supports users by making visual evidence available for review. Because each image is associated with a particular segment, the MIRE MIS also serves as an indexing system for sorting and retrieving of the images as well. While not intended to replace or function as a Photolog system, the image system in MIRE MIS can fill the need for storing of both scanned documents as well as digital photos captured in the field. This can support multiple uses including in-depth engineering analysis (e.g., condition diagramming) as well as asset management.
Receive and validate quality of submitted digital images.
Digital images can be validated by checking the final image record size against the original (as submitted). Another method is to examine the image for both a match to the original submission and already existing images in the MIRE MIS database. In rare cases, such as poor initial image quality, human intervention—a manual review of the images—may be required. These are more a matter of State agency policy and procedures than a function of MIRE MIS; however, the MIRE MIS will support a review of images by the staff.
Scan and index paper documents received from local agencies into a direct-access storage medium, creating digital images of reports and all supporting documentation provided.
In addition to digital photographs, the MIRE MIS image archive will be able to collect and store scanned images (of documents, hard-copy photos, or other materials obtained from local agencies) through digital scanning. As this process will be managed centrally by the MIRE MIS data steward agency staff, it assumed that indexing information will be added (i.e., image "wrapper" information) at the time the materials are scanned. This action will allow the scanned images to be added to the image archive and treated in the same manner, from that point forward, as are the digital images received from external sources (i.e., electronically transmitted to the MIRE MIS).
Provide a unique identifier for each document, including documents received from local agencies.
There are two types of unique identifiers that may be implemented in the MIRE MIS: system assigned and State assigned. The MIRE MIS will assign a unique identifier to each document received as a function of adding the document to the production database. In addition, each State may have its own document identifiers that it can assign (through manual or automated processes) to the documents as they arrive. MIRE MIS could track local agencies' document numbers but these are not assumed to be "unique" in that multiple agencies could conceivably assign the same document numbers to data in their own stand-alone systems. These document numbers are retained so that the State may use them in future contacts with the local agencies (e.g., to discuss a particular document or roadway segment).
Establish a process for returning manual or electronic data to local agencies for correction and track receipt of corrected submissions.
The MIRE MIS error logging and tracking function is designed to support State data quality management processes fully. Submitted data are automatically examined for errors. Each error is recorded as part of the "as submitted" data. Submitted items with critical (fatal) errors are automatically rejected (i.e., not added to the production database) and are held in a pending status until those serious errors are corrected or (at the State's option in some cases) over- ridden. Non-critical errors (i.e., those that generate a warning only) may be handled in a number of ways (at the State's option). Typically, non-critical errors are noted but the data themselves are not barred from addition to the production database. States may choose to hold the erroneous data in a pending status awaiting correction or not. In any case, the MIRE MIS supports notification of the submitting agency/staff of both critical and non-critical errors through case-level and aggregate reports. Case-level reports are specific to an individual record or data item that contains a critical error that must be corrected. Aggregate reports summarize the errors noted from each data submitter over some defined period (e.g., monthly, quarterly, or annually). The latter are a useful source of feedback to the submitting agencies and may be helpful in designing training content or revising data collection instructions/manuals. Finally, the MIRE MIS retains a log of all errors and all reports that contained an error. A tracking system is established that uses this information to generate reminder notices for any errors that have not been corrected by a specified time (e.g., two weeks after notification). These notices are provided to the system's administrators automatically and may be sent electronically to the submitting agencies responsible for correcting errors.
Establish automated workflow routings and work queues for data transmitted from other systems (e.g., pavement management systems [PMS], bridges, crashes).
The MIRE MIS supports agency workflows by notifying designated staff when a record matching an established routing definition is added to the system. These may be useful in a number of situations. One example is to establish work queues for internal staff (e.g., location coders, data quality managers, etc.). Another example may be to provide roadway inventory data for external users such as the Fatality Analysis Reporting System (FARS) analysts who may need accurate roadway segment descriptions to add to their records of fatal crashes.
Develop MIRE MIS application and relational database.
This is the main system development task and takes place after all the functions and State- specific modifications have been described. (Development of a prototype is described in further detail in the next section.)
Capture Graphical User Interface (GUI) input screens that enable keying from image or paper processes if needed, including split screen.
This task results in the main data entry system and process control screens for centralized scanning. It supports the paper-management process at the agency serving as the steward of statewide roadway inventory data. The same (or similar) data entry screens may be made available to external users in a form suitable for web-based remote data entry.
Establish an intuitive flow for data entry and include features such as highlighting, table driven drop down lists, pre-populated fields, capturing system dates, etc.
The MIRE MIS data entry process will support high quality data entry through user assistance and constraints. Pick lists, for example, serve to constrain users' inputs in comparison to entries made into a free text field so that only allowable information (data that will pass basic system edits) may be entered. Highlighting of specific fields during data entry helps users identify errors and mandatory data fields so that these may be addressed during initial data entry rather than waiting until the report is submitted.
Provide ability to flag items and data elements based on Federal and State rules, close out year rules, etc. (e.g., data used for the Highway Performance Monitoring System [HPMS], data used for SafetyAnalyst, data on-system/off-system).
These flags maybe treated as a specific type of validation rule which results in mandatory corrections (if the data as entered do not meet the reporting requirements) and for work-flow routing (e.g., flagging relevant data items for the staff responsible for HPMS, Highway Safety Information System [HSIS], etc.).
Provide ability to search/access digitized documents.
In the search/access function, the entire coded portion (all database contents with the exception of images) of the MIRE MIS can serve, if desired, as the indexing system. This means that users with the appropriate access permissions could obtain digitized documents matching any specified search criteria that would apply to non-image data. The search function will support both simple and complex queries. Simple queries are those that make use of one or a limited number of filters. Complex queries are those that may require the use of a query builder tool or a query model in order to ensure that all the tables in the MIRE MIS are accessed correctly. Queries result in a standardized list report that lists all data matching the search criteria. These may be fed into a reporting system that can generate output that is more advanced. The search of the digital image archive works in a similar way with the addition of the capability to specify a particular document type of interest (e.g., photo, scanned report, all images, etc.). In addition to this powerful query function designed for internal users of the MIRE MIS, it is also possible to support external users (and less-technical internal users) through a constrained query tool made available online. This tool is designed to allow users to build a query by selecting from among allowed data fields, establishing sort and filtering options, date ranges, and other criteria.
Support the designated number of internal and external users.
MIRE MIS stewards may establish limits on access to the system. Each user must establish an account that is secured with a login ID and password. The system's administrators can establish user access levels by class (e.g., administrator, database manager, general user, data entry, etc.) and for each individual (i.e., users may be granted selective access to some portions of a higher level class without being given the full permissions associated with that pre-defined class. Permissions may be established at the row level and for each database column independently to allow individual users (and classes of users) permission to view, edit, and/or delete information as separate permissions established in the user profile.
Provide an on-line, point-and-click, mapping location tool for data entry.
As a proven way to increase location data accuracy, users responsible for entering data will have access to a "smart map" which gives them a point-and-click interface for entering location data. Users can call up the map, zoom, pan in any direction, and click on the precise location of interest. The map will then supply all required location information and auto-populate the relevant fields on the data entry form. This may include latitude/longitude coordinates, roadway name(s), route number(s), segment ID number, milepoint/milepost, and any other information that is available from within the department's or State's GIS. If a Statewide GIS does not exist, it is possible to implement the smart map capability using generic mapping tools (e.g., Google Earth™).
Support a multi-linear referencing system.
MIRE MIS can incorporate translation tables to support multiple location coding methods including latitude/longitude, milepoint, milepost, and others. Ideally, the information is available within a GIS and the act of clicking on the smart map generates the relevant location information for entry into the MIRE MIS. Where this is not feasible, the MIRE MIS will still have the capability to store multiple location codes and the State can use the information entered into the MIRE MIS to develop the desired translation tables.
Provide for MIRE MIS retention and archiving as determined by State.
Each State may establish its own retention and archival process for MIRE MIS. The system can generate an archive file organized by year, which the State can then store separately. Archived data may be accessed through the MIRE MIS by the reverse process of "reattaching" the archive to the system at which the archived data become another database source that can be searched and used in analyses.
Provide a scalable and secure relational database with backup and recovery procedures.
The MIRE MIS is designed to work well regardless of the volume of data. The database is secure with administrator control over user access and permissions. Backup and recovery are supported through automated and administrator-controlled processes.
Provide web enabled analysis tool for authorized user groups.
Authorized users may access a set of web-based analysis tools that include search and report generating functions. The search tool will be designed to enable users to quickly specify criteria such as date ranges and selection/filtering criteria based on any column in the database to which they are allowed access. The search feature results in a list of matching rows that is then available for use in analyses. From the user's perspective, the selection criteria and report specification are just two steps in the process of generating a desired output from the system. Multiple user-generated output types are supported including a simple list report, one-way and multi-way cross tabulations, graphic displays, and data extracts. The State may specifically limit users as to which types of report they may obtain.
Support export of data for SafetyAnalyst and other tools as approved.
With any known standard for data submissions, MIRE MIS can be programmed to generate a compliant data extract. The system will be developed with the capability to provide data extracts matching the HPMS and SafetyAnalyst data input requirements. System administrators will have access to a tool that will allow them to update these output definitions and create new ones as the need arises.
Allow retrieval of roadway and crash data for proposed safety projects.
The MIRE MIS search and reporting functions support the intended use of the data in support of safety projects by providing authorized users a way to select relevant data and generate output reports. The search feature's output of a simple list of matching rows also supports users' access to individual items including inventory, crash, traffic, and any other data available through MIRE MIS. One possibility is that the data could be accessible through a GIS providing users with a map-based interface that would allow them to click on a location, call up crash reports for that location along with the related inventory and traffic data. This functionality is supported by MIRE MIS as it can provide data to an external GIS. MIRE MIS's web-based spatial analysis tool supports this capability for authorized users.
Provide analysis tools to authorized users in the form of queries and ad hoc reports from MIRE MIS.
The analysis functions within MIRE MIS are not constrained—every field in the database can be used in a query or report. User permissions established by the administrator control which fields are available to a particular user. The internal query and reporting capabilities are akin to those described for a general user audience via the web. In fact, the same tools are available to both users, but the one intended for general user access is constrained in that selected fields are not available for query or analysis. Internal users can access any field as long as they have the appropriate permissions as established by the system administrator.
Provide a web enabled spatial analysis tool for authorized user groups.
Authorized users will have access to a spatial analysis tool that can generate cross tabulation reports and support map-based output of results.
Provide ad hoc reporting ability for spatial analysis tool.
The ad hoc reporting capabilities of the spatial analysis tool include one-way and multi-way cross tabulations, and reporting of frequency counts and proportions (percentages).
Provide graphical depiction of analyses based on, for example, road sections, bridges, and intersections for specific timeframe and weather conditions.
Users of the web-based spatial analysis tool will have the option of producing graphical output in addition to the tabular reports. The graphical output may include support for condition diagrams, intersection/site diagrams of crashes, frequency histograms, pie charts, line graphs, and others.
Provide reports, queries, and/or inquires defined by the State, such as proposed safety project information.
The analytical tools designed for MIRE MIS support user-generated ad hoc query and analysis functions. Any query or analysis defined in the system may be saved for future use and shared with other users.
Allow authorized users to view and generate pre-defined reports, queries, and/or inquires via a browser.
State-defined standard reports are established in the system in the same way as ad hoc reports. They are simply saved and shared with the user community in general. The web-based analysis tool will allow users to access any pre-defined query or report accessible to them based on their permissions established by the system administrator. Users will be blocked from generating output from a standard/pre-defined report for which they do not have the required user permissions as established by the system administrator.
Provide an interface for submitting requests for additional standard reports via browser.
Users may request database searches and reports (i.e., analytic assistance) by completing a form available online. The MIRE MIS system will log and track all of these user requests. It will also support workflow routing of requests to the appropriate agency staff.
Generate mandated and standard reports for Federal agencies.
MIRE MIS will be programmed with a series of standard reports meeting the requirements established under Federal programs. These report definitions will be accessible to the relevant agency staff so that they can be modified in the future as reporting requirements change.
Provide aggregate information to other agencies and organizations via various media or through direct file transmission.
MIRE MIS will support electronic sharing of reports through creation of portable document format (PDF) output. The system will also support data transmission by allowing users to define data extracts, which can then be shared electronically. The system administrator in the user profile will establish user permissions for the creation of data extracts.
Embedded help file and help file index.
MIRE MIS documentation will be used to generate a help file that will be available to users from within the system interface by clicking on the "Help" button. The embedded help will document all user-accessible system features and the functioning of each option in the user interface.
Reporting and standards instruction manual.
MIRE MIS data definitions and relevant data validation checks will be documented in an instruction manual for data collectors. The same manual can be shared with analysts using the system so that they can be made aware of the conditions for data acceptance into the production database.
Context-sensitive help on data entry fields.
For data entry fields on any data entry form, users may access help in the form of information derived from the data collector's instruction manual. This will include the data definition for that field, instructions for completing data entry into the field, and relevant validation rules for that field.
Step-by-step system function assistance ("show-me-how").
For user-accessible functions defined in the system, the help file will contain step-by-step instructions on how to access and complete a desired task using that function. This type of user assistance is akin to a "show-me-how" set of steps that take the user through every step in the process.
Function completion wizards ("do-it-for-me").
For selected user-accessible functions, a wizard-based utility will provide users with expert-level automatic task completion. This is akin to a "do-it-for-me" command that will launch a default sequence of instructions and form completions by the system. Since it is impossible to anticipate every possible user need, this type of wizard-based approach effectively supports only the most standardized (routine) tasks; however, the wizards also serve an important training function within the system as it provides users with a complete and correct example upon which to base their own future uses of the system.
The MIRE MIS also includes a set of interactive tutorials. These are delivered as an animated, annotated slide show with multiple branching opportunities in which the user controls the forward progression based on choices made at each step in the process. This type of tutorial is a powerful user aid since it provides full step-by-step examples of task completion using the system. The ability to annotate key features of the presentation make this a good learning tool as well since users may be presented with options and explanations while they are working through the programmed examples.
The MIRE MIS design assumes that roadway-related and supplemental databases already exist in some form. For example, States may not yet be collecting data on approaches, ramps, and intersections. In this case, agencies should establish a policy to determine whether they would enter newly collected data into a separate database from the MIRE MIS or modify an existing database to accept the additional data. Since MIRE MIS will be a decision support system for safety analyses, the agency should establish a separate subject matter database rather than entering data directly into the MIRE MIS. In this manner, the agency will only export the specific data elements needed for safety analyses to the MIRE MIS database while maintaining operational integrity for other uses of these data.
The MIRE MIS should store safety data in a relational database. The relational database model has several advantages over other methods of storing data, such as a flat file database. A flat file database collects all stored information into a single table. This table may have many fields for each record stored in the list. In a flat file system, there is often duplicate information stored in these fields, or there could be data duplicated across several flat file systems. These systems require more storage and use more system resources than a relational database. A relational database uses multiple tables to store data. The data within each table is related, but relationships are also defined between data in one table and data in other tables in the system. These relationships are built by defining a PK for each table. A PK is one or more columns in a table that can be used to uniquely identify a single row in the table. For example, a route table would have some PK such as route identifier. A roadway segment table would have a column for primary route, which would "point to" the row in the route table. This column in the roadway segment table is the FK. When a relationship is defined between a PK in one table and an FK in another table, the two tables can be "joined", correlating all of the data in the two tables. In a larger relational database, there may be many such relationships defined. This structure has several important benefits for the MIRE MIS. The relational database model uses storage more efficiently and will perform better than a flat file with a large dataset. This makes it easier to scale the MIS. This system is also better suited to ad hoc queries and reporting, which will support the advanced analysis required to support safety decisions using this system.
The previous section contained a broad overview of the conceptual framework for the MIRE MIS. This section contains an overview of a specific prototype of a MIRE MIS that the project team developed and tested. The project team developed a prototype MIRE MIS based on the proposed conceptual structure to further explore the specifics of what would be involved in developing an MIS. The prototype expands upon the section "Central Data Validation and Entry – Develop MIRE MIS application and relational database" in the previous chapter. This prototype was a relational database built around the structure of the MIRE data dictionary.
The project team developed the prototype using data from the New Hampshire DOT (NHDOT). This section provides an overview of the prototype development and testing effort. Appendix C provides the ERD for the logical model. The project team built the MIRE MIS prototype to test the concept behind the MIRE MIS with the following goals:
The project team made several decisions on the technical approach that would impact the resulting MIS. The key decisions that were made include:
Using a standard database platform. The project team built the prototype MIS on the Microsoft Structured Query Language (SQL) platform for NHDOT. The system uses standard structures and does not utilize specialized or proprietary tools or functions within the platform. This was done to ensure that the MIS structure can be exported easily to another platform for further development.
Building the database around MIRE Version 1.0. The project team developed the structure of the relational database for the prototype to match the data elements to the structure defined in the MIRE Version 1.0 specification, rather than tailoring the database to existing data that NHDOT had previously collected. This is a fundamental decision that will need to be addressed in any implementation of the MIRE MIS that has practical implications on the functions that the system will provide, how the data will be maintained and updated, and the usefulness of comparisons of data from State to State.
Taking a single snapshot of the imported data. One of the challenges in developing a MIRE MIS is working with roadway and safety data that is collected at different points in time. Building a system to store data and track the time of collection is not difficult, though an agency would need to account for changes to the structure of data. More important is that the referencing system that assigns a unique identification to each roadway element (e.g., segments, intersections, ramps, etc.) can change from year to year. Each data source in the system can also use its own referencing system to locate elements. The project team built the MIRE MIS prototype for NHDOT on a single snapshot of data to narrow the development focus. Using a single snapshot of the data ensures that all data in the prototype uses the same referencing system. When working with data in the prototype system, the results are certain to be internally consistent. This makes it easier to analyze the structure of the system and the capabilities of this structure. This approach limits the ability to perform analysis on data from different years as the prototype does not have a means to rectify data from one referencing system to another.
Extending the database to include supplemental data. The MIRE MIS stores roadway inventory, traffic, and crash data along with other data pertaining to roadway safety. Supplemental data collected by NHDOT are listed in the MIRE Version 1.0 Report. These supplemental data were incorporated into the MIRE MIS prototype; a list of these supplemental data is included in the next section. These data were kept in the structure that NHDOT provided to the project team.
The purpose of this prototype was to develop the database model and attempt to import an existing data set into this structure. The conceptual framework identifies a list of functions that an agency should include in a fully developed MIS. Some of the functions listed in the previous section were not included in the prototype. These include:
Further exploration of these functions should be considered for future research.
The project team met with the NHDOT to determine what datasets at NHDOT contained MIRE data elements and supplemental data types. The NHDOT identified several data sets and provided them to the project team. These included:
This section provides the principles, assumptions, and decisions the project team used to transform the conceptual model to the logical model. The logical model then served as the basis for the prototype for NHDOT. The relationship between the conceptual and logical models is described in Simsion and Witt's Data Modeling Essentials. According to Simsion and Witt, "The conceptual data model is a (relatively) technology-independent specification of the data to be held in the database. It is the focus of communication between the data modeler and the business stakeholders, and is usually presented as a diagram with supporting documentation. The logical data model is a translation of the conceptual model into structures that can be implemented using a DBMS. Today, that usually means that this model specifies the tables and columns." (8). The initial MIRE MIS conceptual model fits the above description well. It closely matches MIRE Version 1.0, but adds another layer of organization clearly showing how the various groups of data elements are related. In the logical model, the project team attempted to translate the conceptual model into the structures of a relational database. This process includes normalizing the data by removing repeating groups and removing redundancy. It also includes defining lookup tables and selecting data types, as described in the following paragraphs. To avoided proprietary features implemented by any individual relational database management system (RDBMS) vendor, the project team built a working database from the model in Microsoft SQL Server. This process should be straightforward for any current RDBMS. In performing the translation the project team used established normalization methods, substituted lookup tables for most of the various lists contained in MIRE Version 1.0, and made several assumptions. These steps are documented in the following sections.
MIRE Version 1.0 has a few instances of repeating groups. The rules of relational normalization require these repeating groups be removed by putting them in their own tables. An example of a repeating group would be MIRE element 17, "Coinciding Route – Minor Route Information," within the Roadway Segment Descriptors. Specifically, the note "Additional elements may be needed to handle instances of more than one coinciding minor route" indicates that this data element is a repeating group (a group could consist of a single element). Thus, it was necessary to create a table specifically for the coinciding routes. Another example is the possible presence of some unspecified number of roads in an intersection. Element 122 is "Location Identifier for Road 1 Crossing Point." Element 123 is "Location Identifier for Road 2 Crossing Point." Element 124 is "Location Identifier for Additional Road Crossing Points."
Normalization requires removing redundancy. An example of redundancy is MIRE elements 1, "County Name" and 2, "County Code." To remove this kind of redundancy, the project team added the County table, where every county is uniquely identified by its county code. This table contains the name of the county, so that it is not included in each roadway segment. Instead, the Roadway Segment Inventory table contains a foreign key, County Code, which points to the County table and permits retrieving the county name from there as needed. There were not many redundancies, but the project team removed them where they existed. It should be noted that this normalization was part of the logical model, not specific to any single implementation. NHDOT does use its own county code rather than the Federal Information Processing System (FIPS) as recommended in MIRE.
The MIRE data dictionary provides suggestions for possible values (i.e., attributes) for each of the MIRE elements. Some of these are general such as "numeric", but there are many elements with a defined list of possible attributes. An example is element 19, "Functional Class" with listed attributes of Interstate, Principal arterial other freeways and expressways, Principal arterial other, minor arterial, major collector, minor collector, and local. In keeping with standard practice for logical data modeling, the project team developed lookup tables for each element that includes a list of attributes. Each lookup table has a PK. The referencing table, such as Roadway Segment Inventory, contains an FK that points to the lookup table. In most cases, the project team used an arbitrary integer for the key. This is known as a surrogate key. Surrogate keys should never be exposed to the user. In each case, the project team allowed null values in the FK columns to accommodate missing, unknown, or non-applicable data. This eliminates the need to use "dummy" values for missing data.
Reports that provide descriptions can be included in the lookup tables. Additionally, manual data entry screens provide users with a display list from which to choose. This approach allows the main tables to be smaller, since they do not have to physically contain long descriptions such as "Principal arterial other freeways and expressways." It also avoids the necessity of hard-coding these lists into data-entry interfaces. The use of lookup tables also allows States to customize the lists to their own requirements. For example, there are some data elements where the attributes used by NHDOT differs from the attributes given in MIRE Version 1.0.
Database management systems provide various data types, such as fixed length character strings, variable length character strings, dates, and a variety of numerical data types. The numerical data types include several sizes of integers and types for representing non-integer numbers. Each data element (column in the database) must have a data type assigned to it. The project team selected data types that will be useful to most States. For data elements measured in miles the project team used "decimal", which will handle a precision of 0.001 mile. For the length of the description fields (character strings) in lookup tables, the project team used the length of the longest value in the list, generally rounded up to the next 10 characters. In cases where there was no predominant reason for a particular choice, the project team used a data type that would work with NHDOT's data. As individual agencies begin to implement the MIS, they will need to make changes to data types to accommodate their existing data.
There are quite a few data elements where there could be multiple values (e.g., repeating groups that would have to be removed), but this is not mentioned in MIRE Version 1.0. As a result, the project team incorporated the implicit assumption that there will only ever be one:
Short of breaking these out into their own tables, agencies could provide guidance to data collectors and data entry personnel on which value takes precedence if there are two or more.
Additional assumptions include:
In some cases it was necessary for the project team to make decisions to accommodate NHDOT, as the initial database was built for them. The project team used an integer rather than a five-character identifier for element 2, "County Code" because NHDOT uses its own county list rather than the Census Bureau's list. Similarly, the project team used an integer for element 7, "City/Local Jurisdiction Urban Code" for the same reason. The project team also added a lookup table for NHDOT's Statewide Route Inventory.
MIRE Version 1.0 lists several different ways an agency could identify element 10, "Begin Point Segment Descriptor" and element 11, "End Point Segment Descriptor." For technical reasons, no single column in a database could accommodate all of these data types. To accommodate these elements the project team created two columns for each Segment Start Node and Segment End Node and defined them as character fields, all of which link to NHDOT's GIS data. Segment Start Mile and Segment End Mile are numeric fields and refer to milepoints on the segment's primary route.
NHDOT provided several data sets for inclusion in the MIRE MIS prototype. These include roadway inventory and crash data that NHDOT had previously collected, as well as intersection data the project team collected as a part of the Lead Agency Program. The project team also included supplemental data sets with information about bridges, rail crossings, and lighting. Some of the data supplied by NHDOT includes multi-year data (either multiple years for the same data set or different data sets that were collected in different years). Data collected in different years may correspond to a different referencing system, which makes it impossible to build a dependable correlation between data sets. The project team added a column to denote data collection year to ensure that data is only joined to other data from the same year.
The project team examined each of the data sets to determine which data corresponded to elements in the MIRE definition and the MIRE MIS data model. Data that mapped to the MIRE model were transformed as needed to rectify any differences between the structure of the source data and the structure developed for the MIRE database. Supplemental data which did not correspond to elements in the MIRE model were added to supplemental tables in the MIRE MIS prototype. These supplemental tables used the same structure as the source data provided by NHDOT.
The data from NHDOT came in several formats (e.g., Microsoft Access, DBase files). The project team extracted these data from NHDOT's GIS systems. NHDOT provided a data dictionary for their roadway segment inventory and the intersection data collected under the Lead Agency Program.
The roadway segment data provides the foundation for correlating all of the data in the MIRE MIS prototype. These data provide a spatial reference of the State and local roads included in the system. This reference is a subjective reference in that each segment does not include an absolute spatial reference (e.g., xy coordinates, latitude/longitude). Instead, segment location is described by relating to other data elements (nodes, routes, mileposts). A point along a roadway is described by identifying the roadway segment, then specifying a linear distance along that segment. This referencing system is specific to the year that the data were collected, and this system corresponds to some of the other data collected in that period (NHDOT updates their segment data on a three year schedule). While most of the segments do not change from one collection period to the next, the unique segment identifiers are re-assigned, and it is not possible to relate data from different years using the segment ID. Starting with the roadway segments, the project team examined each dataset and compared it to the structure of the MIRE MIS logical model. The project team mapped elements to a corresponding element in the MIRE structure. The project team used this mapping to import data to the system, and was able to transform the source data into the structure of the prototype system. Any data that the project team could not map to a corresponding element in the MIRE structure were mapped to a supplemental table in the extended MIRE MIS structure. Some of the data collected by NHDOT are mapped to the roadway segments using the unique segment identifiers. Other data referred instead to routes (a construction of one or more connected segments), that needed to be mapped to the corresponding roadway segments. These data needed to be compared to the roadway segment data to confirm that the references were valid. Records that could not be matched to a valid location (through matching a segment ID or spatial analysis) were identified as orphaned records. These data were imported into the MIRE MIS, but location data was stripped out to prevent any false results. Other data that did not use roadway segment ID's to reference location were loaded into a GIS to correlate the data using spatial analysis. The GIS was able to identify when an element in the source data matched a segment in the roadway segment data set, and map the segment ID when the data were imported. Data that did not match a segment ID were flagged as orphaned records and were added to the MIS without a location reference.
FINDINGS AND RECOMENDATIONS
MIRE MIS is a fairly large and complex system and, like other similar systems, has a number of challenges. Some of these challenges include:
Many more challenges could be listed. This section will not discuss generic factors that influence the feasibility of implementing a large and complex MIS in general. Instead, this section will focus on issues that, if not unique to MIRE MIS, at least have some special significance for this system in particular.
Implementation Scenarios and their Effect on Feasibility
Factors affecting feasibility will come into play in varying degrees depending on how an agency implements the system. In deciding how to implement the MIRE MIS, agencies should consider several issues, including:
Based on these issues, agencies should select implementation scenarios which could include implementing all, or part, of the MIRE MIS recommendations. An agency might attempt an all-at- once approach or a gradual, incremental approach. Most agencies would be expected to attempt the relatively low-cost, low-risk, and high-return pieces first.
The project team defined the three categories of implementation scenarios, in order of probable complexity and cost.
MIRE MIS as a stand-alone system is the easiest and fastest scenario. At a minimum, it requires only the database, import functions, and export functions. Of these, the import functions will present most of the challenges. If an agency is to use MIRE MIS for analytical purposes, it would be necessary to create user interfaces, reports, etc. Assuming the database and the import routines are sound and thorough, the interfaces and reports should present no specific challenges beyond what one would find in any system of comparable scope and complexity. In this scenario, MIRE MIS could be implemented in small increments, based on what data are most readily available. MIRE MIS as the primary system will have additional requirements and benefits compared to the stand-alone version. Specifically, it will require user interfaces for data input. While the interfaces will almost certainly include traditional data entry screens, there could be additional data entry modes. Note that in this scenario, the initial data load would probably come from existing systems, so import routines would still be required. MIRE MIS as part of an integrated set of systems could be extremely challenging to implement. MIRE MIS would probably include data elements that are not in the other systems, and would need data input and validation for those elements. Two-way data exchange with the other systems could require robust and complex connections on a network. The integration would mean that any changes to any of the member systems would have to be examined for their impact on all. Again, import routines will be needed at least for the initial data load.
Implementing the MIRE MIS involves cooperation across many organizations, particularly in the area of data collection. Some of these organizations' missions may align closely with the objectives of MIRE MIS, some hardly at all. Quality and comprehensiveness of the data will vary among the organizations. The data may be contained in a variety of organization- or task- specific formats not easily imported. Returning bad data to the issuing organization for correction may be difficult. Correlating the data will be challenging; especially, if different organizations use different ways of identifying items (e.g., locations by milepoint, GIS, latitude/longitude, etc.). Error correction and other workflows involve the movement of data, images, etc., across multiple systems owned by different jurisdictions with different priorities, goals, and standards. Political issues related to authority and responsibility will likely arise and have to be dealt with. Agencies should set up conflict resolution protocols to help deal with potential issues.
Importing data from existing systems is likely to be a significant challenge under any of the implementation scenarios. While this challenge is not entirely MIRE-specific, the project team expects it to be particularly significant in this context. An agency can expect the following conditions:
Obviously, inventory changes over time as roads are widened, signals added to intersections, and so on. Depending on an agency's data collection procedures, there might or might not be the possibility of tracking changes to an inventory item over time. If an agency collects roadway segment data in 2007 and again in 2012, it may not be possible to identify the same segment in both datasets. This can make it difficult to determine the effect of a given roadway improvement. It can be difficult to analyze the correlation between roadway conditions and crashes. For example, if an agency knew that a given segment had no rumble strips on March 1, and did have rumble strips on September 1 (but did not have specific information on the installation date), and there is a crash in July, the agency cannot know whether the rumble strips were present at that time. The agency cannot determine whether that crash happened on a roadway segment with or without rumble strips.
The project team encountered multiple segmentation methods in NHDOT's roadway segment data. The segments for pavement data are shorter than the segments used for other data. In addition, a single pavement segment might not be entirely contained within a single "regular" segment.
In itself, supporting multiple segmentation methods should not be very difficult. Agencies could use several roadway segment inventory tables, one for each method, or an additional column in the primary key indicating segment type. The problem, however, will be correlating them. Given a specific locus, such as a node, grade crossing, or crash, it could be difficult to identify all applicable segments.
The datasets used to evaluate the feasibility of implementing an MIRE MIS originated in a GIS format from multiple bureaus at NHDOT. Specifically, the attribute data associated with each dataset was imported into the MIRE MIS, but the spatial component of these datasets was not incorporated into the MIS. Within the MIRE MIS database, the GIS attribute information was restructured to match the data dictionary elements defined by MIRE. Currently, there is a disconnect between the management of the spatial data associated with each feature (geometry of the roadway segment), and the corresponding database elements. For example, if a roadway segment record in the MIRE MIS is modified or deleted there is no direct link back to the spatial component for that record.
Other factors affecting the use of the GIS data in the MIRE MIS relate to the design of the GIS input data. For example, the NHDOT road inventory database is designed around a linear referencing system and dynamic segmentation. Linear features (roadway segments) can be split/segmented (in some cases split into many tiny segments) based on attribute events located along a roadway without affecting the underlying geometry of the linear features. However, linear referencing does necessarily lend itself useful in the actual MIS because there can be instances where there is not a one-to-one (PK) relation between elements. For example, the pavement management data is stored in event tables that are linked to the GIS roadway segments using the GIS Unique Identifier. However there can be multiple pavement condition ratings for any given segment, which are identified based on the begin/end mile post of a roadway segment.
Based on the work completed to date, further research is needed to integrate the MIRE MIS data structure to the geographic/spatial roadway and traffic segments. Relationship classes, which define the relationships between spatial objects and non-spatial objects, must be created between the database attributes and the corresponding geometric features in order for spatial analyses to be performed on the information system as a whole. It appears that MIRE MIS could be advanced by integrating additional core principles of GIS into the data management scheme. For instance, in addition to tabular relationships, GIS heavily relies on spatial relationships and topological rules to represent data quality and to promote data analysis.
One of the key findings of this report was the importance of data quality. The research team organized the management of the system development process into three parts to ensure data quality for the MIRE MIS:
Data quality decisions may vary from State to State depending on their priorities. Quality planning involves deciding what level of quality to expect in the resulting system. The section of this document, Data Quality Performance Metrics, discussed these data standards. Agencies should include the standards for the system into the design of the system from the earliest possible point in the design cycle.
As part of the quality planning effort, the design team would also conduct a benefit/cost analysis for achieving the desired level of quality. Assessing the downside of increased quality can be a difficult task for designers unfamiliar with roadway data reporting and analysis in general, or for those system users who are unfamiliar with system development. Therefore, it is important that the system design team include personnel from both IT and user management functions so the team can decide how high to set the quality bar in an informed manner, and ensure that the resulting system is sustainable over time. Benefit/cost analysis is discussed in further detail in the following section.
The quality assurance process includes techniques used by the system development team to ensure that the system meets expectations. After the design is complete, the development team constructs and tests the system before implementation. Quality assurance continues after implementation as well. The measurements that apply to the system's performance may not seem familiar to those used to managing data quality, but they are very important for making sure that the system itself is not causing data problems. For example, does the system design allow access for all users who have a responsibility of analyzing safety data and setting project priorities? A measure of the percentage of critical users that have flexible access to MIRE MIS for analysis is a quality assurance metric. It tells system managers if there is a problem with the system's accessibility. Such "down time" may not have a measurable impact on more traditional data quality measures (e.g., timeliness, accuracy, completeness, etc.) but can have a major impact on how well the system is perceived by users, and how willing they are to continue using it. Following system implementation, the system developers and managers are the primary users of the quality assurance measures. These measures allow tracking of how well the hardware and software are performing, and lets managers know if there are problems that need to be addressed. They can also serve as an early warning of problems that could affect data quality – the bottom line for most users of a system.
For data managers and users, quality control is the most familiar part of the project planning process. Quality control is the set of measurements and procedures put in place to ensure that the data quality is meeting expectations. The measures of data quality can cover a wide variety of issues at a wide range of "levels" – from global indicators of overall quality, to micro-level indicators of the validity of data in one particular field of the database. Quality control processes are the responses of the system (the software and the people working with it) to quality problems that arise. For example, in the MIRE MIS, the data quality metrics would show if location data were not meeting expectations (e.g., location coding is not precise enough, or features cannot be matched to a location on the roadway network). The quality control processes are the response to these questions – what do the data managers and collectors do about the problems?
The three most desired types of system-level performance measures for the MIRE MIS system are those that would:
1) Relate the availability of the MIRE data to lives saved;
2) Accurately track the cost of maintaining the MIRE MIS; and
3) Reflect good customer service both intra-and interagency.
In other words, measurements of the benefits and costs associated with maintaining a complete and accurate record of the MIRE MIS data elements for the State.
It is a possibility that the MIRE MIS will have distributed databases; therefore, defining and obtaining the cost of entering data into the system may be difficult. For example, the planning division may establish the base network from design and as-built plans, while the inventory updates may be made in the maintenance or other divisions. These distributed costs make it more difficult to obtain a reliable cost estimate. The research team did not find agreed-upon standards for the components to include, or exclude, in the cost metric. Questions that should be considered include: should the time for the driver of the data collection van be included? Should the cost of supervisory review be a factor? If a roadway feature or crash report cannot be located accurately, should the cost of correction be included in the overall cost of operating the MIRE MIS?
If a State initially collects much of the data imported into the MIRE MIS for other uses, it could make the definition of costs and benefits more distinct from the State DOT's operational roadway databases. A standard method for explicitly tracking the system cost could include the following components:
The FHWA Office of Safety has developed a methodology to estimate the costs and benefits of investing in data and data systems for safety. This methodology was published in a Guidebook, Benefit-Cost Analysis of Investing in Data Systems and Processes for Data-Driven Safety Programs: Decision-Making Guidebook in October, 2012 (9).
States may wish to measure the impact of their MIRE MIS on delivery of service to the users of the roadway and other safety-related data. Customer service, in particular, may be affected by the use of a decision support system that consolidates safety-related data. A State may wish to measure how able it is to better meet customers' needs (both internal to the agency and external customers) once the MIRE MIS data are available electronically. For example, States could measure the proportion of data requests met via a web portal (thus requiring little or no direct staff time), as well as the time it takes to deliver data following a customer request. States wishing to show the full impact and utility of their system will measure customer service as well as costs.
Performance metrics/measures for data systems are tools for helping measure data quality and establishing goals for data improvement. The National Highway Traffic Safety Administration (NHTSA) defined performance measures for timeliness, accuracy, completeness, uniformity, integration, and accessibility for each of the six core traffic safety data systems – crash, vehicle, driver, roadway, citation/adjudication, and injury surveillance. An FHWA report, Performance Metrics for Roadway Inventory Data, conducted as part of the overall MIRE MIS project, builds on those metrics, providing a detailed review of each of the metrics proposed for roadway data and suggesting modifications of and possible additions to that original NHTSA list. The measurement of data quality using metrics is of little value without follow-up efforts to correct problems identified. The report also provides suggestions for data-related business practices that can lead to the successful use of metrics and to improvements in roadway data (10).
The MIRE MIS concept offers many potential benefits to agencies safety programs. The MIS brings together data from many sources. Each of these sources pertain to safety issues and can provide valuable information in determining where safety can be improved and what measures may be most effective.
In order for the MIRE MIS to be most functional, the data in the system need to be of a high quality (better data = better analysis results). But, the data also need to be well structured with a consistent data structure and referencing system from year to year. The first decisions made in a full implementation of a MIRE MIS will be which data to include in the system and how to connect the MIS to the source data. One approach is to export data from the source, then import to MIS and update the data on a regular schedule. If the data structure closely matches the structure of the MIS, an agency can largely automate importing and updating the data to keep the system up to date.
While developing the MIRE MIS prototype with data from NHDOT, two issues became clear:
1) The structure of the data did not match the MIRE structure, so data needed to be transformed to the MIS structure on import; and
2) The structure and referencing system of the data collected by NHDOT changed from year to year.
One of the keys to the success of an MIS is the ability to correlate data from disparate systems to the relevant roadway elements. NHDOT updates its roadway inventory annually to reflect changes (new roads, changed intersections, changed alignments, etc.). NHDOT assigns each roadway segment a unique identifier within that inventory, but these identifiers are not consistent from year to year. This limits the ability to correlate data between the sources in the MIS. The project team added the data in the NHDOT MIRE MIS prototype as a snapshot to try to maintain internal consistency between the data sets.
A full MIRE MIS implementation will contain data collected over time and will need a way to compare data from different collection periods. This way the system can provide analysis of conditions before and after improvements are made, and will allow comparative analysis of data quality. This underscores the importance of a consistent data structure and referencing system that can be used in the collection of safety data.
The MIRE MIS concept discusses several aspects of the system that could tie into a GIS to aid in data entry, querying, and spatial analysis. GIS can also be used to address some of the key concerns of data structure and spatial references changing over time. A GIS can apply an absolute spatial reference and provide spatial analysis tools for an alternate way to match data points from different systems, whether these represent the same data collected at different times (e.g., roadway segments from different years), or they represent different data with independent referencing systems (e.g., crash data and bridge data). Adding a GIS component does introduce platform dependencies that may differ from State to State, but regardless of the platform, tying the data into a GIS is an important part of the MIRE MIS.
Based on the work completed to date, further research is needed to integrate the MIRE MIS data structure to the geographic/spatial roadway and traffic segments. Relationship classes between the database attributes and the corresponding geometric features need to be explored in order for spatial analyses to be performed on the information system as whole. It appears that MIRE MIS could be advanced by integrating additional core principles of GIS into the data management scheme. For instance, in addition to tabular relationships, GIS heavily relies on spatial relationships and topological rules to represent data quality and to promote data analysis.
Integrating quality roadway and traffic data with crash data helps agencies make better decisions and more effective use of limited funds to improve safety. The overall MIRE MIS effort provides lessons on how to collect, integrate, manage, and measure data for improved safety decision- making. Even though there is some additional research that is needed, this effort to develop and test helps bring State and local agencies one step closer to realizing the benefits of establishing an MIS to support their own safety programs.
A Data Flow Diagram (DFD) is a graphical means of describing the flow of data through a system that produces, changes, or stores data. The DFD is a visual depiction of an automated or manual system from the perspective of the data. A DFD differs from a flowchart in its perspective: a flowchart describes a system of programs or manual processes that manipulate the data, while a DFD describes a system from the perspective of the flow of information. A DFD is drawn from most general to most specific in a series of levels of detail. Each page, or diagram, describes a part of the system with the first page (or "Level 0") DFD showing the most general picture of the data and its flow through the entire system. Any further pages (or "lower levels") of the DFD provide progressively more detail about the processes being described.
The numbering of the processes (defined below) is dependent on the "level" of the DFD. All Level 0 DFDs have single digit numbers for the processes. All Level 1 DFDs have two-digit numbers separated by a period (e.g., 1.2, 3.4). Each process of a Level 1 DFD will have the same first number as the higher level process that it describes, followed by a sequential number that is unique for that page or DFD level. For example, a Level 0 DFD has 3 processes; the developer numbers these processes as 1, 2*, and 3. Process 2 has an asterisk following it, which signifies that additional information about process 2 is on a lower level (or more specific) DFD.
Since process 2.3 has an asterisk, it too has a lower level (or more specific) DFD. All processes on this Level 2 DFD will be labeled 2.3.1, 2.3.2, 2.3.3, etc.
The DFD view uses the four graphic shapes defined below to describe the system.
| State Department Transportation | right arrow | ENTITY – This box represents an entity that is of involved in the flow of data. Entities are ordinarily a person, group of persons, an agency, etc. |
| 30 | Local Road Database | right arrow | DATA STORE – The rectangular box represents a data store incorporating the data that are flowing into it. These file(s), or data stores, can e computerized or manual. The number is unique for each data store throughout all of the DFDs to ensure that each data store is specifically identified. |
| 1.9.1* Assign Roadway Location |
right arrow | PROCESS – This oval represents a process or activity that is performed on the data flowing into it. The process is used when the data is actually changed or enhanced in such a way that it is important to show in the DFD. The change in the data can be effected by either an automated or a manual procedure. The asterisk signifies that more specific detail about this process may be found on a lower level page of the DFD. |
| Traffic Counts | right arrow | DATA FLOW – This arrow represents a flow of data into, or out of, an entity, data store, or Traffic Counts process. The designer labels the data flow arrow when necessary to clearly describe the specific type of data in the flow. |
Notes: The primary key in this case is the unique location identifier. The foreign key(s) may indicate another linkage key such as a bridge identifier or a crash identifier.
Source: Model Electronic Crash Data Collection System (11).
This diagram expands on the conceptual model to demonstrate the structures within a relational database. There is an ERD for segment, intersection, intersection leg, interchange and curves and grades.
Visit http://safety.fhwa.dot.gov/rsdp
| Robert Pollack robert.pollack@dot.gov 202-366-5019 |
Carol Tan, PhD carol.tan@dot.gov 202-493-3315 |
FHWA-SA-13-007

