U.S. Department of Transportation
Federal Highway Administration
1200 New Jersey Avenue, SE
Washington, DC 20590
202-366-4000
| < Previous | Table of Contents | Next > |
This chapter describes characteristics for fatal speeding-related intersection crashes. Crashes in the FARS databases were extracted based on the most recent definition utilized by FHWA as described in Chapter 2. Intersection crashes were extracted from the FARS data for 2010 to 2012.
The majority of fatal crashes at intersections occurred in rural areas (38 percent) while 35 percent of speeding-related fatal crashes occurred in rural areas.
Many roadway characteristics within FARS are reported at the vehicle level. Since roadway characteristics were coded at the vehicle level and more than one vehicle may be involved in a crash, more than one roadway characteristic may be reported for each crash. For instance a crash between a vehicle at a major and minor approach for a two-way stop would be reported as "no control" and "stop sign."
Figure 19 shows the distribution of all vehicles involved in speeding-related fatal crashes by type of intersection traffic control. Percentages for the pie chart add up to 100 percent. As indicated, 28 percent of all vehicles involved in fatal speeding-related intersection crashes were at an intersection with a traffic signal, 15 percent occurred at stop-controlled intersections, and 51 percent occurred at intersections with no stop control.
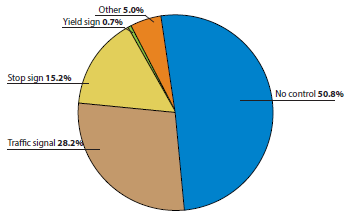
Figure 20 shows the percentage of vehicles involved in fatal intersection crashes that were coded as speeding-related by type of intersection traffic control where the crash occurred. Each bar shows the total percentage of vehicles for that category (i.e. each bar equals 100 percent). As shown, 11.4 percent of vehicles involved in fatal crashes that occurred on an intersection approach with a traffic signal were coded as being speeding-related while 88.6 percent were not speeding-related. The type of intersection traffic control with the highest percentage of vehicles involved in speeding-related fatal crashes was yield signs, with 13.1 percent. The lowest percentage of vehicles involved in speeding-related fatal crashes was at stop signs, with 10.3 percent.
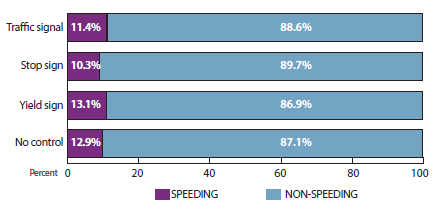
Figure 21 shows the distribution of all vehicles involved in speeding-related fatal crashes by type of intersection. The majority of vehicles involved in fatal speeding-related intersection crashes occurred at intersections with four approaches, as shown in Figure 14 (45.1 percent). Roundabouts and traffic circles made up less than 1 percent and T-intersections accounted for 34.2 percent of vehicles involved in fatal speeding-related crashes at intersections.
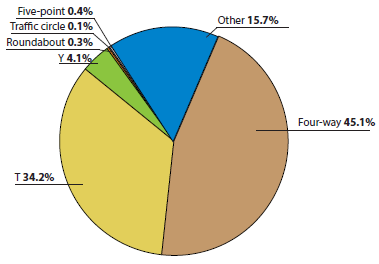
Figure 22 shows the distribution of vehicles involved in speeding-related fatal intersection crashes by type of roadway. As the chart shows, the majority of vehicles involved in speeding-related intersection crashes were coded as being on principal arterials (30.1 percent), which excludes freeway, expressways, and interstates. A large percentage of vehicles were coded as being on minor arterials and local roads—22.8 percent and 26.9 percent, respectively.
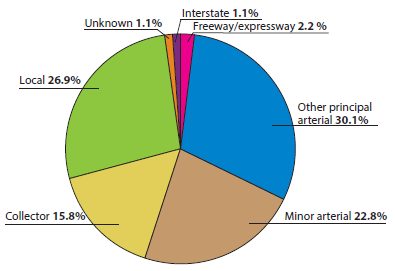
Figure 23 shows the percentage of vehicles involved in speeding-related fatal intersection crashes by type of roadway. The percentages for each bar equal 100 percent
As shown, the highest percentage of vehicles involved in speeding-related fatal intersection crashes was for interstates, at 28.9 percent. Other principal arterials had the lowest percentage of vehicles coded as speeding-related intersection crashes (17.8 percent). The remaining roadway types had similar fractions of vehicles involved in speeding-related fatal intersection crashes with 20.5 and 26.3 percent.
Figure 24 shows the distribution of all vehicles involved in speeding-related fatal intersection crashes by speed limit. It should be noted that speed limit is correlated to roadway type. The largest share of vehicles involved in speeding-related intersection crashes, 30.1 percent, occur on roadways with speed limits of 40 or 45 miles per hour (mph). This is followed by roadways posted at 30 to 35 mph, with 27.9 percent.
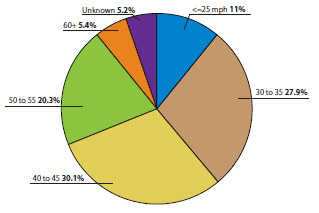
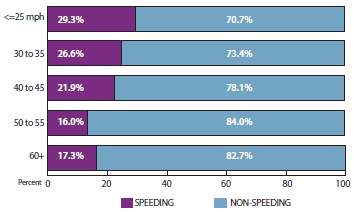
Figure 25 shows the percentages of vehicles involved in fatal intersection fatal intersection crashes for each speed limit category. Each bar shows the percentage of fatal crashes for that category (speeding and non-speaking related for each bar equals 100 percent).
As noted, almost 30 percent of vehicles involved in fatal intersection crashes at approaches which were signed at 25 mph or less were coded as speeding related. Only 17.3 percent of vehicles involved in fatal crashes at intersections/interchanges on approach roadways posted at 60 mph or higher were coded as speeding-related.
Males made up 71.2 percent of drivers involved in fatal crashes at intersections. They accounted for 76.6 percent of speeding-related fatalities at intersections.
Figure 26 shows the percentage of drivers by age and gender who were involved in fatal intersection crashes which were coded as speeding-related. Each bar shows the percentage of speeding-related fatal crashes for that category. As the chart indicates, 20.8 percent of female drivers aged 15 to 20 who were involved in a fatal crash were coded as speeding-related. Conversely 79.2 percent of female drivers in that age group were not coded as speeding-related.
The age group 21 to 24 years had the highest fraction of speeding-related crashes for both male and females. As illustrated, almost 36 percent of male drivers aged 21 to 24 involved in intersection fatalities were coded as speeding-related while 24.3 percent of female drivers aged 21 to 24 were coded as speeding-related. Older drivers had the lowest fraction with around 10 percent for both female and males being coded as speeding-related.
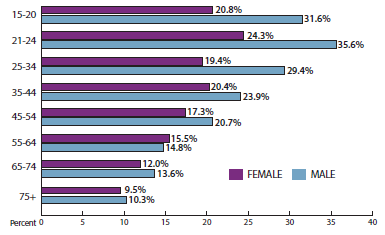
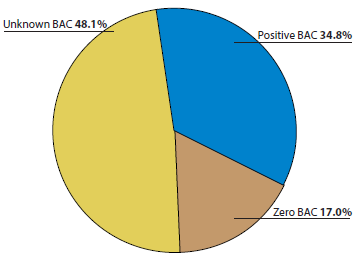
Figure 27 shows the distribution of drivers who were involved speeding-related intersection fatal crashes by blood alcohol concentration (BAC). As noted, BAC was not known for the majority of crashes (48.1 percent). Around one-third of drivers had a positive BAC while no BAC was noted in around 17.0 percent of fatal crashes.
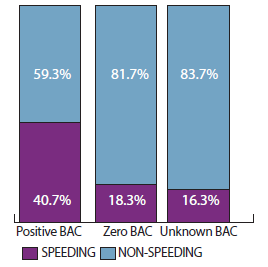
The percentage of drivers involved in fatal intersection crashes by BAC is provided in Figure 28. Each column shows the distribution for that particular category and the column totals to 100 percent.
The data show that drivers involved in fatal intersection crashes with positive BAC were more likely to be speeding-related than those with zero or unknown BAC. Around 41 percent of fatal intersection crashes where the driver had a positive BAC were speeding-related. Only 18 percent of fatal intersection crashes where the driver had zero BAC were speeding-related.
Fatal crashes by at intersections by time of day were summarized.
Figure 29 shows the distribution of speeding-related intersection fatal crashes by time of day. As noted, around half of crashes occurred during the daytime with the remaining occurring during nighttime or dawn/dusk. Thirty-two percent of fatal intersection crashes occurred during nighttime at intersections with lighting and 15 percent occurred at intersections with no lighting.
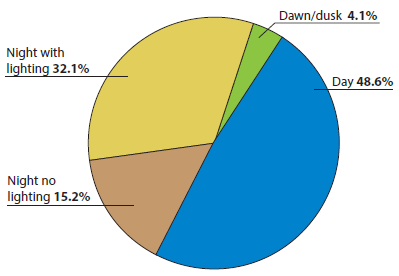
Figure 30 shows the percentage of speeding-related fatal crashes by time of day (each bar equal 100 percent). As shown, 21 percent of fatal intersection crashes that occurred during dawn/dusk were speeding-related. Around 24 percent of fatal intersection crashes that occurred during the nighttime with no lighting were speeding-related, and speeding-related crashes accounted for 28 percent of crashes that occurred during the night with lighting. Only 17 percent of fatal crashes that occurred during the daytime at intersections were speeding-related.
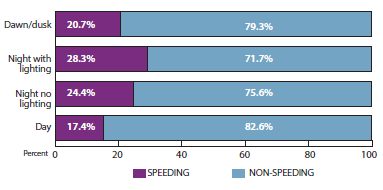
Figure 31 shows the distribution of speeding-related fatal intersection crashes by hour of the day. As noted, the majority of speeding-related crashes occurred from 6 p.m. to midnight (31.3 percent) followed by mid-day (10 a.m. to 4 p.m.) at 23.2 percent.
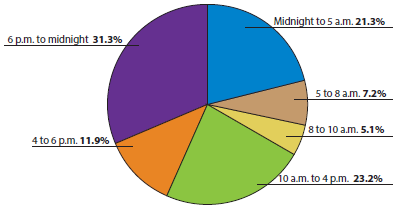
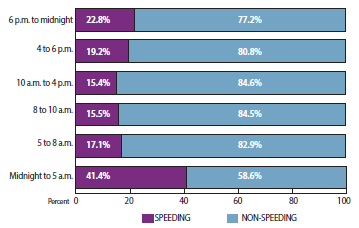
Figure 32 illustrates the percentage of speeding-related fatal intersection crashes by hour of day (each bar equals 100 percent). More than 22 percent of fatal intersection crashes that occurred from 6 p.m. to midnight were speeding-related. The percentage of speeding-related crashes was highest during the early hours of the day (midnight to 5 a.m.) at 41.4 percent. The percentage of speeding-related intersection crashes were much lower during daytime periods with 15.4 to 19.2 percent between 5 a.m. to 6 p.m. A higher percentage (22.8 percent) of speeding-related crashes accounted for fatal crashes during the 6 p.m. to midnight period.
Figure 33 shows the distribution of surface conditions for speeding-related fatal intersection crashes. Surface conditions are reported by vehicle. The majority of vehicles involved in speeding-related fatal crashes at intersections were on dry roads (89 percent) with 8 percent being on a wet roadway surface.
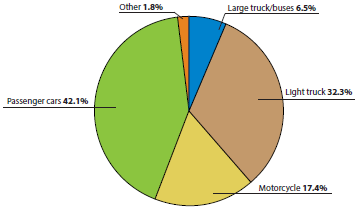
The distribution of vehicles involved in fatal intersection crashes by vehicle type is shown in Figure 34. Passenger vehicles were the most likely to be involved in speeding-related intersection crashes, making up 42.1 percent of all vehicles involved in these types of crashes. At 6.5 percent, large trucks represented the smallest share of vehicles involved in speeding-related intersection crashes.
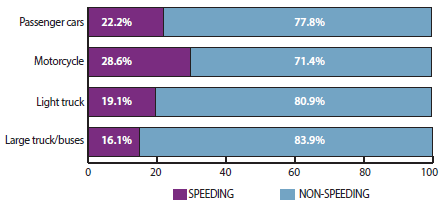
The fraction of fatal intersection crashes by vehicle types that were speeding-related is shown in Figure 35. Each bar shows the distribution for that vehicle type.
Over 22 percent of passenger cars involved in fatal crashes at intersections were coded as being speeding-related (conversely 78 percent were not speeding-related). Motorcycles ranked highest, with 28.6 percent of motorcycles involved in fatal intersection crashes being coded as speeding-related. Large trucks were the least likely to be coded as speeding-related at 19.1 percent.
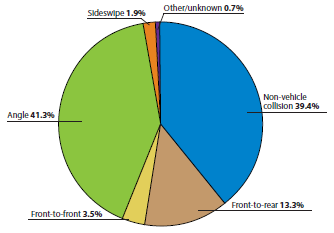
Fatal intersection crashes were disaggregated by crash type as shown in Figure 36. As noted, angle crashes made up the highest percentage of speeding-related intersection fatal crashes (41.3 percent). Collisions with non-vehicle objects accounted for 39.4 percent of speeding-related fatal crashes at intersections.
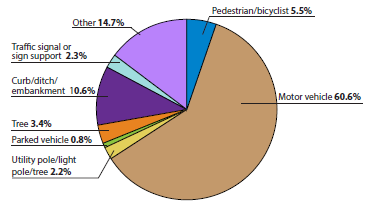
The distribution of first harmful event for speeding-related fatal intersection crashes is shown in Figure 37. As noted, the majority of crashes involve a collision with another vehicle (60.1 percent). Collision with a pedestrian or bicyclist make up 5.5 percent of speeding-related intersection fatal crashes. Collisions with traffic signals, signs, utility poles, light posts, and trees collectively account for 4.5 percent.
This section summarizes characteristics of angle crashes. Type of crash was determined from manner of collision. Due to the manner in which this field is coded in FARS, right angle crashes could not be differentiated. As a result, this section summarizes characteristics of all angle crashes. Left-turn crashes were included in angle crashes. Since left-turn crashes could be inferred from a vehicle's pre-event movement, a separate summary for left turn crashes is also provided in Section 3.8.
Data for the analyses in this section were reduced at the vehicle level. Notably, 30 percent of fatal intersection angle crashes occurred in rural areas.
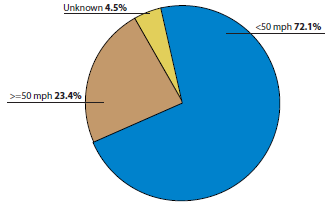
Figure 38 shows the distribution of vehicles involved in fatal angle crashes by the posted speed limit of the corresponding roadway. Around 72 percent of vehicles involved in speeding-related fatal broadside intersection crashes were on roadways posted lower than 50 mph and around 23 percent were on facilities signed at 50 mph or higher.
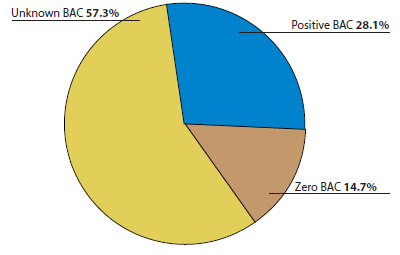
Driver alcohol involvement in fatal angle crashes at intersections that are speeding-related are shown in Figure 39. Blood alcohol concentrations was not known in the majority of crashes (57.3 percent) while 28.1 percent had a positive BAC.
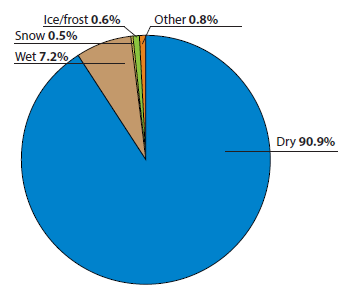
Roadway surface for speeding-related fatal angle crashes at intersections is shown in Figure 40. As noted, the majority of vehicles involved were coded as being on dry roads (90.9 percent).
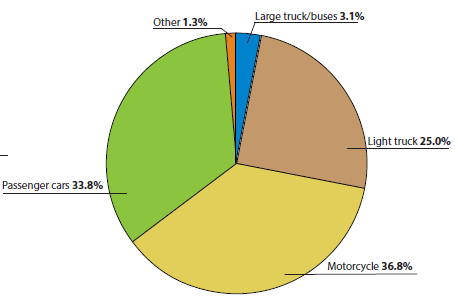
Vehicle involvement in fatal angle crashes at intersections that are speeding-related is shown in Figure 41. As noted motorcycles make up the majority of fatal speeding-related broadside crashes (36.8 percent) followed by passenger vehicles (33.8 percent).
Rear-end crashes make up 6.4 percent of all fatal crashes at intersections but make up 13.3 percent of speed-related fatal crashes at intersections. Around 44 percent of rear-end fatal intersection crashes were in rural areas. This section summarizes characteristics of fatal rear-end intersection crashes. Data were summarized at the vehicle level.
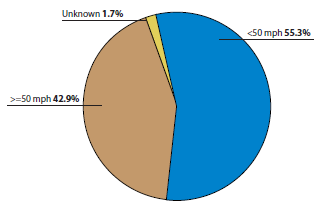
Figure 42 shows the distribution of vehicles involved in fatal rear-end crashes at intersections that were speeding-related. As shown, approximately 55 percent were on roadways posted lower than 50 mph and around 43 percent were on facilities signed at 50 mph or higher.
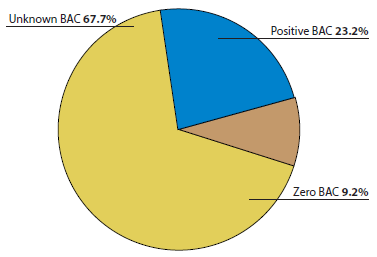
The distribution of drivers involved in fatal rear-end intersection crashes that are speeding-related broken out by BAC are shown in Figure 43. Blood alcohol concentrations were not known in the majority of crashes (67.7 percent) while 23.2 percent had a positive BAC. Drivers with zero BAC accounted for less than 10 percent of drivers involved.
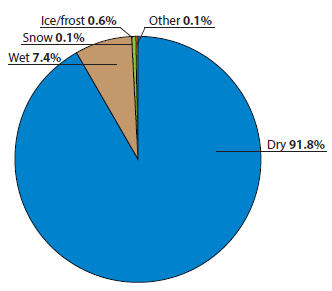
Roadway surface for vehicles involved in speeding-related fatal rear-end intersection crashes is shown in Figure 44. As noted, the majority of vehicles involved in fatal rear-end crashes that were speeding-related occurred under dry road conditions (91.8 percent). Slightly more than 7 percent occurred on wet roads and less than 1 percent occurred on other surface conditions.
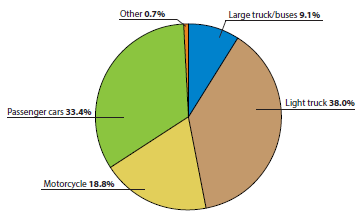
The distribution of vehicles involved in fatal rear-end crashes at intersections that are speeding-related is shown in Figure 45. As noted light trucks make up the majority of fatal involvement (38.0 percent) followed by passenger vehicles at 33.4 percent. Motorcycles accounted for 18.8 percent of speeding-related fatal rear-end crashes, and large truck/buses made up 9.1 percent.
This section summarizes characteristics of left-turn crashes. Data for analysis in this section were reduced at the vehicle level. Left-turn crashes could be inferred from a vehicle's pre-event movement. Left-turn crashes were also included in angle crashes, which were summarized in Section 3.6. Notably, 31 percent of fatal intersection angle crashes occurred in rural areas.
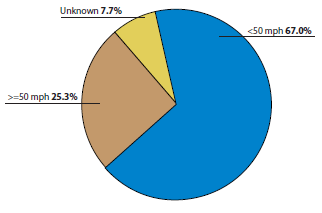
Figure 46 shows the distribution of vehicles involved in left-turn crashes by the posted speed limit of the corresponding roadway. Around 67 percent of vehicles involved in speeding-related fatal left-turn intersection crashes were on roadways posted lower than 50 mph and around 25 percent were on facilities signed at 50 mph or higher.
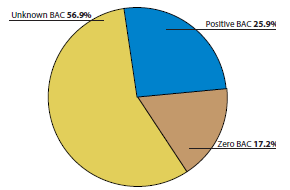
The distribution of drivers involved in fatal left-turn intersection crashes that are speeding-related by blood alcohol concentration is shown in Figure 47. Blood alcohol concentration was not known in the majority of crashes (56.9 percent), while 17.2 percent had a positive BAC.
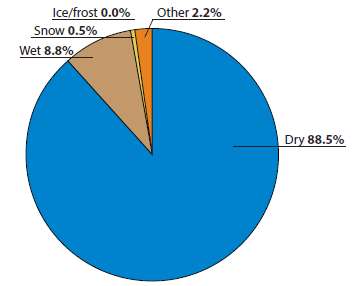
Roadway surface for speeding-related fatal left-turn intersection crashes is shown in Figure 48. As noted, the majority of vehicles involved were coded as being on dry roads (88.5 percent). Almost 9 percent of vehicles involved in fatal speeding-related left turn crashes were on wet roads, with less than 1 percent on roads coded as ice/frost or snow.
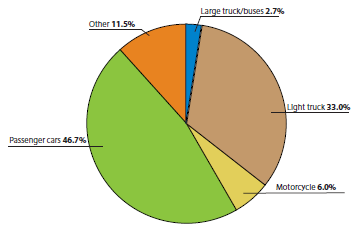
The distribution of vehicles involved in fatal speeding-related left-turn crashes at intersections is shown in Figure 49. As noted, passenger vehicles make up the majority of fatal speeding-related left-turn crashes (46.7 percent) followed by light trucks (33.0 percent). Motorcycles make up 6.0 percent and large trucks/buses make up only 2.7 percent.