U.S. Department of Transportation
Federal Highway Administration
1200 New Jersey Avenue, SE
Washington, DC 20590
202-366-4000
This manual provides information on the costs and benefits of safety treatments on high risk rural roads (HRRR).
Agencies can use this manual to determine the following information related to the treatments:
In addition, this manual provides information on the decision-making process necessary to identify treatments.
With limited data specific to HRRR, it can be challenging for agencies to effectively use limited funds for treatments on HRRR. The purpose of this manual is to provide a comparison between the cost-effectiveness of safety treatments on HRRR, identify where the treatments may be more effectively used, and present initial and ongoing costs associated with installation. The objective is to assist agencies in finding effective ways to efficiently allocate safety improvement funds on HRRR to achieve a greater reduction in the number and severity of rural roadway crashes.
This manual is organized to assist in selection of safety treatments based on roadway feature type (e.g., horizontal curves). The treatments are organized into 10 categories such that treatments can be compared at like locations. The safety treatments are separated into the following sections according to the corresponding roadway feature type and correlate to a color coded tab at the bottom of the page:
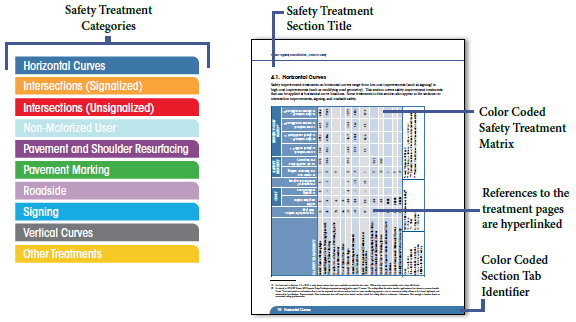
At the beginning of each treatment category section, a treatment matrix provides an overview of benefits and costs associated with each safety improvement in the section. The matrix may be used to help narrow the list of potential treatments by sorting through criteria specific to the practitioner's needs and available resources. For example, if a practitioner would like to identify an intersection treatment with a maximum initial cost, the matrix can be used to narrow the treatments to only those falling within the maximum range. Figure 1 shows an abbreviated version of the Horizontal Curve Treatment Matrix.
| Safety Treatment | For more information, visit page | Cost | Frequency of Maintenance (years) | Safety Benefit | Benefit Cost Ratio19 | |||||
|---|---|---|---|---|---|---|---|---|---|---|
| Initial Implementation | Ongoing Maintenance | NCHRP 500 Performance Rating | Crash Modification Factor (CMF) | Lower Volume*, Optimal Width*** | Higher Volume**, Optimal Conditions*** | Lower Volume*, Narrower Conditions**** | Higher Volume**, Narrower Conditions**** | |||
| Install Curve Warning Signs | 11 | $ | $ | 5 | P | 0.70 | 33.8 | 270.1 | 43.5 | 428.4 |
| Install/ Upgrade Curve Warning Signs with Fluorescent Yellow Sheeting | 12 | $ | - | 5 | P | 0.66 | 63.1 | 490.4 | 75.1 | 739.9 |
Cost: NCHRP 500 Performance rating20 *Lower Volume ≤1000 vpd |
||||||||||
The users of this manual can follow the decision flow charts in Chapter 6 to determine a range of treatment options based on the resources available to implement a treatment. This manual does not provide a full comprehensive list of every treatment available, and is only a guide to assist an agency in determining a potential range of treatments. An agency should always use an engineering study to determine if a specific treatment would be ideal at a location due to the site characteristics, agency standards, local driving laws, and other factors. In addition, the manual is focused on infrastructure safety improvements. It does not include enforcement, education, or emergency medical services treatments.
This manual only addresses treatments on HRRR, which are limited to rural collectors and rural local roads. While rural roads also include Interstate highways and arterials, those roadways are not addressed in this manual. Treatment costs were identified through a survey of State, local, and Tribal agencies with experience applying safety treatments on HRRR. Resulting treatments costs were averaged and may not be representative of costs required to employ the treatments at each applicable location or costs incurred by each agency.
For each treatment where cost information was provided by agencies in the survey, a benefit cost ratio (BCR) is shown. A BCR value greater than 1.0 reflects a return on investment. For example, a BCR of 2.5 suggests that for every one dollar spent, a $2.50 benefit can be expected. Additional information related to how BCRs for safety treatments are calculated can be found in Section 6.4.
When responding to the survey, agencies did not always provide benefit or cost information for each safety treatment. In these cases, benefits, costs, or BCRs were not included in the HRRR Treatment Matrix.

