U.S. Department of Transportation
Federal Highway Administration
1200 New Jersey Avenue, SE
Washington, DC 20590
202-366-4000
This section contains descriptions of programs that illustrate the methods and processes used by State, district, and county staff to collaborate on improving data access and methods for conducting data analysis. These programs illustrate how improvements can be made. More examples are included in the sources listed in Appendix B.
The examples are shared in increasing order of the complexity of the data analysis method. The first two are basic examples using relatively simple equations to analyze route segments and intersections by the number and severity of traffic crashes. The third example provides an intermediate level of analysis, including crash rates in the calculations. The final example is more advanced, incorporating methodology from the recently-published Highway Safety Manual (HSM).
Basic Example: Analysis of Roadway Departure Crashes on Local Roads
Oregon DOT
Description
In 2010 the Oregon DOT and FHWA began a project to analyze roadway departure crashes on both State and local roads. The result of the study would be a Roadway Departure Safety Implementation Plan designed to reduce roadway departure crashes.
In Oregon, spot location data (by milepost or GPS coordinate) was available for crashes that occur on State-maintained routes. However, this level of detail was unavailable for crashes occurring on locally maintained roadways. Crashes could be located on a certain roadway, but not at a point on that roadway. At the time of the data analysis, neither traffic volume counts nor the length of each roadway were available for local roads.
Methodology (Basic)
Oregon faced two significant limitations to the ability to analyze their roadway departure crash data on the local system. First, the lack of specific location and roadway attribute information on local roads made it impossible to pinpoint specific curves or sections of roadway for treatment. Second, not having traffic counts or roadway lengths made it impossible to calculate crash rates.
Due to these limitations, it was necessary to focus instead on the available information. The local road crashes did have information on the contributing circumstances of the crash, including the following:
The crashes also included the following additional information:
Oregon DOT and FHWA used this information to identify systematic treatments for local roads, including curve signing and delineation, rumble strips, and tree removal. Cost estimates were based on an average length of 10 miles for each local road, which, when applied over the system, provided a sufficient estimate for preliminary program planning.
Next Steps
The Oregon DOT will proceed with low-cost safety treatments on the identified roadways based on the type of roadway departure crashes that occurred on each local road. They will also seek to improve data availability, starting with determining the length of each local roadway. Future efforts include determining the location of local road crashes along the roadway by coding all crashes by latitude and longitude.
Contact
Doug Bish
Oregon DOT
(503) 986-3594
douglas.w.bish@odot.state.or.us
Basic Example: Data Analysis at the Regional Planning Level
Mid-Ohio Regional Planning Commission
Description
Crash data in Ohio often lack important information, such as accurate locations, safety belt use, and contributing crash factors. Inconsistent location reporting also has compromised the ability to direct safety resources to the most hazardous locations. Law enforcement officers often indicate crash location by noting the closest intersection or nearest point on the road centerline file rather than by latitude and longitude. As a result, the State's Strategic Highway Safety Plan (SHSP) identified traffic records as an area in need of improvement. The Mid-Ohio Regional Planning Commission (MORPC) took up the challenge to improve data collection by proposing an "Interagency Safety Partner Program" that would inform law enforcement of the need for high quality crash data and explain how these data are used to identify multidisciplinary transportation safety countermeasures.
MORPC partnered with local engineers, the Safe Communities program, the municipal court, and City of Columbus police to provide educational information regarding the current crash reporting process and discuss the balance between the high demands of reporting and the limited resources dedicated to it. Workshops were held with those groups to provide practical examples of work products that utilize crash statistics, which helped officers understand why information in crash reports is crucial for improving transportation safety. The RPC also explained how road safety improvements would reduce traffic crashes and potentially free up law enforcement resources. One key areas addressed was the lack of accurate crash data with regard to crash locations, crash types, and behavioral issues.
To address this issue on the state level, the Department of Public Safety developed an electronic crash reporting software that is made available for free to every law enforcement agency in Ohio, along with free training on how to use it. Currently about 25 percent of crashes are reported electronically by 150 agencies.
Methodology (Basic)
The data are used to create a list of Ohio's high crash locations which are prioritized for consideration for treatments to reduce crashes, injuries, and fatalities. The methodology used is summarized below:
Figure 5. MORPC's Ranking Steps.
|
MORPC's Ranking Steps 1) Determine top 100 intersections by frequency via GIS; Crash frequency is defined as the total number of crashes occurring at each intersection. Crash Frequency = N where N = total number of crashes at the particular location. Crash severity index gives an indication of the crash severity at each intersection. Obviously, fatal and injury crashes are more severe than property-damage only (PDO) crashes and are weighted accordingly in the following equation: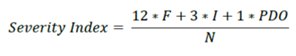
Where, F = total number of fatal crashes at the particular location Crash rate (per million entering vehicles) takes into account the total number of crashes compared to the average traffic volume entering the intersection. 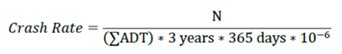
Where, ∑ = the sum of average daily traffic entering the intersection |
Contact
Kerstin Carr
Manager, Active Transportation & Safety
Mid-Ohio Regional Planning Commission
614-233-4163
kcarr@morpc.org
Intermediate Example: High Risk Rural Roads Methodology with Less-than-perfect Data
New Jersey
Description
The High Risk Rural Roads Program (HRRRP) is an initiative of the Highway Safety Improvement Program (HSIP) in direct response to the unique challenges faced by local, rural road owners. Through this program, money is set aside for each state to construct and make operational improvements on high risk rural roads. In New Jersey, utilizing the authorized budget allocations has been difficult. The data necessary to calculate traditional crash rates are not available for local, rural roads, so the State could not determine what segments qualified under this program.
Methodology (Intermediate)
New Jersey has many sources of good information, but it is incomplete for more advanced analysis. For example, there is a standardized crash report form that is compliant with the Model Minimum Uniform Crash Criteria (MMUCC)13 with an average 300,000 reportable crashes per year, but only 60 to 70 percent of the database entries have a map location. The state also has a roadway database (straight line diagrams) that is nearly compliant with the Model Inventory of Roadway Elements (MIRE),14 but most roads below the State level are missing traffic volume data. This makes calculation of traditional crash rates on rural roads difficult.
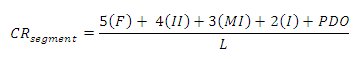
In 2007, the Transportation Safety Resource Center (TSRC) was asked to help brainstorm a way to determine segments that would qualify under the HRRRP funding given the State's data limitations. TSRC developed an initial procedure that used functional class, speed limit, number of lanes, presence of shoulder, and crash locations. The output included segments labeled as high risk based on crash rates. In 2010, that procedure was updated to include crash severity and trending over six years of crash data. The following is the methodology used in New Jersey and approved by the FHWA Division office:
| Functional Class | # Lanes | Speed | Shoulder | Crash Rate | Fatal | Injury | PDO |
|---|---|---|---|---|---|---|---|
| 7 | 2 | 30 | 0 | 16.318 | 1 | 12 | 26 |
| 7 | 2 | 30 | 1 | 9.524 | 0 | 1 | 3 |
| 7 | 2 | 35 | 0 | 7.965 | 0 | 4 | 5 |
| 7 | 2 | 35 | 1 | 5.392 | 0 | 1 | 10 |
| 7 | 2 | 40 | 0 | 9.355 | 0 | 8 | 22 |
| 7 | 2 | 40 | 1 | 7.695 | 0 | 18 | 62 |
| 7 | 2 | 45 | 0 | 7.611 | 2 | 29 | 79 |
| 7 | 2 | 45 | 1 | 11.869 | 2 | 104 | 219 |
Next Steps
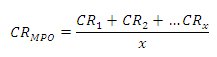
In order to proceed, it was necessary to gain approval from the FHWA Division Office for this new process. Once approved, an output list for each MPO was produced that included all roadway segments in their individual regions that were considered high risk. From there, each MPO was responsible for developing a short list that would be submitted for HRRR funds. An example of this success can be found in the NJTPA case study listed in FHWA's report entitled Implementing the High Risk Rural Roads Program, FHWA-SA-10-012.15
Contact
Transportation Safety Resource Center
Center for Advanced Infrastructure and Transportation
Rutgers, the State University of New Jersey
(732) 445-3919
Advanced Example: Predictive Method Analysis using the Highway Safety Manual16
Missoula, Montana
Background, Issues, and Objectives:
The Russell Street corridor in Missoula, Montana, is 1.5 miles long, connecting residential and industrial uses across a river to the downtown business district. It is an important vehicle and bicycle commuter route. The average daily traffic volume along this route ranges from 20,000 to 25,000 vehicles per day. The corridor has received funding for major geometric improvements. This study was conducted to evaluate the traffic operations and safety impacts of various design alternatives for the entire corridor. Several options were considered as part of the project, including converting the 2-3 lane roadway to a five-lane road, or converting the roadway to a three-lane road. Each case would include a mix of traffic signals and roundabouts at the intersections. This project example demonstrates the quantitative safety analysis of two alternatives on a small portion of the corridor.
Data Requirements:
Segments:
Intersections:
Analysis Methodology Overview:
The crash frequency for each segment and intersection is predicted using an iterative 18-step method in Highway Safety Manual - Chapter 12: Urban/Suburban Arterials. In summary, this method consists of initially calculating multiple- and single-vehicle fatal/injury and property damage only crashes; these values are added to obtain base predicted vehicle crashes. The next step is to adjust the base predicted vehicle crashes with crash modification factors (CMFs) based on the roadway characteristics. Finally, this value is added to predicted bicycle and pedestrian crashes. If a calibration factor was available, or historical data was available to apply the Empirical Bayes method, these two steps would be included. The base equation and a sample calculation using the base equation for prediced average crash frequency is shown below. Sample calculations are shown for the Main Street/3rd Street intersection no-build conditions.
Nbi = Nspf int x (CMF1i x CMF2i x ... x CMF6i x C
Nbi = 12.97 x (0.66 x 0.96 x 0.88 x 1.00 x 0.91 x 1.00) x 1.00 = 6.63 crashes/year
Where:
Nbi = Predicted average crash frequency for an intersection.
Nspf int = Predicted average crash frequency for base conditions (Nspf int = 12.97, see below).
CMF1i - CMF6i = Crash modification factors for left-turn lanes (CMF1i = 0.66), left-turn phasing (CMF2i = 0.96), right-turn lanes (CMF3i = 0.88), right-turn-on-red (CMF4i = 1.00), lighting (CMF5i = 0.91), and red light camera (CMF6i = 1.00).
C = Calibration factor (C = 1.00).
Note, as this is a multi-step process there are multiple equations that are used to calculate Nspf int, these steps are not detailed in this example. A sample equation used in that process for the Main Street/3rd Street intersection no-build condition is illustrated below. Results are shown in Table 6.
N'bimv(FI) = exp(a + b x ln(AADTmaj) + c x ln(AADTmin))
N'bimv(FI) = exp(-13.14 + 1.18 x ln(33,910) + 0.22 x ln(25,790)) = 4.07 crashes/year
Where:
N'bimv(FI) = Multiple vehicle intersection fatal/injury crashes.
a, b, and c = Regression coefficients (-13.14, 1.18, and 0.22 for 4-leg signalized intersections).
AADTmaj = Annual average daily traffic on major road (33,910).
AADTmin = Annual average daily traffic on minor road (25,790).
| Intersection/ Segment2 | No-Build Option: Facility | No-Build Option: AADT4 | No-Build Option: Crashes/ Year | Alternative 1 Option (Mix 3 and 5-Lane): Facility | Alternative 1 Option (Mix 3 and 5-Lane): AADT4 | Alternative 1 Option (Mix 3 and 5-Lane): Crashes/ Year | Alternative 2 Option (5-Lane)3: Facility | Alternative 2 Option (5-Lane)3: AADT4 | Alternative 2 Option (5-Lane)3: Crashes/ Year |
|---|---|---|---|---|---|---|---|---|---|
| Int: Main & Oak | Stop | 35,730/ 3,650 | 3.26 | Roundabout | 35,730/ 3,650 | 1.67 | Signal | 39,080/ 5,280 | 6.93 |
| Seg: Oak to 3rd St. | 3-Lane | 34,580 | 8.3 | 3-Lane | 34,580 | 5.74 | 5-Lane | 38,150 | 9.32 |
| Int: Main & 3rd | Signal | 33,910/ 25,790 | 6.63 | Roundabout | 33,910/ 25,790 | 3.43 | Roundabout | 36,900/ 29,400 | 3.86 |
| Seg: 3rd to 5th | 5-Lane | 33,270 | 5.05 | 5-Lane | 33,270 | 1.51 | 5-Lane | 37,310 | 1.74 |
| Int: Main & 5th | Signal | 33,200/ 5,940 | 6.4 | Roundabout | 33,200/ 5,940 | 3.32 | Roundabout | 37,860/ 7,230 | 3.99 |
| UNCALIBRATED Total Prediction | 29.6 | 15.7 | 25.8 | ||||||
| Change Relative to No-Build | -- | 47% Decrease | 13% Decrease3 | ||||||
| 1 Total Crashes Per Year 2 For the purposes of presenting the results, crashes estimated for minor street intersections along the two segments (Oak St. to 3rd St. and 3rd St. to 5th St.) were added into the segment crash totals. 3 Under the 5-lane scenario, the corridor has more capacity, therefore more regional traffic is drawn to this corridor. The decrease shown is for overall crashes, so a normalized analysis would show a slightly greater decrease. 4 Major Street AADT/Minor Street AADT for intersections |
|||||||||
Results:
13 The MMUCC Guideline presents a model minimum set of uniform data elements for describing a traffic crash. States are encouraged to adopt as many recommended MMUCC data elements as possible when they next update their State's official accident report. Additional information is available at http://www.mmucc.us. [ Return to note 13 ]
14 The MIRE Guideline includes a listing of roadway inventory and traffic elements critical to safety management of all streets and highways across the country. By collecting roadway elements, a highway agency will have a more complete set of the safety and operations components of the streets and highways it owns and maintains. Additional information is available at http://www.mireinfo.org. [ Return to note 14 ]
15 FHWA-SA-10-012 can be accessed at http://safety.fhwa.dot.gov/local_rural/training/fhwasa10012. [ Return to note 15 ]
16 Adapted from "An Introduction to the Highway Safety Manual," AASHTO, 2010. [ Return to note 16 ]

