U.S. Department of Transportation
Federal Highway Administration
1200 New Jersey Avenue, SE
Washington, DC 20590
202-366-4000
| < Previous | Table of Contents | Next > |
This section summarizes the results of the assessment organized by the four levels of local road safety support: resources and information, training and development, technical assistance, and project implementation. These levels of roads safety support encompass all of the local road safety program functions of State DOTs. This section summarizes the data provided by the 38 States that responded to the questionnaire (see Appendix A for a list of the participating States).
Local agencies typically do not have dedicated transportation safety funds and must compete with other local agencies for Federal or State funds. Many States have developed funding distribution guidelines and use incentives to promote the implementation of local safety projects. However, some States do not make Federal-aid funds available to local agencies for safety improvement projects.
The questionnaire collected information on current funding resources and incentives DOTs use to promote local road safety improvements. States were asked to identify the HSIP, HRRRP, State funds, and other Federal funds spent on local road safety improvement projects in fiscal years 2009, 2010, and 2011. It is possible States participating in the questionnaire did not provide complete information on local road safety improvements paid for by HSIP, other Federal funds and State funds.
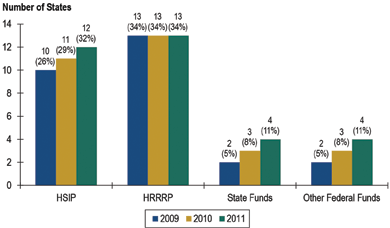
Figure 3.1 shows the number of States that set aside a portion of HSIP, HRRRP, State funds, or other Federal funds for local road safety projects in fiscal years 2009, 2010, or 2011. In 2011, 12 States set aside HSIP funds and 13 States set aside HRRRP funds for local road safety projects (Seven of the 13 States that provided HRRRP funds for local road projects allocated all HRRRP funds to them.). Other Federal funding sources commonly set aside for local road safety projects include Safe Routes to School, Section 154/?164 transfer (MAP-21 continues two penalty transfer programs to encourage States to enact Open Container laws (Section 154) and Repeat Intoxicated Driver laws (Section 164). Any State that does not enact and enforce a conforming open container and repeat intoxicated driver law will be subject to a penalty. Additional information is available on the MAP-21 Guidance page.), and the Railway-Highway Crossing Program (RHCP).
Figure 3.1 Number of States with Local Road Safety Set-Asides
Source: Cambridge Systematics, Inc. analysis of Local Road Safety Assessment Questionnaire responses.
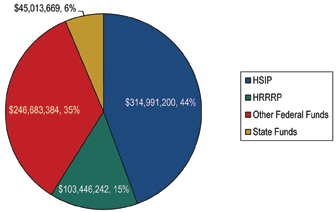
Figure 3.2 shows the percentage of total funds reported for each funding type. Setting aside funds for local road safety improvements is a step in the right direction, but it was important for the assessment to determine if the funds are actually obligated or spent on local roads. Questionnaire participants reported spending $710.1 million of HSIP, HRRRP, other Federal funds, and State funds on local road safety improvements in fiscal years 2009, 2010, and 2011. The HSIP-funded 44 percent ($315.0 million) of the safety improvement costs on local roadways while 35 percent ($246.7 million) were supported by other Federal programs such as Safe Routes to School (SRTS), Section 154/?164 Safety Transfer, and RHCP. The HRRRP supported $103.4 million (15 percent) of improvements, and States participating in the assessment reported using $45 million (6 percent) of their own funds on local safety improvements.
Figure 3.2 Total Reported Local Road Safety Spending
FY 2009, 2010, 2011
Source: Cambridge Systematics, Inc. analysis of Local Road Safety Assessment Questionnaire responses.
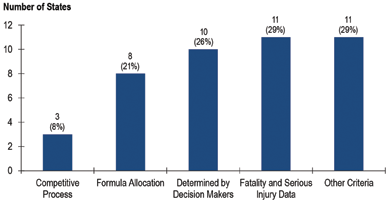
Figure 3.3 shows the criteria used by States to determine funding set-asides. Fatality and serious injury data are used to determine the funding set aside in 11 States (29 percent). In 10 States (26 percent), decision-makers determine the set asides, and a formula allocation is used by 8 States (21 percent). Three States (8 percent) reported varying the proportion set aside for locals year-to-year based on the criteria used in the project selection process. Other criteria reported by participants included alignment with SHSP emphasis areas or percentages based on past practices. More than half of the States reporting set-asides used a combination of one or more of criteria to determine the set-aside.
Figure 3.3 Criteria Used to Select Set-Asides for Safety Funding
Source: Cambridge Systematics, Inc. analysis of Local Road Safety Assessment Questionnaire responses.
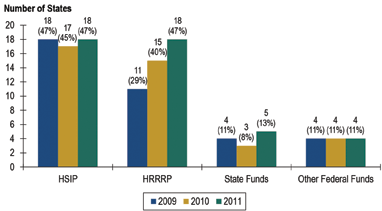
Figure 3.4 shows the number of States that spent HSIP, HRRRP, other Federal funds, or State funds on local road safety improvements in fiscal years 2009, 2010, and 2011. Some States do not set aside funds specifically for local road safety improvements, but they do spend funds on local projects. In such cases, local road safety improvement projects compete directly with projects on State-maintained roadways.
Figure 3.4 Number of States Obligating Funds to Local Safety
FY 2009, 2010, 2011
Source: Cambridge Systematics, Inc. analysis of Local Road Safety Assessment Questionnaire responses.
Analysis of the returned questionnaires show that the HSIP provided the largest portion of funds spent on local road safety projects (All funding referenced in this paragraph refer to States that returned questionnaires. Funding amounts are for the three fiscal years identified in Figure 3.4.). Nineteen States spent HSIP funds on local road safety improvement projects in at least one year. The HSIP funds spent on local safety improvements totaled $315 million. The 38 States responding to the questionnaire spent on average $8.3 million of HSIP funds on local road safety improvements. On average, questionnaire participants spent 9.5 percent of their obligated HSIP funds on local safety improvement projects. The largest percentage of HSIP funds spent on local safety projects was 42.3 percent. These statistical averages include 19 States (50 percent of participants) that reported no HSIP expenditures for local safety improvements.
The average HSIP obligation for the 19 States (50 percent of participants) reporting spending funds on local road safety is 18.9 percent. These States reported spending an average of $16.6 million of HSIP funds on local safety improvements during the three-year period.
State DOTs provide financial incentives to encourage local agencies to develop and implement local road safety projects. Funding incentives cover preliminary engineering, final design, matching funds (for HSIP-eligible projects), road safety audits (RSA), or other local safety support. Many of the other funding incentives identified in the questionnaire relate to training and technical assistance, which is discussed in Sections 3.5 and 3.6. Figure 3.5 shows the number of States providing safety project funding incentives to local agencies.
Figure 3.5 Number of States Providing Local Safety Project Funding Incentives
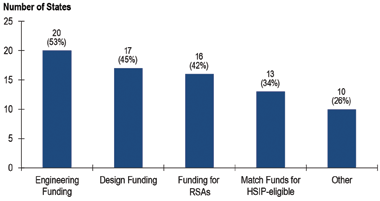
Source: Cambridge Systematics, Inc. analysis of Local Road Safety Assessment Questionnaire responses.
The questionnaire results tell an interesting story about how DOTs are providing financial support to local safety improvement projects. Forty-seven percent (18 States) of States responding to the questionnaire spent HSIP funds on local roads. Forty-seven percent of States also spent HRRRP funds on local roadways during at least one of the years analyzed. Far fewer States used other Federal funds or State funds on local road safety improvements. When other Federal funds were used, in most cases the funds were provided by Safe Routes to School, Section 154/?164 Safety Transfer, and RHCP. Very few States reported using State funds on local road safety improvements.
Crash data are essential for identifying locations with potential for safety improvement or crash types to address with systemic improvements. Often the collection and analysis of the appropriate data is a daunting task for local agencies, many of which lack the necessary data, analytical skills, and/or resources to compete for safety project funding at the statewide level. The questionnaire asked participants to identify the top three challenges limiting the ability to identify, select, and prioritize safety projects on local roads. Lack of exposure data was identified as a top challenge by 27 (71 percent) of the participants. Twenty-nine percent (11 States) cited completeness and accuracy of crash data as a challenge and 15 percent are challenged by a lack of proven data analysis techniques. A small percentage (5 percent) reported data timeliness as an issue or a lack of available data because local crash data are not collected by the State.
Local crash data are so important to the problem identification process that a question was included in the questionnaire to collect more details on the type of local crash data available in most States. Participants were asked to rate the availability of data in their State's traffic records database as one of the following: available for most local roadways, available for some local roadways, available for very few local roadways, or not available.
Table 3.1 summarizes the responses received from 35 of the 38 questionnaires. Fatal crash data are available for most local roads in 35 of the States (100 percent) and serious injury data are available in 32 States (91 percent). Location data are available for most local roadways in 15 States (43 percent), for some local roadways in 8 States (23 percent) and for very few local roadways in 8 States (23 percent). Exposure data were the least available data in 15 States (43 percent). Only 3 States (9 percent) have exposure data for most local roads.
Table 3.1 Availability of Local Crash Data in State Traffic Records Databases
| Data Type | Available for Mosta | Available for Somea | Available for Very Fewa | Not Availablea |
|---|---|---|---|---|
| Fatal Crash Data | 100% (35) | 0% (0) | 0% (0) | 0% (0) |
| Serious Injury Crash Data | 91% (32) | 9% (3) | 0% (0) | 0% (0) |
| Location Data (GIS or Linear Reference) | 43% (15) | 23% (8) | 23% (8) | 11% (4) |
| Exposure Data | 9% (3) | 43% (15) | 43% (15) | 3% (1) |
a Thirty-five of the 38 States participating in the survey answered this question; therefore, percentages were based on a sample of 35 instead of 38.
State DOTs reported using a variety of strategies to mitigate the issues local agencies face in the data collection and analysis process, including the following:
Beyond providing improved State traffic records database systems, many DOTs provide crash data analysis training and/or technical assistance. Sections 3.5 and 3.6 discuss the training and technical assistance offered in more detail. Once local agencies have a means to collect and analyze crash data they are better able to identify projects most needed to improve safety.
States also provide financial incentives to reduce preliminary engineering and final design costs for local agencies. States also provide matching funds to reduce the local agencies' financial burden. Paying for the construction of projects is a large hurdle, but many other steps in the process require time, resources, and attention of local agency staff.
Staff training and development promotes sustainable safety programs in local agencies. Training and development programs give practitioners the skills to conduct safety studies, identify projects and countermeasures, develop projects, evaluate projects, and apply for Federal aid.
State DOTs, LTAPs, MPOs, and universities or professional organizations provide training for local practitioners and decision-makers. Table 3.2 summarizes the number of entities providing training to local agencies on a variety of local road safety topics, including: conducting safety studies (i.e., data analysis and problem identification); project development (i.e., countermeasure identification, benefit/cost analysis and application preparation); and postproject evaluation, Federal regulations, and other topics. DOTs and LTAPs provide the most training and professional development for local safety practitioners. MPOs, universities, and professional organizations conduct or provide training sessions related to data analysis, problem identification, countermeasure identification, and application preparation.
Table 3.2 Entities Providing Local Road Safety Training
| State | LTAP | MPO | Other (i.e., University, POs) | |
|---|---|---|---|---|
| Data Analysis | 55% (21) | 29% (11) | 18% (7) | 18% (7) |
| Problem Identification | 58% (22) | 40% (15) | 16% (6) | 13% (5) |
| Countermeasure Identification | 58% (22) | 37% (14) | 13% (5) | 13% (5) |
| Benefit/Cost Analysis | 40% (15) | 8% (3) | 8% (3) | 5% (2) |
| Application Preparation | 50% (19) | 11% (4) | 13% (5) | 5% (2) |
| Project Development | 45% (17) | 16% (6) | 5% (2) | 5% (2) |
| Postproject Evaluation | 32% (12) | 8% (3) | 5% (2) | 5% (2) |
| Federal Regulations/Federal Aid | 55% (21) | 18% (7) | 8% (3) | 5% (2) |
| Other | 11% (4) | 5% (2) | 0% (0) | 3% (1) |
Many DOTs and LTAPs have found success with training local practitioners and providing them the tools to improve road safety. This approach is most practical with local agencies with the resources to hire staff to conduct the activities as one of their primary job responsibilities. However several questionnaire participants found the high staff turnover rates at local agencies a major challenge in training local practitioners. Due to high turnover rates and limited staff it is more productive for the some DOTs to provide technical assistance than it is to train them to independently administer their safety program.
For the purposes of this study, technical assistance involves conducting an activity on behalf of a local agency, while training teaches the practitioner the process of conducting the work. Table 3.3 summarizes the number of entities providing technical assistance to local agencies on a variety of topics, including: conducting safety studies (i.e., data analysis and problem identification), project development (i.e., countermeasure identification, benefit/cost analysis, and application preparation), postproject evaluation, Federal regulations, and other topics. Questionnaire participants also were asked to report if any local agencies conduct these activities in house or provide support to other smaller local agencies. The most common technical assistance States provided to local agencies is data analysis (76 percent), problem identification (71 percent), and countermeasure identification (71 percent).
Table 3.3 Entities Providing Local Road Safety Technical Assistance
| State | LTAP | MPO | Locals | |
|---|---|---|---|---|
| Data Analysis | 76% (29) | 24% (9) | 26% (10) | 37% (14) |
| Problem Identification | 71% (27) | 21% (8) | 21% (8) | 37% (14) |
| Countermeasure Identification | 71% (27) | 21% (8) | 18% (7) | 37% (14) |
| Cost/Benefit Analysis | 61% (23) | 13% (5) | 8% (3) | 24% (9) |
| Application Preparation | 55% (21) | 13% (5) | 13% (5) | 34% (13) |
| Project Development | 61% (23) | 16% (6) | 16% (6) | 32% (12) |
| Postproject Evaluation | 58% (22) | 13% (5) | 5% (2) | 24% (9) |
| Other | 11% (4) | 3% (1) | 0% (0) | 0% (0) |
Identifying systemic safety improvements for local implementation is a commonly reported State DOT practice. The Nebraska and Ohio Sign and Curve Program case studies in Section 4.3 illustrate systemic safety improvement programs some States use to identify and improve local roadway safety.
DOTs also provide Road Safety Audit (RSA) programs to help local agencies identify projects. Of the 38 States responding to the questionnaire, 16 States (42 percent) provide RSAs to assist local agencies in the project identification process.
Local agencies relying on DOTs, LTAPs, or MPOs for technical assistance get the most out of technical assistance if it is sustained over long periods of time. This means DOT resources are needed to sustain a technical assistance program over the long haul.
The size and expertise of local agency staff varies among agencies. Smaller agencies may not have the resources or expertise necessary to apply for safety funding and administer the process to completion. The questionnaire responses below discuss the support DOTs provide local agencies in the project administration and delivery process.
Table 3.4 summarizes the entity or unit responsible for developing local safety project selection criteria, reviewing project applications, and providing stewardship and oversight on local safety projects. DOT Divisions of Local Aid provide overall administrative support to all local road projects, including safety projects. In many States, the DOT Traffic and Safety office or unit develops local project selection criteria, reviews project applications, and provides stewardship and oversight. However, it appears in as many cases, stewardship and oversight are provided at the DOT district level. Other entities, such as LTAPs housed in State DOTs provide these services in a few cases (three States).
Table 3.4 Entity or Unit Providing Local Safety Support
| Division of Local Aid |
DOT Traffic and Safety |
DOT District Offices |
Other (i.e., LTAP in the DOT) |
|
|---|---|---|---|---|
| Develop Local Project Selection Criteria | 18% (7) | 55% (21) | 11% (4) | 8% (3) |
| Review Project Application | 21% (8) | 61% (23) | 24% (9) | 8% (3) |
| Provide Stewardship and Oversight | 21% (8) | 50% (19) | 45% (17) | 8% (3) |
Local safety project selection is handled a number of ways depending on the organization of the DOT local safety program. Figure 3.6 summarizes some of the methods for project selection identified in the questionnaire responses (States were allowed to report multiple methods.). A competitive application process with technical criteria is used by 23 States. Twenty-two States select projects based on their relevance to the State's SHSP. With the passage of the MAP-21 legislation, States are no longer required to produce an annual Five Percent Report. However, 12 States reported using the report as a selection method for local road safety projects. Nine States have a DOT Safety Advisory Committee to select local safety projects and two States select projects based on direct apportionment of funds or a legislative mandate. Ten States reported the use of other methods, including: hazard index rating formula for railroad crossings; needs identified through RSAs; and other multidisciplinary committees responsible for project selection.
Figure 3.6 Methods for Local Safety Project Selection
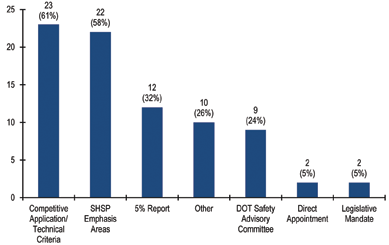
Source: Cambridge Systematics, Inc. analysis of Local Road Safety Assessment Questionnaire responses.
The most common challenge mentioned in recent literature, the questionnaire responses, and interviews was the burdensome process required to receive Federal-aid funds. Respondents suggested DOTs develop solutions to streamline the Federal-aid process for local agencies. All parties involved benefit from the most efficient project administration process. State DOTs use valuable resources to assist with the administrative process and local agency personnel expend time and resources preparing project documentation and support. State DOTs are using a range of strategies to shorten the time to implement local safety projects by reducing paperwork, coordinating the administration of multiple projects in a single process, and streamlining the application process for HSIP funds. One of the purposes of the questionnaire was to determine how many States are using these strategies. Table 3.5 shows the number of States using various strategies to streamline the Federal-aid process.
Table 3.5 Number of States Reporting Strategies to Streamline Process
| Strategy to Streamline Process | Number of States | Percentage of Responses |
|---|---|---|
| Identify systemic safety improvements on local roads eligible for funding. | 23 | 61% |
| Group multiple projects to reduce administrative burden. | 19 | 50% |
| Ensure source for local match before projects are selected for implementation. | 17 | 45% |
| Allow agencies to use their own labor and resources to construct small-scale projects. | 15 | 39% |
| Allow programmatic categorical exclusions. | 12 | 32% |
| Complete or contract for safety improvements on local roads. | 11 | 29% |
| Encourage use of programmatic agreements between State and local agencies. | 11 | 29% |
| Allow local agencies to use their own material specifications and design standards for roadways off the national highway system. | 9 | 24% |
| Provide State funds for local safety projects in lieu of Federal-aid highway funds. | 6 | 16% |
| Provide a single application for multiple funding sources. | 6 | 16% |
| Distribute funds to MPOs or local entities to distribute to local agencies. | 5 | 13% |
| Certify a larger local agency to administer projects on behalf of smaller local agencies. | 5 | 13% |
| Establish a blanket contract to perform safety improvements on local roads. | 4 | 11% |
| Pay local contractors directly instead of reimbursing local agencies. | 4 | 11% |
| Use a push-button process to expedite certain projects. | 1 | 3% |
| Other. | 1 | 3% |
It is not clear why some strategies are more commonly used than others. It is possible some States do not use certain strategies because the strategies are not feasible due to organizational constraints or resource issues. Many opportunities to streamline the Federal-aid process require the State to hire additional personnel to assist local agencies with the process.
To assist in completing safety projects, DOTs provide support personnel to local agencies to coordinate project implementation. The extent of this support varies depending on available resources and the State's local road safety program organization. Project administration support may be provided by the DOT, LTAP, or MPO. Table 3.6 shows the types of local road safety personnel support identified in the questionnaire and the number of State DOTs, LTAPs, or MPOs providing project implementation support to local agency staff. Additional forms of administrative personnel support included an RSA Manager and a County Engineer Program representative.
Table 3.6 Agency Providing Local Road Safety Support Personnel
| State DOT | LTAP | MPO | |
|---|---|---|---|
| Support Personnel | 53% (20) | 21% (8) | 18% (7) |
| Local/Off-System Safety Coordinator | 34% (13) | 5% (2) | 8% (3) |
| DOT District/Region Coordinators Responsible for Local Projects | 63% (24) | 0% (0) | 8% (3) |
| Consultant Services for Local Projects | 34% (13) | 5% (2) | 11% (4) |
| Other | 11% (4) | 3% (1) | 0% (0) |
The assessment identified the resources and support mechanisms DOTs provide to address local road safety problems. The results suggest DOTs focus their support on resources and information, training and development, technical assistance, and project implementation depending on resources available and the technical capabilities of their local agencies. Section 4.0 documents noteworthy practices identified through the assessment and follow-up interviews.
| < Previous | Table of Contents | Next > |

