U.S. Department of Transportation
Federal Highway Administration
1200 New Jersey Avenue, SE
Washington, DC 20590
202-366-4000
Best for printing: PDF Version (1,69 MB)
In this issue:
A Message from the FHWA Associate Administrator for Safety, Beth Alicandri
Safety Compass Subscriber Survey: The Results Are In!
Noteworthy Practices in Data Collection and AADT Estimation on Non-Federal Aid System Roads
New Crash Modification Factors Resource
New! Noteworthy Ped/Bike Safety Policies for Local Agencies
Priorities in Roadway Safety Data Guide Helps Agencies Improve Data Through Prioritization
Data-Driven Safety Analysis: Adding A Local Focus in EDC-4
Hot Off the Press: Safety Publications Portfolio
New! Model Rail Grade Crossing Action Plan Now Available!
Safety R&D Builds a Coalition of Partners to Assess Guardrail End Terminal Performance
Springtime Resurfacing? It's Time to Consider a Road Diet
Timing Right for Pedestrian and Bicycle Road Safety Assessment
Vision Zero Gains Momentum Across Nation
2017 National Work Zone Awareness Week "Work Zone Safety is in Your Hands"
Simple Changes on Local Roads = A Big Difference for Ohio's TZD Efforts
Snohomish County Uses High-friction Surface Treatment to Improve Local Road Safety

"Data! Data! Data! I can't make bricks without clay!" Sir Arthur Conan Doyle's famous fictional detective, Sherlock Holmes, serves as a good example to us–we can't form theories or draw conclusions without sufficient data because data is the basic building block of any fact-based analysis.
Data is the basis for some of the most important things that transportation safety professionals do, and it is up to us to find the most effective way to compile and transform facts and figures into information, which is what enables us to identify safety issues and determine the best ways to address them.
But to get to that point, we need to have the right numbers to start with, and we have to have the right level of quality to give us an accurate picture of what's really going on. If you are not sure how to improve your data, or what your priorities should be, you might be interested in reading about our new Priorities in Roadway Safety Data Guide (page 7). We are also preparing to release the new Noteworthy Practices In Data Collection and AADT Estimation in Non-Federal Aid System Roads to share new ideas on how to collect traffic data affordably and to accurately estimate AADT values to perform data-driven safety analysis in support of decision making (page 12). In addition, working in conjunction with the Every Day Counts initiative, we've been helping your peers conduct data-driven safety analyses to improve safety on State and local roads (page 9). We've also been working with our safety partners to collect data that will help them assess the in-service performance of guardrail end terminals (page 12). These are just a few of the initiatives we've been undertaking here in the FHWA Office of Safety that rely on good data and effective data analysis practices to improve safety.
Because we want our communications to be as data-driven as our engineering, earlier this spring we launched a survey to gather data on what readers like and don't like, and based on those results (page 2), we will work to improve the Compass to make it even more enjoyable to and useful for you.
By: Tara McLoughlin, FHWA Office of Safety, and Kayce Snyder, Leidos
On February 14, 2017, the Office of Safety released the Safety Compass Subscriber Survey to gauge readers' perspectives on the newsletter. The survey closed on March 17, 2017.
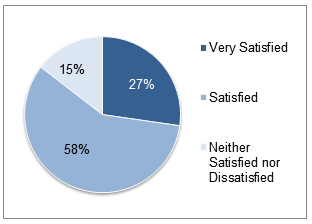
The overwhelming majority of readers (85 percent) indicated that they were either satisfied or very satisfied with the Safety Compass (Figure 1). Readers elaborated on their opinions in the comments section of this question and suggested that we have more articles on specific topics (such as human factors), focus newsletter issues around a special topic or theme, and improve the search function in the online archive. There were differing opinions on the optimal frequency of publication and article length; for example, one reader suggested that information in tri-yearly newsletters might be inherently dated, while another suggested we move to a biannual distribution.
The most popular articles in the Safety Compass were related to safety-related programs, resources, publications from FHWA and its stakeholders, and those on safety-related research. Readers indicated high levels of satisfaction with topics normally covered in the Safety Compass, and some suggested perhaps adding a calendar of upcoming peer exchanges and webinars. Other topics of interest included fleet management, peer-to-peer articles that feature notable practices, and pieces on streamlining the FHWA and other Federal agencies.
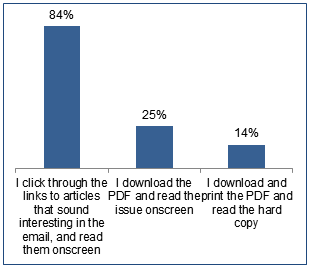
Most respondents (84 percent) stated they click through the links to articles that sound interesting in the email announcement, and then read them on screen (Figure 2). Downloading and printing the hard copy is a method used by only 14 percent of respondents.
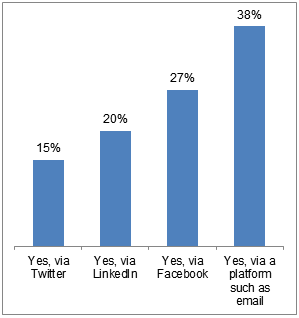
When asked whether they'd be inclined to share articles from the Safety Compass via social media if it were easy to do so, 61 percent indicated that they would. Of those who said they would share articles, nearly 40 percent indicated they would use a platform such as email rather than social media. Of those who would use social media platforms, nearly 30 percent of respondents would share via Facebook. Figure 3 shows a complete breakout.
Just under half of respondents elaborated in this question on what they liked best about the newsletter. Readers thought that the Safety Compass provides timely information and is a good overview of work coming out of the Office of Safety that can be applied to many audiences, including local governments. Readers appreciated the insights into what was happening at FHWA in regard to upcoming issues and policies. A number of readers thought that the Safety Compass is currently at a good length, and is easy to read and browse for topics of interest. One respondent appreciated that "… it provides a snapshot of what's new and current and allows you to get more details if desired!" Another simply exclaimed they liked "The very fact that it exists!"
Less than one-quarter of respondents specified something they did not like about the Compass. Some respondents thought that the newsletter was too long, and those voicing criticisms about the content sometimes found it too technical, too broad, or too generic. One respondent thought the Safety Compass articles came off as "self-promoting"; another didn't like the visual presentation of the document. One reader thought that the Safety Compass should draw from more non-US subjects. One respondent noted that they feel a little overloaded by information, stating, "it's another newsletter competing with many, many other newsletters."
In the summary question, readers shared similar sentiments as seen in other parts of the survey. Users reiterated their interest in broadening and streamlining articles and summaries, and noted that some of the information may be dated by the time it gets published. One respondent suggested grouping topics under subheadings to help readability and organization. Respondents suggested reaching out to other offices throughout FHWA to get a broader set of topics, and one reader suggested using an award system to encourage participation in the Safety Compass. Praise was also included in the final comments, with one user stating, "Keep up the good work, this is a very valuable resource for helping constituents stay in the loop about what is happening and the resources that are available."
We at Safety Compass would like to thank those who took the time to participate in the survey. As always, please contact Tara McLoughlin at tara.mcloughlin@dot.gov if you have any thoughts, ideas, or concerns you'd like to share about the contents of the Safety Compass newsletter.

WHAT?
FHWA and its safety partner, the Roadway Safety Foundation (RSF), are accepting applications for the 2015 National Roadway Safety Awards through June 9, 2017. These biennial awards recognize roadway safety achievements in infrastructure, operational, and program-related improvements.
HOW?
Nominated projects and programs are judged based on their effectiveness, innovation, and efficient use of resources.
WHO?
Eligible applicants include State, local, and tribal governments as well as planning organizations, regional councils, Local Technical Assistance Programs (LTAPs), Tribal Technical Assistance Programs (TTAPs), and universities. The program is available to U.S. nominees only, including U.S. territories and funded operations such as the District of Columbia, Puerto Rico, Guam, and the Mariana Islands.
"Apply! This is a great opportunity to share highway safety. Every life counts. The application process takes a bit of work, but it is definitely worth it. The recognition our agency received was fantastic. Not to mention the time I spent in Washington, DC and getting to know all the other award winners!" — Brent Jennings, Highway Safety Manager Idaho Transportation Department
Additional details, instructions, and application packets are available at http://safety.fhwa.dot.gov/ or www.roadwaysafety.org. Act fast! Nominations are due by June 9, 2017!
By: Ioannis Tsapakis, Texas A&M Transportation Institute, and Stuart Thompson, FHWA Office of Safety
The Highway Safety Improvement Program (HSIP) Final Rule calls for States to collect Model Inventory of Roadway Elements (MIRE) Fundamental Data Elements (FDE) on all public roads, including annual average daily traffic (AADT) on non-Federal-aid system (NFAS) roadways. To meet the new requirements, States must expand the focus of their traffic count programs by targeting both higher functional class roadways and NFAS roads. To do so, transportation agencies need new ideas on how to collect traffic data on NFAS roads affordably and to accurately estimate AADT values to perform data-driven safety analysis and support decision making. In response, the FHWA Office of Safety initiated a project that aims to develop an informational guide on this topic. This guide will include relevant methods and research findings, as well as four noteworthy practices, summarized as follows:
To reduce data collection costs, enhance safety analysis, promote data sharing, and enhance collaboration with other entities, the Delaware Valley Regional Planning Commission (DVRPC) has developed the "Traffic Count Viewer," an interactive web platform that provides public access to traffic data. DVRPC gathers different types of short-duration counts, cleans and processes the data, and stores it in a regional database. The Traffic Count Viewer communicates with the database, allowing users to view, filter, and download traffic counts. Users can also directly connect to DVRPC's ArcGIS server map services and extract GIS layers, metadata, and traffic data in a tabular format suitable for use in safety analysis. Further, DVRPC provides disaggregated data that reside in its database upon request. DVRPC, transportation engineers, planners, developers, market analysts, and the general public have realized several benefits from this practice:
The new informational guide will discuss these and other benefits, as well as how DVRPC developed the Traffic Count Viewer. The case study also offers lessons and tips for other agencies that may be interested in developing similar data analysis tools.
New York State Department of Transportation (NYSDOT) is a leader in developing partnerships and projects to collect short-duration traffic counts on local roads. Through agreements with local agencies, NYSDOT provides traffic counting equipment in exchange for short-duration traffic counts. Agreements are most commonly made with counties but occasionally with cities and metropolitan planning organizations (MPOs). The agreement stipulates the minimum number of counts local agencies must conduct each year. This number equals or exceeds the breakeven point between the cost of the counters and cost of conducting short-duration traffic counts. The benefits of NYSDOT's partnership agreements include reducing duplicate traffic data collection and costs and providing additional data, traffic equipment, software, training, and support to partnering local agencies.
In addition to ongoing agreements with local agencies, NYSDOT conducted a one-time project to collect short-duration counts on a random sample of local roads not typically counted as part of the traffic data collection program. The agency used random samples from all local roadways in each municipality to develop aggregate statistics for travel on local roadways. The benefits of the random sampling procedure include an increase in the number of short-duration traffic counts as well as more complete and accurate AADT for local roads. Selecting locations randomly also generates an increase in the number of counts on NFAS roads.
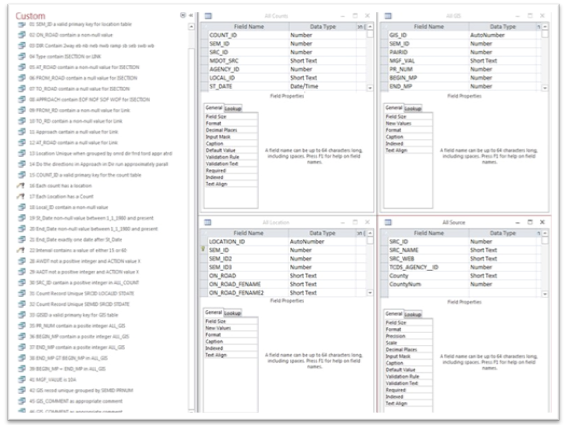
The Southeast Michigan Council of Governments (SEMCOG) has a unique relationship with the local agencies in its region in that the local agencies and the Michigan Department of Transportation (MDOT) collect all traffic data and SEMCOG stores, validates, and analyzes the data. Local agencies conduct two types of short-duration counts: those used to develop AADT values for road segments and those used for special projects. Local agencies send both types of counts to SEMCOG, which then checks and validates the counts. SEMCOG developed 46 validity checks in a Microsoft Office Access database (shown in the figure below) to perform the authentication. Other State and local agencies can develop and apply similar checks to improve the quality and reliability of AADT values and enhance safety analysis with more accurate data inputs.
To improve AADT estimates on the 40,355 road segments in the SEMCOG area, SEMCOG developed a process to estimate AADT on segments meeting certain criteria instead of conducting short-duration counts on each segment. SEMCOG developed an algorithm that works inside of its GIS to search for uncounted segments with nearby counted segments on either side. When the algorithm identifies such a segment, it calculates the weighted average of the two nearby segments and assigns that AADT to the uncounted segment. SEMCOG reports these values as interpolated segments in its traffic data viewer. This process would be time consuming to do manually, so SEMCOG automated the process using Python scripts.
The Virginia Department of Transportation (VDOT) estimates traffic volumes on secondary local roadways using a trip generation method instead of taking short-duration traffic counts. The use of trip generation estimates was an outcome of a review process that aimed to reduce data collection costs and achieve manpower savings by establishing a local secondary count program. As part of this program, VDOT provided guidelines to its staff on how to identify eligible traffic links and generate traffic volume estimates using the trip-generation method. According to this program, regional and district staff are responsible for reviewing candidate segments using aerial photos, determining potential development and roadway connectivity, evaluating roadway eligibility criteria, documenting the trip generation estimate process used, developing estimates, and submitting the estimates to the Central Office, Traffic Engineering Division.
VDOT has realized several benefits from using the trip generation method to estimate traffic volumes. Most benefits involve time and cost savings. Examples include:
The informational guide will be released in late spring 2017. To learn more about these and other benefits, the guide will be available at /rsdp/downloads/fhwasa17036.pdf. For more information and additional resources that can help you improve your AADT data collection and analysis processes as a part of your State's MIRE FDE implementation efforts, please contact Stuart Thompson at stuart.thompson@dot.gov.
By Daniel Carter, UNC Highway Safety Research Center and Karen Scurry, FHWA Office of Safety

Crash modification factors (CMF) are a valuable tool to support data driven safety analysis. CMFs can be used to estimate the expected number of crashes after implementation of given treatment. With more than 5,000 CMFs for more than 800 countermeasures in the CMF Clearinghouse, it can be difficult to identify which CMF is most applicable to your situation. To help with this process, several States have developed State CMF lists. A State CMF list contains pre-selected CMFs that should be used for data-driven safety analysis in that State.
The CMF Clearinghouse currently contains State CMF lists for eight States. If your State is not listed, contact your State Safety Engineer to inquire about the availability of a State CMF list in your State. If your State is considering developing a State CMF list, the Clearinghouse provides a flyer entitled "Ensuring Consistency in Decision Making: Why and How Your State Should Develop a State CMF List," which includes potential questions to consider in the development of a State CMF list. State CMF lists offer a number of benefits, including ensuring statewide consistency in using CMFs, enabling local agencies to leverage the experience of experts within the State, and improving communication related to the application of CMFs.
For questions about the CMF Clearinghouse, please contact Karen Scurry at 609-637-4207 or karen.scurry@dot.gov.
By: Tamara Redmon, FHWA Office of Safety
The FHWA Safety Office has just issued the Noteworthy Local Policies that Support Safe and Complete Pedestrian and Bicycle Networks guide. While much of the focus on bicycle and pedestrian travel is on building new infrastructure, it is important to keep in mind that public policies (including laws, regulations, ordinances, and procedures) play a critical role in shaping how we use and manage both our motorized and our non-motorized transportation systems.
Bicycle and Pedestrian Policy Case Studies
…and many more!
The FHWA developed this guide to provide local and State agencies with tools to complement new infrastructure and program development. Its purpose is twofold: to assist local and State agencies by providing examples for how to institutionalize network-supportive policies and to provide evidence to support policy adoption.
Building on the principles of a complete pedestrian and bicycle network (defined as having cohesion, directness, accessibility, alternatives, safety and security, and comfort), the guide identifies the six common elements of effective policies that help create safe and complete multimodal networks:
The guide also provides information on evaluating a policy framework's strengths, weaknesses, opportunities, and threats to help develop implementation steps for advancing these policies.
For more information about the guide or for help in identifying ways to improve pedestrian and bicycle safety on your roads, please contact Tamara Redmon at tamara.redmon@dot.gov.
By: Robert Scopatz, Tim Harmon, and Meg Bryson, VHB, and Robert Pollack, FHWA Office of Safety
The Priorities in Roadway Safety Data Guide is the capstone of more than 5 years of safety data research aimed at helping State, tribal, and local agencies develop more complete safety data to support advanced safety analysis and decision making. Data availability and quality are key aspects of a successful data-driven safety program; however, it can be daunting for transportation agencies to identify where to begin with data improvement. This guide helps agencies understand their options and provides important considerations for prioritizing their roadway safety data needs.
The guide introduces users to the importance of data and data quality in data-driven safety analysis, as well as the specific data needed to support the Highway Safety Improvement Program (HSIP) and other safety programs and analyses throughout the project development process. The guide provides users with information for prioritizing data elements and methods for coordinating data collection efforts.
The Model Inventory of Roadway Elements (MIRE) and the MIRE Fundamental Data Elements (MIRE FDE) are important resources for States considering improvements to their roadway inventory data. MIRE is a listing of roadway data elements that agencies can use in safety analysis. The MIRE FDE is a subset of the MIRE elements that are the minimum required data needed to conduct advanced safety analysis. Agencies should consider MIRE and other related data sets when determining their data needs for specific analyses and analytic tools.

The guide separates analyses into two categories: network-level analyses, which require a minimum level of data for all sites, and project-level analyses, which require detailed data for a few sites of interest. Network-level analysis can include safety planning (including the SHSP), crash-based analysis for the roadway safety management process, and the systemic approach to safety management.
Once an agency determines what it is planning to analyze, staff can identify the desired data elements needed to support the analysis. Every agency faces resource constraints and must weigh carefully whether to use resources to improve data or to support construction projects, maintenance, or other safety initiatives. Agencies can use data priorities to allocate resources for the most pressing needs. This guide is intended to help agencies prioritize data needs for safety planning and program management as well as in the broader consideration of safety in all highway programs and projects.
Agencies can also use the guide as a resource for identifying desired analysis capabilities. Once these analyses are selected, agencies can examine the corresponding data requirements to identify specific data needs. That list of data needs can then form the basis for prioritization decisions. The prioritization process begins with identifying business needs and conducting a gap analysis of available and required data elements by answering questions about the agency's business and data needs. This may include identifying the intention, use, minimum data level needed for further analysis, additional elements to collect, and information the State needs to answer those questions.
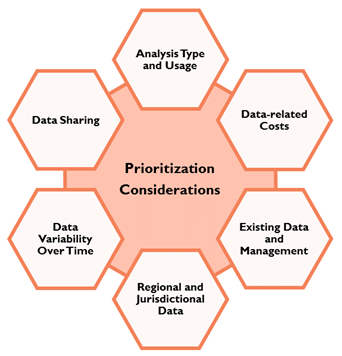
Once States have identified the data elements of interest, they should work with other business offices within the DOT or outside partner agencies to determine their priorities. Agencies can apply the following six considerations to determine the relative priority of each data set or element:
Analysis Type and Usage:
Data-related Costs:
Existing Data and Management:
Regional and Jurisdictional Data:
Data Variability over Time:
Data Sharing:
Each agency may base their prioritization on these factors in varying ways depending on their data needs, resource constraints, and organizational goals. Throughout the prioritization process, States should work with all stakeholders when making decisions to consider their needs.
After prioritization, agencies can begin to develop plans for collecting and maintaining data. Data prioritization is one component of the data life cycle. The considerations in the guide support a data governance framework in which subject matter experts, data providers, data managers, and IT staff work together to define data needs, set data standards, and maintain data for the agency. Investing resources and time into this process will lay the ground work for developing useful, sustainable data systems for the future to support safety analyses.
Finally, the Priorities in Roadway Safety Data Guide is intended to be a practical resource that draws upon preceding reports and guides. State, tribal, and local agencies can use the guide to help identify data needs, conduct gap analyses, establish data priorities, and develop data collection plans. Readers will find useful examples of existing projects in State, tribal, and local agencies as well as relevant resources.
The Priorities in Roadway Safety Data Guide will be released summer 2017 on the Roadway Safety Data Program page. For more information on this product, contact Robert Pollack at robert.pollack@fhwa.gov.
By Jerry Roche, FHWA Office of Safety
By using data-driven safety analysis, (DDSA), States were able to achieve great success in the third round of the Every Day Counts (EDC-3) initiative. More than 40 States applied DDSA tools on one or more projects, and the DDSA team is responding to 145 assistance requests from 44 States. FHWA has conducted 7 peer exchanges involving 35 States and has delivered 35 Highway Safety Manual-related training sessions to 26 States, with 14 more currently scheduled.
But there is still work to do. Fortunately, DDSA has been selected to continue in the fourth round of EDC (EDC-4). In EDC-4, the DDSA team will continue to assist States as they incorporate predictive and systemic analysis into their projects, policies, and procedures. Our goal is to see 47 States demonstrate DDSA by the end of round four (December 2018), and we will offer the same level of training and technical assistance that we did under EDC-3 to help them get there.
For this round, we have enhanced our approach and included an additional focus: helping local agencies.
One of our goals is to identify and increase the number of local agencies with local road safety plans. The plans incorporate DDSA approaches and help the agencies identify which sites on their systems have the most potential for improvement; they act as a road map for targeting safety investments.
One of the agencies that has worked closely with its local government partners is the Minnesota Department of Transportation, which created road safety plans for each of the State's 87 counties and even shared funding with the local agencies to help them implement low-cost countermeasures. This effort has the added benefit of allowing the DOT to expand a culture that embraces a systemic approach to safety countermeasures throughout the State's transportation community. You can watch a video about the project here: https://www.youtube.com/watch?v=jVds3AWWqbk&t=49s.
The DDSA team is also striving to increase the number of local projects incorporating DDSA and raise the percentage of Highway Safety Improvement Program (HSIP) funds that are applied to local roads. HSIP is a data-driven program, and DDSA tools can help agencies to quantify the expected safety impact of design decisions so they can generate benefit/cost ratios with confidence and better compete for funding. An example of this is a recently completed effort in Burlington County, New Jersey. County officials, with assistance from the Delaware Valley Regional Planning Commission, the New Jersey Department of Transportation, and the FHWA performed a predictive safety analysis for potential intersection improvement alternatives. This support made it possible for the county to acquire HSIP funding to construct a modern roundabout. View a video of the story here: https://www.youtube.com/watch?v=cHv086TQ2LI&t=9s.
Your colleagues in the Office of Safety have been busy this year! Check out our newest products (released between January 1 and April 30, 2017)!
Systemic Safety
Road Diets:
Highway-Railway Grade Crossing:
Data and Analysis:
Model Minimum Uniform Crash Criteria
Pedestrian and Bicycle Safety:
Roadway Departure
Roadway Safety Data Program:
Data Driven Safety Analysis
Planning
By: Kelly Morton, FHWA Office of Safety
Development of State highway-railway grade crossing action plans was initially required by Section 202 of the Rail Safety Improvement Act of 2008, Public Law 110-432, Division A, for 10 States with the highest number of highway-railway grade crossing collisions over a specific 3-year period. Links to these 10 State action plans can be found on the Railway-Highway Crossings (Section 130) Program (RHCP) website. The National Transportation Safety Board then further recommended the FHWA and FRA develop the model grade crossing action plan for all States interested in producing a State action plan. Section 11401 of the Fixing America's Surface Transportation (FAST) Act further required the development of the model grade crossing action plan, and now also requires all States to develop new or update existing State action plans and submit them to FRA.
As a result, the FHWA Office of Safety recently partnered with the Federal Railroad Administration (FRA) to publish a new Highway-Railway Grade Crossing Action Plan and Project Prioritization Noteworthy Practices Guide. This guide provides a model State action plan for rail crossing safety and offers tools and resources to help States identify specific solutions for improving safety at crossings. Designed for States that wish to update existing State action plans or develop a new State action plan, the guide includes several best practices employed by transportation agencies in administering Federal and State highway-railway grade crossings protection programs. It also addresses high-risk and blocked crossings.
The guide is available from the FRA eLibrary as well as the newly updated RHCP website, which features new information and resources. Please contact Kelly Morton at kelly.morton@dot.gov for additional information about the guide or for questions about your State's highway-railway grade crossing action plan.
By: Ana Maria Eigan, FHWA Office of Safety R&D
This article describes how the effort started, its objectives, the steps taken to achieve objectives, what is happening now, and what is next.
In 2015, FHWA undertook The Prospective In-Service Performance Evaluation (ISPE) of Guardrail End Terminals (GETs), as one part of a multi-pronged coordinated FHWA response to address concerns related to the design, installation, and performance of GETs.
The Prospective ISPE of GETs sought to:
 The success of the ISPE of GETs has been dependent upon partnerships between Office of Safety Research and Development with Office of Safety, the Resource Center, National Highway Traffic Safety Administration (NHTSA) Special Crash Investigations (SCI) Team, the Division Offices and the State departments of transportation (DOT).
At the start of the ISPE of GETs, the research plan was clear, but how it would actually be implemented in each State was not as certain. Each State had concerns and preferences that needed to be addressed individually in order to successfully mover forward. It became clear early on that a flexible approach that relied on mutually beneficial partnerships with a variety of stakeholders would be essential to completing this study.

Developing and sustaining relationships was a crucial element in the success of the ISPE of GETs. Although cooperation had been established at the highest Federal and State levels, the working level relationships were yet to be cultivated with the California, Massachusetts, Missouri, and Pennsylvania DOTs. The relationships relied not only on headquarters and division alliances but on division and State DOT relationships. These alliances would prove crucial in gaining the commitment of maintenance data collection support, as well as allowing the NHTSA SCI Teams to participate.

Effectively, all entities learned to work as one team to develop the ISPE. In one State, FHWA would be responsible for gaining the cooperation of two unrelated agencies. The relationships did not end at the point of agreeing to start data collection. Instead, the State agency provided guidance to FHWA, allowing data collection to be tailored to State legal/liability concerns. This would govern the on-going maintenance response, as these forces would form part of the data collection teams, responsible for data sharing.

Constructing a viable data collection framework relied upon relationships. In this step, key partners were identified, as well as the extent of their involvement in data collection. These included State agency officials and in some States law enforcement officials. Each State agency determined the means by which FHWA would interact with personnel in the State, either relying on existing partnerships or as facilitators of new relationships that included FHWA. This helped establish notification plans that allowed NHTSA SCI, the ISPE of GETs crash investigation partner, to arrive on-scene before clean up and repair had occurred in order to collect timely data.
Developing and conducting training underpinned the guidance and cooperation received from State agencies. FHWA developed and provided training at a site chosen by the study partner or at the Federal Outdoor Impact Laboratory (FOIL) for any partner agency that wanted this support. In some cases, refresher training was also requested as partners brought on new personnel to help with data collection.
Some of the Keys to Success include:
What is happening now in the ISPE of GETs? As we enter the second year of data collection, the team is compiling lessons learned, documenting progress through outreach and publications, and planning for how to use the lessons learned from this study to provide States with additional information they need to independently conduct ISPEs.
If you are interested in supporting this effort or obtaining more information, please contact Ana Maria Eigen at ana.eigen@dot.gov or 202-493-3168.
By: Becky Crowe, FHWA Office of Safety
Ice, Ice, Maybe? Low temperatures and ice on roadways this winter may have caused pavement deterioration, and many roadways will require resurfacing during the spring season. If your roads fit this description, consider incorporating a Road Diet, or roadway reconfiguration, with your regularly scheduled spring maintenance as a method to improve safety and accommodate bicyclists. To assist transportation stakeholders, the FHWA recently developed and released a new workbook, "Incorporating On-Road Bicycle Networks into Resurfacing Projects," that outlines how Road Diets, a proven safety countermeasure, can be used during resurfacing to provide bicycle accommodations.
There are a variety of reasons for including bicycle facilities into your projects. Well-designed, interconnected bicycle transportation facilities allow bicyclists to safely and conveniently get to jobs, schools, and essential services and make bicycling for transportation a viable choice for a broad range of people. Adding bicycle facilities can improve the safety and comfort of bicycling on a roadway, particularly for less experienced riders. Both bicyclists to safely and conveniently get to jobs, schools, and essential services and make bicycling for transportation a viable choice for a broad range of narrowing and reconfiguring can increase the overall safety and comfort of a roadway for both bicyclists and pedestrians without negatively impacting vehicular operation.
Furthermore, a Road Diet can also lower speeds and reduce pedestrian crossing distances, which can result in fewer pedestrian crashes. Last but not least, incorporating bicycle facilities into a resurfacing project can save your agency thousands in construction costs because it is more cost effective than providing the same facility as a standalone project. In terms of saving, a four-lane to three-lane conversion with bike lanes costs approximately $100,000 per mile with no resurfacing versus $36,000 per mile with full resurfacing. Installing a Road Diet as part of a scheduled resurfacing project could save an agency thousands.
To discover more and get the full details on project savings associated with a Road Diet, please check out our latest flier, "How Much Does a Road Diet Cost?" For more information about Road Diets, please contact Becky Crowe at rebecca.crowe@dot.gov.By: Hillary Isebrands, FHWA Resource Center, Luis Melgoza, FHWA NM Division Office, and Caeri Thomas, Mid-Region Council of Governments
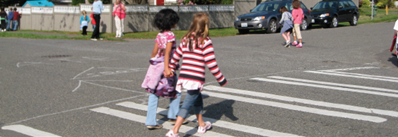
Pedestrian and bicycle safety is important to all communities. Studies have led the Center for Disease Control and Prevention to identify having safe and convenient places to walk as being a key strategy for improving public health.* Likewise, local municipalities are seeking to shift short trips from driving to walking and bicycling as a strategy to address congestion and improve air quality. The safe movement of pedestrians and bicyclists is a key ingredient towards connectivity and livability for all modes of transportation. But when the number of pedestrian and bicycle crashes and crash rates rise to a level that exceeds the levels of those other cities in the Nation, advanced measures must be taken to reverse the trend. Deploying proven practices for bettering pedestrian and bike design and safety provides opportunities both to improve infrastructure and to enhance safety for all users.
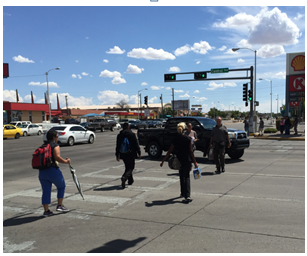
In 2011, the City of Albuquerque, NM became eligible to become a Pedestrian/Bicycle Safety Focus City by the FHWA due to a higher than average annual pedestrian fatality rate per population. With the guidance and technical support of FHWA, the City of Albuquerque and the Mid Regional Council of Governments (MRCOG) undertook numerous actions to increase awareness about pedestrian and bicycle safety issues in the city, conducting "Designing for Pedestrian Safety" workshops, holding briefings with city staff, and performing two Pedestrian and Bicycle Road Safety Assessments (RSA) along Central Avenue, where a significant number of pedestrian crashes occur.
The RSA team conducted one of these reviews at one of the most dangerous intersections for pedestrians in the city: Central Ave. and San Mateo Blvd. This intersection is also an unsafe intersection for drivers and a significant transfer point for transit.
It became apparent while studying and evaluating this intersection that the challenges were big and the timing was important. At the time, the Albuquerque Rapid Transit (ART) bus rapid transit project along Central Avenue was in the design phase. To incorporate the safety countermeasures identified in the RSA recommendations into the project, collaboration and coordination across city departments and among local stakeholders such as MRCOG, New Mexico DOT, and the University of New Mexico would be crucial.
According to the 2016 Central Ave and San Mateo Blvd RSA report, "[The ART] project presents a unique opportunity to improve pedestrian safety. Many of the RSA recommended improvements are planned to be implemented as part of the ART project, and the feasibility of including other recommendations with the ART project or as future projects are being investigated."
Some of the RSA team's recommended safety improvements to the Central Ave. and San Mateo Blvd. intersection included:
Although not all recommendations may be completed with the implementation of ART, this RSA provided an important first step in seeking further opportunities to address safety improvements for all users at this vital intersection.
For more information about the Central Ave and San Mateo Blvd road safety assessment, see http://www.mrcog-nm.gov/latest-news/1394-central-avenue-san-mateo-road-safety-assessment/
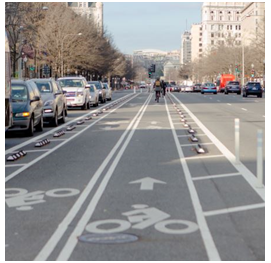
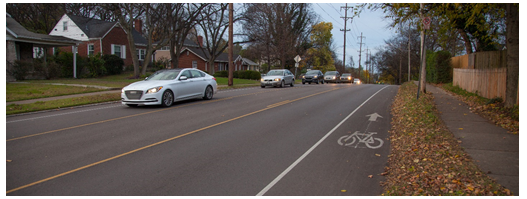
By: Jenn Fox, Vision Zero Network
From the Washington Post to Fortune magazine to Fox News, media outlets across the spectrum have reported similarly on one startling, new statistic—that U.S. traffic fatalities are at the highest level in a decade. These reports, based on National Safety Council statistics, estimate that as many as 40,000 people died in traffic crashes last year, a 14 percent increase over the past 2 years and the largest increase in more than half a century.
Amidst this distressing news, there is also reason for hope as a growing number of Federal, State and local efforts step up their commitment and urgency toward a common goal to ensure safe mobility for all. In addition to the national Road to Zero effort launched last year by the U.S. Department of Transportation and the establishment of Toward Zero Deaths goals in more than 40 States, there is also strong and growing leadership for roadway safety developing in diverse, local communities across the Nation.
As of this writing, more than 20 U.S. cities, from Anchorage, Alaska to Fort Lauderdale, Florida, have committed to Vision Zero—the goal of zero traffic deaths or severe injuries among road users—all in the past 3 years. This includes mayors, police chiefs, public health officials, transportation engineers, and others stepping up not only to set the bold goal of zero, but also to embrace a culture of safety in order to save lives.
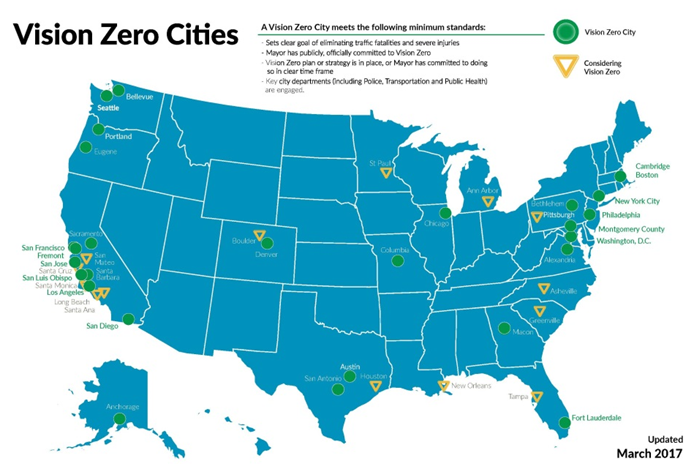
Vision Zero is gaining momentum not only in the U.S. but also around the world. It was started in Sweden 20 years ago, where it successfully halved the number of traffic deaths even as trips increased, and is being embraced in nations as far away as Australia.
Vision Zero differs from a traditional approach to traffic safety in several key ways. First, it holds that traffic deaths and severe injuries are preventable, and that society has an ethical responsibility to anticipate and prevent these tragedies. Second, Vision Zero holds that system designers (including engineers, policymakers, and police) share responsibility with individuals for safety on our roadways. And finally, Vision Zero acknowledges that people will always make mistakes, so it is the role of facility designers to devise systems that ensure that mistakes do not result in fatalities or severe injuries.
Vision Zero is, at its core, a safe systems approach. It elevates the importance of systems – particularly the built environment and policies determining speeds – in encouraging safe behaviors.
Vision Zero relies on data-driven decisionmaking to make the most of limited resources. It also compels a multi-sectoral and collaborative approach, enabling diverse stakeholders to work together toward the common goal of zero, and sets transparent milestones. As history has shown with initiatives to reduce drunk driving and to increase recycling, transparency is essential for ensuring political accountability and changing cultural norms.
To be clear, Vision Zero will not eliminate all crashes, but rather lessen the severity of crashes in order to avoid deaths and severe injuries.
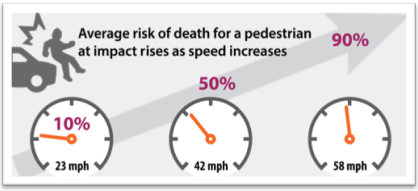
Vision Zero incorporates a variety of approaches, not unlike the traditional "4E's" of traffic safety, or "engineering, enforcement, education and emergency response," to which an increasing number of communities are adding "equity" and "engagement." Notably, Vision Zero elevates the importance of managing speed, acknowledging that speed is such a critical factor in determining the severity of crash-related injuries.
In the United States, nearly one-third of traffic deaths involve excessive speeds. Proven strategies exist to manage this problem, including designing roadways to prioritize safety over speed; setting lower, more appropriate speed limits; and leveraging proven technologies, such as automated speed enforcement, to encourage safe speeds.
The early experiences in New York City, which was the first U.S. city to commit to Vision Zero 3 years ago, are encouraging. The last 3 years have been the safest on record, with traffic fatalities decreasing by 23 percent during that time. Local leaders credit this progress to the city's work in encouraging safer speeds by setting lower speed limits. Thoughtful use of safety cameras, greater investments in redesigning roadways for safety, traffic enforcement focusing on the most dangerous behaviors and locations, and robust public awareness campaigns have also been important contributing factors.
Many additional communities are stepping up their actions based on data-driven analysis, using strategies such as managing speeds, redesigning roadways with greater attention to the needs of people walking and bicycling, and focusing limited enforcement resources on the most dangerous behaviors. These efforts are being complemented with stronger engagement from community members, helping to position traffic safety as an issue deserving of sustained attention. Building on this growing community support for proven strategies to save lives, Vision Zero cities are passing an impressive number of funding and policy measures to advance their safety work.
In closing, it must be acknowledged that this work will be neither quick nor easy. But ask anyone who has lost a loved one in a traffic crash, and the urgency of Vision Zero efforts is undeniable.
For more information, please visit the Vision Zero Network or the FHWA's Toward Zero Deaths web page.
Jenn Fox is an environmental engineer based in San Francisco, California. Ms. Fox works with the Vision Zero Network and cities around the US towards sustainable and equitable community infrastructure.
The Vision Zero Network is a nonprofit project advancing Vision Zero by supporting the life-saving efforts of policymakers, implementers, and community advocates across the U.S. and is a part of the Road to Zero Steering Group.
Please send us your suggestions and sign up for updates at http://visionzeronetwork.org/get-involved/.
By: Martha C. Kapitanov, Office of Operations
This year's National Work Zone Awareness Week was held April 3-7, and the kick-off event took place on April 4th at the Randolph/Georgia Avenue Interchange project in Maryland. FHWA joined the American Traffic Safety Services Association, the Federal Motor Carrier Safety Administration, the National Highway Traffic Safety Administration, the Occupational Safety and Health Administration (OSHA), the American Association of State and Highway Transportation Officials, the American Road & Transportation Builders Association, the Associated General Contractors, the Maryland State Highway Administration and other stakeholders to raise work zone safety awareness during the kick-off event.
The 2017 theme Work Zone Safety is in Your Hands reminds us that we have the ability to improve work zone safety by paying greater attention in and around work zones, which will and drive the number of work zone crashes down to zero. In 2015, the most recent year for which we have data, there were 700 traffic-related fatalities in work zones. According to data from the Fatality Analysis Reporting System that was an increase of 5 percent from 2014; when there were 669 work zone fatalities. More than 35,000 people were injured in 2015 as a result of motor vehicle crashes in work zones. This has grown from 31,251 in 2014, an increase of 14 percent. For information on work zone fatalities by year and state, visit: https://www.workzonesafety.org/crash-information/workzone-fatalities/.
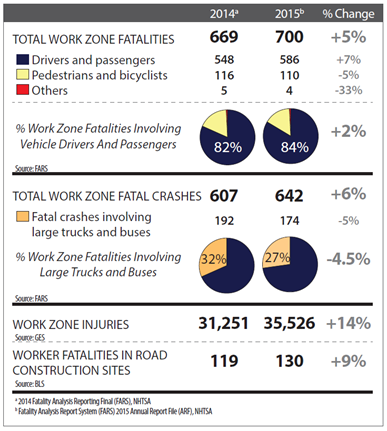
Based on data compiled by the Bureau of Labor Statistics,* there were 130 worker fatalities in and around work zones in 2015, a 9 percent increase from 2014. According to the he BLS Census of Fatal Occupational Injuries, work zones include construction, maintenance, and utility work on a road, street, highway or bridge.
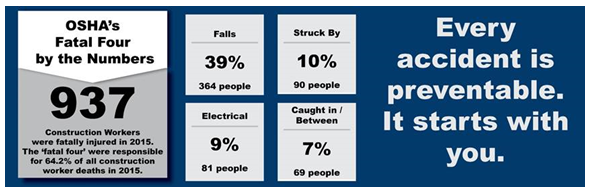
OSHA defines construction work as work for construction, alteration, and/or repair. Examples include residential construction, bridge erection, roadway paving, excavations, demolitions, and large-scale painting jobs. The leading causes of worker deaths on construction sites were falls, followed by struck-by, electrocution, and caught-in/between. These "Fatal Four" hazards were responsible for well over half (64.2 percent) of the construction worker deaths in 2015.
In February, OSHA initiated a "Focus Four Hazards" campaign to raise awareness in the recognition, evaluation, and control of these hazards. Eliminating the Fatal Four could save 602 workers' lives in the United States. every year. For more information on OSHA's Focus Four Campaign visit: https://www.osha.gov/dte/outreach/construction/focus_four/ or contact Nicholas DeJesse at DeJesse.Nicholas@dol.gov.
For more information regarding work zone management training, regulations, resources, and tools, contact Martha Kapitanov at Martha.Kapitanov@dot.gov or visit the FHWA Work Zone Management website at http://www.fhwa.dot.gov/workzones and the National Work Zone Safety Information Clearinghouse at http://www.workzonesafety.org
By Victoria Beale, Ohio LTAP Center Director and Alejandro Chock, Safety Team, ODOT Office of Safety
Of Ohio's 121,342 center lane miles, 41,456 of them, or 34 percent of Ohio's entire roadway system, are the responsibility of Ohio's townships. Why is this important to roadway safety in Ohio? Because if we don't make efforts to help improve safety on the largest percentage of our roadway system, we will never get to Zero Deaths.
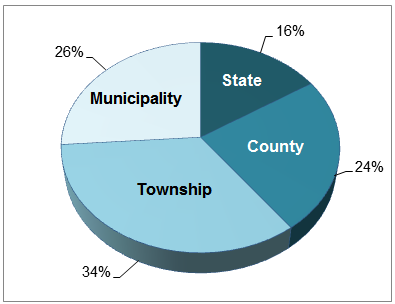
The struggle in Ohio was not whether safety funds would be spent making safety improvements on townships roads–we knew it had to happen to keep Ohio moving Towards Zero Deaths (TZD)–but in determining what type of improvement(s) would be best targeted to township roads. Why? Because even though they account for the largest percentage of Ohio's center lane miles, they also carry the least amount of traffic volume on Ohio's system.
In late 2012, the Ohio Department of Transportation's (ODOT) Office of Safety partnered with Ohio's Local Technical Assistance Program (LTAP), also based at ODOT, to identify a safety countermeasure it felt would meet the safety needs on Ohio's township roads. The selected countermeasure was to target horizontal alignment signs and intersection signs for replacement or to install additional signs where warranted. New or replacement signs were all to meet the current retroreflectivity guidelines, but, just as important, the new signs were to be larger than those currently in place. Increasing sign visibility through larger, more reflective, and additional signage was the plan to get Ohio's township roads moving TZD—and it worked!
Once the countermeasure selection was complete, the next challenge was for the LTAP to create a means for helping the townships execute deployment of the new signs. The result was the Township Sign Grant Program.
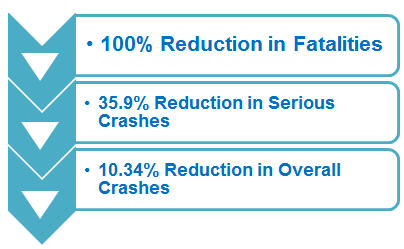
While the program has been in place now for 4 years, ODOT was just recently able to begin analyzing the township roadway crash decreases. ODOT analyzed 24 townships which had at least 12 months of data following the signage installation and found that township crashes dropped from just over 1,443 crashes per year down to 1,294—a reduction of more than 10 percent. Serious injuries decreased from 39 to 25, nearly 36 percent, and, last but certainly not least, township fatalities dropped from 4.67 per year to zero–a 100 percent reduction.
These reductions represent a $32.7 million savings in comprehensive societal costs* between the before and after periods for the 24 townships. A total of $522,924.29 was spent on the townships, resulting in a benefit/cost ratio of 62.59.
The ODOT Office of Safety will continue to monitor post-installation crash data, but anticipates continued crash reductions. Due to these preliminary results, the funding for the Township Sign Grant Program was recently increased from $1 million a year to $2 million for the State's 2018 fiscal year.
The enhanced signage countermeasure for Ohio's township roads is applied through a simple process starting with the township's crash map and crash tree (i.e., a chart that breaks down crashes into subcategories, such as location and type). Townships that were ranked highest for having above average, system-wide crash rates were invited to apply for the grant. These townships were provided copies of their crash map and crash tree and directed to determine their signage needs utilizing the following continuum:
Once the township received the requested signage, the staff worked to install the new or upgraded signs using local forces. Guidance for installation is available both from the recommended signage packet as well as through the Ohio LTAP Center's sign installation smartphone application, which is available for both Apple and Android phones. (For more information, see: http://www.dot.state.oh.us/Divisions/Planning/LocalPrograms/LTAP/Pages/LTAP-Smart-Phone-Applications.aspx).
By addressing signage, one of the simplest and most cost-effective safety countermeasures available Ohio now has a good starting point for improving safety on its township roads. Considering that a 36 in. by 36 in. stop sign averages about $45, Ohio is making a small portion of its Highway Safety Improvement Program (HSIP) funding go a long, long way.
Everyone knows achieving Zero Deaths on our roadways will be much more complex than changing out a sign to improve its visibility, but signs have proven to be an excellent starting point for the 34 percent of Ohio's roadway system with the lowest traffic volumes.
If you are interested in learning more about Ohio's Township Sign Grant Program, please contact Victoria Beale, Ohio LTAP Center Director, at 614-466-3129 or via email at Victoria.beale@dot.ohio.gov.
By: Joseph Cheung, FHWA Office of Safety, and Lisa Bedsole, Leidos
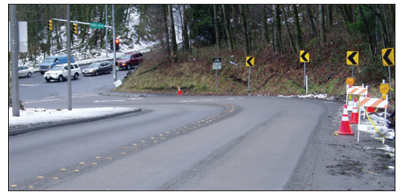
Snohomish County, Washington, has joined a growing number of counties across the Nation that are using an innovative, low-cost technology to enhance traction on road surfaces: high friction surface treatment, or HFST. Funded through Washington State Department of Transportation's (WSDOT) 2016 Innovative Safety Program, Snohomish County received a $1.3 million grant to apply HFST to 15 rural road sections throughout the unincorporated areas of the county and will begin applying these treatments in July 2017.
HFST is a low-cost safety solution that has the potential to produce dramatic crash reductions. It is a treatment that targets problem locations such as curves, ramps, and downgrades where vehicles are at risk of departing the roadway, especially in wet or dark conditions. Spot pavement treatments apply a calcined bauxite aggregate with a highly durable, polish-resistant property on top of a layer of polymer, which locks the aggregate in place and bonds it to the existing road surface. HFST is designed to compensate for excessive speed, distracted driving, or driver error when a vehicle enters a curve by increasing pavement friction to help vehicles stay on the roadway.
This low-cost countermeasure is no stranger to Washington State. In 2015, WSDOT installed HFST to increase traction on two freeway ramps with some of the highest percentages of wet weather-related collisions in the State. Preliminary WSDOT data indicates that, in the first 10 months following the installation, one ramp saw only one wet surface-related crash compared to an average of just under 14 such crashes during the same 10-month window in each of the previous 5 years. In the City of Bellevue in King County, a 2004 installation of HFST—one of the first in the country—on a steep, sharp curve approaching an intersection resulted in a crash reduction of 78 percent.
"Statistics from the City of Bellevue indicate that they have had success with HSFT at an intersection that is often affected by icy weather conditions. Similarly, this grant will enable us to improve safety for our motorists," said Snohomish County Public Works Director Steve Thomsen.
When measured over time, HFST is more cost-effective than traditional paving because it lasts longer. This also means less labor resources are used to fix pavement friction issues, and fewer construction projects reduces the number of construction-zone related accidents. For more information about HFST, or to find out if HFST can help improve safety on your roads, visit /roadway_dept/pavement_friction/high_friction/ or contact Joseph Cheung at joseph.cheung@dot.gov.
International Roadside Safety Conference, June 12-15, 2017, San Francisco, California. The TRB Standing Committee on Roadside Safety Design, in conjunction with Transportation Pooled Fund Program Project No. TPF-5(329), is sponsoring the first ever International Roadside Safety Conference (IRSC). This conference will provide a global forum to explore current roadside safety problems and practices and disseminate research results related to a full range of roadside safety issues, including: administration, planning, design, construction, operations, and maintenance. The theme is "Safer Roads, Saving Lives, & Saving Money." It is also the goal to highlight technological advancements and innovations involving new research as well as proven practices related to the theme. For more information and to register, visit http://tinyurl.com/gm5cgxx.
Joint ITE/CITE Annual Meeting, July 30 August 2, 2017, Toronto, Ontario, Canada. The ITE and CITE annual meeting will showcase the very best transportation has to offer from an international perspective. The theme is "Transportation for All: Putting New Ideas into Practice." It represents the need for a multifaceted approach to transportation, combining the visionary, forward-thinking ideas of tomorrow with a deep dive into the practical "how-to" professionals need to do their job today. Focus sessions will include topics related to Vision Zero, safety and mobility, vulnerable road users, and designing for safety, among many others. For more information or to register, visit http://www.ite.org/annualmeeting/.
2017 Governors Highway Safety Association Annual Meeting, September 16-20, 2017, Louisville, Kentucky. The theme for this year's annual event is "Highway Safety in a New Era" because from a new Administration in Washington, D.C., to new technologies, to new behavioral challenges, we are truly entering a new era in traffic safety. The Governors Highway Safety Association 2017 Annual Meeting will explore these new challenges and opportunities and consider how the highway safety community can best respond to drive down crashes and fatalities. For more information or to register, visit https://tinyurl.com/l6qzhk3.

