U.S. Department of Transportation
Federal Highway Administration
1200 New Jersey Avenue, SE
Washington, DC 20590
202-366-4000
Sign up to have Safety Compass delivered right to your inbox!
Best for printing: PDF Version (2.29 MB)
To view PDF files, you can use the Acrobat® Reader®.
In this issue:
A Message from the FHWA Associate Administrator for Safety, Beth Alicandri
BY THE NUMBERS: SAFETY DATA AND ANALYSIS
Roadway Data Improvement Program Free Technical Assistance Now Available!
EVERY DAY COUNTS (EDC) UPDATE
Maine to Mississippi: STEP Supports Pedestrian Safety through Road Safety Assessments
LEARNING TOGETHER
Diagnosing Safety Issues: New Training Helps Agencies Use Data to Find the Right Solution
New! Training and Videos Now Available for Safety Data and Analysis
SAFETY FOCUS AREA: VULNERABLE ROAD USERS
New Resource Guides Development of Safe, Connected Bikeways
Virginia Strides into the Future with New Pedestrian Safety Action Plan
STATE OF THE PRACTICE: UPDATES FROM STATES AND LOCALITIES
Ground Penetrating Radar Helps Ensure Safe Travel on Alaska's Ice Roads
Montgomery County Pilots Local Road Safety Plan
Localities Embrace Vision Zero
Oklahoma Has Big Plans To Improve Safety Using High Friction Surface Treatment
AWARDS NEWS
RECENT EVENTS2019 National Safety Awards Announced
New Golden Bolt Award Program Recognizes Non-Safety Specialists for Efforts To Save Lives
ANNOUNCEMENTS
2019 National Roadway Safety Awards Call for Nominations
Have You Visited the Safety Culture and the Zero Deaths Vision Web Page Lately?
IHSDM Mid-Year Update Now Available!

I've been looking through previous issues of the Compass in preparation for my last "Message from the AA," and I note with a smile that in our very first issue, in 2006, we included Strategic Highway Safety Plans and local and rural road safety—two topics that remain very relevant today; in fact, this issue features an article on one rural county's experience in developing Local Road Safety Plans on page 19. I've wandered through the messages that I've penned and see additional themes: a focus on sharing what works, an emphasis on working across disciplines, and a desire to make good safety decisions using data-driven techniques.
Taken together, with a dash of improving safety culture and making innovation a safety driver, these are the areas where we need to continue to march ahead to achieve a nation where no one dies on our roadways—a vision increasingly embraced at the local level (p. 21). We need to take an interdisciplinary, strategic approach to safety—one where we consider the needs of all users and road types, use data to inform our decision making and share information with our colleagues. This issue supports that approach with articles on Virginia's new Pedestrian Safety Action Plan (p. 15), the continued relevance of diagnosing safety issues correctly (p. 12), and Roadway Data Improvement Program technical assistance (p. 2).
The task ahead of us is huge and daunting—and I will not be here with you when the final goal is achieved. But I am confident, given what we have learned, and what we are capable of as a community, that we will get there.
Let me close with Mary Oliver, because this is how we can all march ahead:
Pay attention.
Be astonished.
Tell about it.
Thank you for letting me be a part of something that is so much bigger than any of us.
Beth Alicandri will be retiring on May 31 after 30+ years with FHWA. Beth has spent her entire professional career in highway safety—from her graduate fellowship to her tenure as the Associate Administrator for Safety. After retirement, Beth and her husband Mike plan to (buckle up! and) travel across the USA in their 1977 Argosy RV. They plan to go everywhere, talk to everyone, and eat everything.
By: Robert Pollack, FHWA Office of Safety, Tim Harmon and Catherine Chestnutt, VHB; Nancy Lefler, UNC HSRC
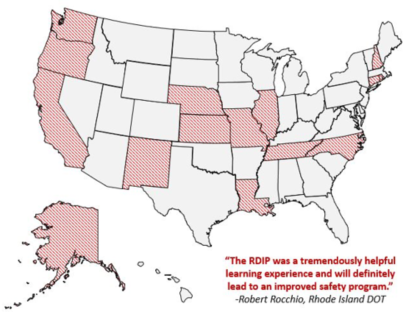
The FHWA Roadway Data Improvement Program (RDIP) offers assistance from national subject matter experts (SME) to States, local roadway owners, and Tribal data stakeholders. The RDIP can provide roadway data training, recommend opportunities for enhancing data and analysis systems, and improve interagency coordination and communication. The RDIP has assisted 15 State agencies to review and improve their roadway data programs since its introduction in 2013 (see map). States may request RDIP assistance from the FHWA Office of Safety at any time.
Although the program has a roadway safety data focus, the RDIP often reviews data sets and procedures related to roadway and intersection inventories, crash data, traffic monitoring and operations data, construction project records, roadway and roadside asset data, data security and accessibility, and data quality management.
The RDIP helps agencies in the following key areas:
Upon request, FHWA will host a meeting to introduce the technical assistance team, identify areas of interest to participating agencies, and request both background information about the State's data systems as well as a roadway data sample. The technical assistance team reviews documentation and conducts an independent data quality assessment (see diagram below). The team also reviews the State's progress toward adopting the MIRE FDE to meet the Highway Safety Improvement Program Final Rule requirements. (Note that requirements include the use of MIRE FDE to conduct performance-based safety analysis on all public roads by September 30, 2026.)
After the initial pre-visit assessment, the SME team travels to the State for a week-long site visit. The first day consists of an interactive workshop including training and noteworthy practices for roadway data collection, use, management, and performance measurement. The site visit also includes two technical transfer sessions with stakeholders to discuss their policies, practices and procedures. The first session focuses on how the State DOT maintains its roadway inventory, and the second session addresses local agency and Tribal practices, including interaction and data sharing with the State. On the final day of the site visit, the SME team presents their findings and makes recommendations on how the State can improve its roadway inventory system.
FHWA and the SME team will submit a post-visit final report to the State. The final report includes a list of recommendations with suggested priority, relative costs, and an estimated timeline the State can use to develop an Action Plan. The SME team also follows up about 6 months after the workshop to monitor progress and offer additional assistance if needed. The RDIP attendees have access to the SMEs throughout the process.
If you would like to learn more, visit the Roadway Safety Data Program page or visit the Technical Assistance Online application to request FREE RDIP technical assistance for your State. For more information on this program, contact Robert Pollack at robert.pollack@dot.gov.
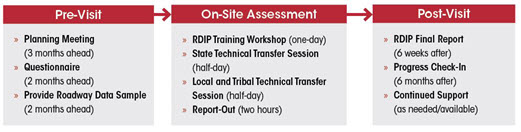 Roadway Data Improvement Program schedule.
 By: Norah Ocel, FHWA Office of Safety

This year, the FHWA is again working with the Roadway Safety Foundation to co-sponsor the 2019 National Roadway Safety Awards Program. This effort honors agencies and organizations in the transportation community that have made significant strides toward improving safety on our Nation's highways in two categories:
Every 2 years, this prestigious awards program recognizes projects that are effective, innovative, and demonstrate efficient use of resources. For more than two decades, this program has shined a spotlight on the practitioners who are the unsung heroes of highway safety.
Selected projects are included in a noteworthy practices guide so they can be replicated nationwide. Award winners are also honored at a ceremony in the fall on Capitol Hill, and receive assistance generating media coverage in their home communities.
Know of a groundbreaking, innovative road safety project or program?
Applications are being accepted through May 31, 2019. Note that only public agencies may serve as lead applicants for an award; however, nonprofits or private entities may cosponsor a submission provided it is in partnership with a public agency.
By: Jerry Roche, FHWA Office of Safety, Jeffrey King, FHWA Arizona Division, and Kerry Wilcoxon, Arizona State Traffic Safety Engineer
Over the 2-year period of the Every Day Counts Round 4 (EDC-4) initiative, the Arizona Data Driven Safety Analysis (DDSA) team, co-chaired by representatives from the Arizona Department of Transportation Traffic Safety Section and Maricopa Association of Governments (MAG), has made great progress improving DDSA capabilities in Arizona. Partnering with State, regional, and local planning and engineering departments—in addition to their State, local, and Tribal law enforcement counterparts—the Arizona DDSA team has made significant progress on three major projects related to improving both the quality of traffic crash data itself and the crash data analysis processes. These projects include:
Individually, MAG has also continued to advance DDSA-based infrastructure improvement projects by implementing its Systems Management and Operations Plan, road safety assessment program, systemic approach to mitigate intersection left-turn crashes, and its regionwide pedestrian and bicycle safety improvements.
Arizona DOT (ADOT) has provided funding through its Highway Safety Improvement Program (HSIP) to assist agencies with implementing the Arizona Traffic and Criminal Software (TraCS) crash reporting platform. ADOT has expanded this opportunity to include funding for equipment such as servers, in-car computers, and scanners on new implementation projects. The Navajo Nation was also awarded funding from the FHWA Tribal Transportation Safety Program to deploy TraCS among its law enforcement personnel, generating significant interest among the remaining 21 Tribal Nations within the State. ADOT expects that in the next year it will see additional progress among all law enforcement agencies moving towards the use of electronic crash reporting, which improves data quality, timeliness, and officer safety.
During EDC-5, the ACIS program was integrated into ADOT and used to conduct regional and statewide frequency-based network screening. ACIS continues to be improved and promoted, with access being granted to regional and local agencies upon request.
The Arizona DDSA team has also helped the State make great progress in its efforts to deploy predictive modeling software to make better use of crash data. Members of the DDSA team, along with other State and tribal representatives, attended the National DDSA Peer Exchange in July 2018, where they gained additional knowledge and ideas related to a wide range of DDSA-related products and best practices. Arizona is proposing to move from frequency-based traffic safety analysis to predictive modeling for both State and local HSIP projects. Following the national peer exchange event, the Arizona DDSA Team—with support from the national DDSA Innovation team—hosted a 2-day local peer exchange. The purpose of this peer exchange was to explore what the transition from frequency to predictive modeling would look like, how it will take place, and what it will mean for traffic safety in Arizona.
The local peer exchange brought together 29 representatives from local and regional transportation agencies throughout the State to discuss the proposed switch with representatives of ADOT's Traffic Safety Section, which conducts frequency analyses and manages the HSIP. Additionally, representatives from the Nevada and New Jersey State DOTs, ADOT, and FHWA contractors involved with AASHTOWare SA deployments participated to provide their experience and technical expertise. Attendees discussed what predictive modeling is and how it can be used to help improve safety analyses, what problems to watch for, and how to implement a statewide predictive modeling program. The peer exchange closed with a 4-hour introductory training session for the AASHTOWare SA program.
ADOT has continued updating and testing the AASHTOWare SA program. State roadway inventory data, including locally operated roads at or above the collector functional classification, have been uploaded into the program, as has crash data for the last 3 years.
Once testing is complete, ADOT will begin rolling out the program results to local and regional partners, examining the results of the SA software with projects completed in the last few years. Assuming the SA tool enhances analysis of crash data and improves ADOT's abilities to make good decisions about safety project funding, Arizona will proceed with its plans to switch from the current system of frequency-based project ranking to one based on predictive modeling. This work has already begun on some State projects but it is anticipated full-scale conversion will take place in the 2021-2022 timeframe.
For more information on the EDC-5 DDSA initiative, or to request technical assistance, please contact Jerry Roche at jerry.roche@dot.gov. For more information about the Arizona DDSA initiative, please contact Jeffrey King at jeffrey.king@dot.gov.
By: Becky Crowe, FHWA Office of Safety
In late fall of 2018, FHWA conducted multiple road safety audits (RSAs) through the Safe Transportation for Every Pedestrian (STEP) program. STEP, an innovation of the Every Day Counts initiative, supported the RSAs, which focused on pedestrian and bicycle safety for various locations in Maine and in Gulfport, Mississippi. The RSA teams evaluated vastly different settings, but many of the pedestrian safety issues were common to roads studied in both States.
RSAs—including those conducted in Maine, Mississippi, and elsewhere—follow a standardized 2-day process: Participants review the objectives of the RSA, discuss crash history in the study area, and conduct an extensive field review of existing conditions. The team observes traffic conditions and behaviors in daylight and low-light conditions. During the STEP RSA events, FHWA representatives introduce participants to a variety of countermeasures for pedestrian safety that they later consider as part of their preliminary recommendations. The RSA teams document their findings and recommendations for local or State officials to consider for improving pedestrian safety.
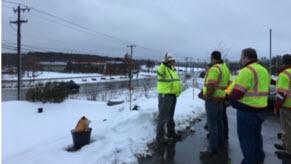
The RSA team, comprised of representatives from Federal, State, and local agencies, selected multiple sites to evaluate in or near Bangor, Maine, and Farmington, Maine. With several feet of snow of the ground, the RSA team visited sites where pedestrian crashes had occurred or where conditions could be improved for bicycle and pedestrian safety. The team identified area-wide issues that affect safe pedestrian and bicycle travel, such as:
The RSA team suggested improvements that can be deployed through policy adjustments, new education programs, and specific projects. These suggestions included:
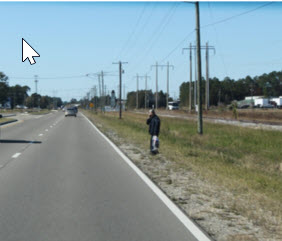
Five miles north of the Gulf of Mexico in sunny Mississippi, the RSA team visited Seaway Road, which is a major east-west, four-lane divided roadway. The team selected the location based on an overall need to enhance conditions for pedestrians and bicyclists, and to review the future Pedestrian Pathway, which is currently under construction.
Despite enhancing pedestrian and bicycle safety and the area's planned enhancements, locational factors continue to pose risks to these vulnerable user groups in Gulfport. Specifically, along Seaway Road the RSA team noticed there were minimal ADA-compliant facilities, and traffic speeds had increased after the road was widened from two to four lanes.
To address these issues, the RSA team proposed that local and State officials review existing and proposed facilities to consider whether they meet the goals of the Mississippi DOT ADA transition plan and to ensure access to all roadway users. The team also suggested additional speed enforcement along the corridor, in conjunction with permanent or temporary speed feedback signs positioned at multiple locations along Seaway Road, to encourage drivers to slow down.
Despite the distance and geographic diversities between Maine and Mississippi, both areas are working to improve pedestrian and bicycle safety and had made efforts to do so prior to the RSA. In 2017 and 2018, the Bangor area hosted forums to identify locations and needed improvements for pedestrian safety. These events led to the implementation of accessible crossings, installation of countermeasures such as road diets and RRFB, and the development of multimodal plans for the region to provide opportunities to consider long-term bicycle and pedestrian safety improvements. The Gulfport Regional Planning Commission and the Mississippi DOT have been working to create more efficient travel by considering the needs of all modes. These efforts have led to the area promoting safer pedestrian and bicycle fatalities in the region and funding transportation alternative programs.
The RSAs in Maine and Mississippi show that, despite the differences in the two areas, States around the country are grappling with the same issues as they try to improve safety for pedestrians and bicyclists. These cities are examples of areas that—like many other cities and counties—have gaps in the sidewalk network and infrequent crosswalks in areas where pedestrians often travel, but they are "STEPping" forward to make improvements.
STEP continues to support RSAs across the United States as part of EDC-5. For more information, visit the STEP Program Page or contact Becky Crowe at rebecca.crowe@dot.gov.
By: Cate Satterfield, FHWA Office of Safety
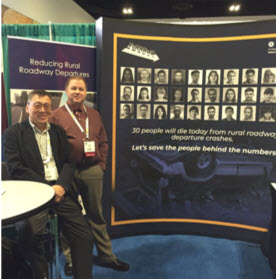
The Every Day Counts round 5 (EDC-5) Focus on Reducing Rural Roadway Departures (FoRRRwd) team has been working to spread the word about this new effort to reduce rural roadway departure crashes, which account for approximately one-third of roadway fatalities across the Nation. The mission is to reduce the potential for serious and fatal roadway departure crashes on all public rural roads by increasing the systemic deployment of proven countermeasures. With "all public roads" being the focus, the team is refining its processes and honing its messages to reach more State, local, Federal and Tribal practitioners and encourage the systemic approach to these crashes. Taking the message on the road, in February, the Resource Center's Dick Albin attended the ATSSA Convention and Traffic Expo in Tampa, FL, where he gave presentations to several committees as well as the general session on the topic of the FoRRRwd initiative. These presentations offered attendees an overview of the initiative and informed them about the ways that FHWA is working with transportation agencies to identify new countermeasures they can deploy to improve rural road safety.
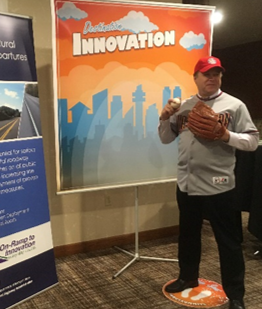
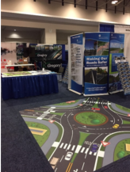
The FoRRRwd booth at the ATSSA Expo also marks the introduction of a new display to an interested audience of roadway infrastructure safety professionals. The new display contains the tagline, "30 people will die today from rural roadway departures. Let's save the people behind the numbers." The team selected this message to communicate the importance and urgency in addressing this problem. "Every group we have spoken to includes survivors of a roadway departure, and we have encouraged them to tell their stories. But we have to remember there are also those who didn't survive, and we want to do everything we can to stop the roadway departures that happen today, tomorrow, and every day after from having deadly results," said Albin.
This new display is available to FHWA staff from the report center upon request and may be displayed at local or regional safety conferences or events to encourage State and local agencies to explore the many countermeasures that can reduce rural roadway departures. A one-page handout specifically about this EDC-5-5 effort is also available, as are several existing resources discussing the systemic process and countermeasures that are appropriate to distribute. Where a smaller display is more appropriate, a roll-up banner featuring some of the countermeasures is also available.
While at the event, Albin also answered questions about the FoRRRwd initiative and provided informational handouts, including baseball-style trading cards that offer a quick description of the use and effectiveness of a series of "All-Star Roadway Departure Counter-measures." The trading cards were so well received, Albin was even asked to autograph one of them!
In addition to the new display, the team also introduced a new identifier for the initiative. This identifier will brand the initiative and improve user recognition of the products and resources developed to promote countermeasures.
Programmatically, the team is advancing progress through its implementation plan, which was finalized in February. The plan outlines a marketing strategy to help the States and other agencies meet the goals for their initiatives based on the current implementation stage and advancement goals of each State as reported to FHWA.
The FoRRRwD initiative identifies five implementration stages for participating States, and each agency must establish its own goals for advancement. Each stage of progression reflects increasing capability with regard to applying the systemic approach when selecting and installing RwD countermeasures as well as progress in developing guidance, policies, and processes to advance the use of rural RwD countermeasures.
Of the 32 States with advancement goals, 5 have ambitiously opted to strive to advance 2 or more steps forward during the current EDC-5 round.
As the FoRRRwd team advances, the following plans are in the works, including:
For more information, visit the Reducing Rural Roadway Departures website or, to get involved, please contact Cate Satterfield at cathy.satterfield@dot.gov or Dick Albin at dick.albin@dot.gov.
By: Abdul Zineddin, FHWA Office of Safety R&D
The Interactive Highway Safety Design Model (IHSDM) – HSM Predictive Method 2018 Public Release Update (version 14.1.0) is now available for download free of charge.
What's new in the IHSDM 2018 Release Update?
How do I obtain the 2018 Release Update?
Registered IHSDM users: Visit the IHSDM website and use your IHSDM username and previously assigned password to access and download this new release. If you currently have an earlier version of IHSDM installed, a "call home" feature will remind you to update to the latest version the next time you use the software.
New IHSDM users: Simply visit the "Download Registration" page and follow the instructions.
Whom do I contact for IHSDM technical support?
Email the IHSDM Technical Support team or call the IHSDM Help Line at (202) 493-3407.
An IHSDM Resource List that provides a summary of all IHSDM-related resources is also available. The IHSDM website includes information related to the IHSDM User Group, case studies / user applications, past webinar materials, and frequently asked questions.
By: Becky Crowe, FHWA Office of Safety
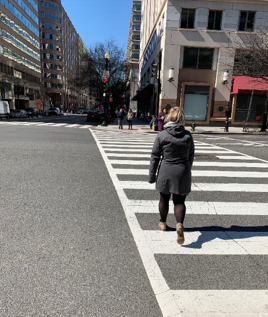
Have you ever wanted to be more visible when crossing the street? Or get a step ahead before vehicles can cross or turn? Well, you can with a proven safety countermeasure: the Leading Pedestrian Interval (LPI).
Under the FHWA Safe Transportation for Every Pedestrian (STEP) program, a round 5 innovation of the Every Day Counts initiative (EDC-5), FHWA is working closely with State and local agencies to advance LPI across the Nation. LPI is a signal phase allowing pedestrians to begin walking—usually 3 to 5 seconds—before vehicles receive a green signal to turn left or right. LPIs provide pedestrians with a WALK signal and exclusive use of the crosswalk at the beginning of the pedestrian phase before advancing to the green phase for conflicting vehicle movements. LPIs allow pedestrians to establish a presence and increase their visibility in the crosswalk before the signal change, leading to fewer pedestrian-vehicle conflicts and increased motorist yielding.1 These treatments have resulted in reductions in vehicle collisions with people walking of up to 60 percent.2 Additionally, LPIs have a relatively low cost and cause only a slight addition in vehicle delay.
Cities have implemented LPIs to support Vision Zero initiatives to eliminate traffic deaths and serious injuries. The District Department of Transportation (DDOT) began its first phases of LPI implementation throughout Washington, DC in 2006. Employing LPIs continued incrementally following the introduction of the Pedestrian Master Plan 2009. DDOT introduced LPIs to more than 90 intersections throughout Washington DC in 2018.
"Reducing the chances of a serious injury is a high priority for Vision Zero and improves the livability of a city," says George Branyan, the Active Transportation Branch Manager for DDOT Planning and Sustainability Division. Washington, DC now has LPIs installed in 312 out of the city's approximately 1,650 signalized intersections as of February 2019. Deployment of LPIs at more intersections throughout the city is set to continue as the District pushes for zero traffic fatalities by 2024.
DDOT developed detailed criteria for evaluating LPIs at signalized intersections based on guidelines used in other jurisdictions, including the cities of Toronto, San Francisco, Portland, and Los Angeles, as well as the State of Florida. DDOT uses the criteria to prioritize LPI implementation and capture the magnitude and severity of pedestrian-vehicle interactions at signalized intersections. The criteria also help the agency to identify locations where physical characteristics of the intersection could make those interactions more dangerous, such as areas with:3
"Set criteria and the prioritization guideline allow for a proactive, optimized, and citywide signal deployment," says Wasim Raja, P.E., Associate Director of DDOT Traffic Engineering and Signals Division. Along with the guidelines, the DDOT created the LPI Selection Guidelines Form to assist staff in evaluating an intersection and to facilitate quick and intuitive data entry. An LPI is recommended if at least seven of the criteria are satisfied. Further analysis is required when the intersection falls between four and six satisfied criteria, and an LPI is not recommended with three or fewer satisfied criteria.4 With updated traffic controller hardware, the streamlined evaluation process allows for a traffic signal change in 30 to 60 minutes following an LPI implementation decision.
LPIs have become a tremendous safety benefit to intersections throughout Washington, DC, and their value has been proven through before-and-after evaluations.
"Observational studies are strong evidence. Changes can be seen right away from pedestrian behavior," says Branyan. Raja agrees, noting that "LPIs are a bonus, even if you are not aware they are present. You can jump start your walking journey ahead of the vehicle journey."
DDOT plans to evaluate intersections with LPIs through an annual network-wide pedestrian crash history analysis to track their effectiveness. As LPI expansion within the District is set to continue, DDOT is hopeful that the countermeasure will reduce tension between modes and help eliminate traffic fatalities and serious injuries.
For additional information about LPIs, or to learn more about how STEP can help improve pedestrian safety in your jurisdiction, please contact Becky Crowe at rebecca.crowe@dot.gov.
By: Karen Scurry, FHWA Office of Safety, and Joseph Jones, Leidos
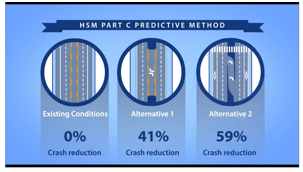
Roadway safety is not a one-size-fits-all proposition. Because each location along a highway brings with it a set of variables unique to that area, effective solutions in one setting may not necessarily work at another similar location. For example, while speed management countermeasures may be appropriate at one horizontal curve experiencing high rates of roadway departure, installing high friction surface treatment may be the better choice at a curve experiencing similar crash rates and types. Only through properly gathering, reviewing, and analyzing crash and field data specific to a location can practitioners properly select cost-effective countermeasures and be confident in the solutions.
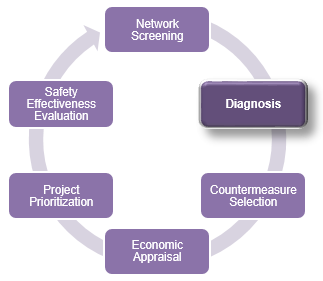
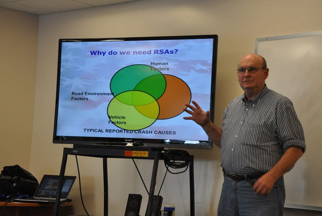
However, upon identifying locations for potential safety improvement through network screening, agencies often jump directly to countermeasure selection without really understanding the root cause of the problem, skipping over an important step in the six-step road safety management process outlined in the Highway Safety Manual (see diagram). There are a number of reasons for this, but chief among them is the tendency to rely upon certain low-cost countermeasures that have proven their worth over time. There can be a natural tendency to jump straight to these solutions without looking more deeply into cause.
The improper use of countermeasures not only fails to solve the problem, but also minimizes the effectiveness of limited funding. Only after safety practitioners have performed crash data analysis, reviewed supporting documentation, and assessed actual field conditions to identify contributing factors can they truly understand a location's particular safety issue well enough to arrive at an appropriate solution.
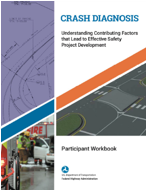
To help agencies fully understand and embrace the crash diagnostic process, FHWA has developed a new course entitled "Crash Diagnosis: Understanding Contributing Factors that Lead to Effective Safety Project Development." This 6-hour, in-person training course will help State, local, and consultant practitioners who develop safety projects accurately diagnose safety problems, select appropriate countermeasures, and develop good safety projects.
Through a series of eight modules, students will learn how to use each component of diagnosis to better plan and develop effective safety projects. Students will learn about:
The final module of the course includes a hands-on exercise in which the participants apply their newly acquired diagnostic knowledge to a real-world situation and propose countermeasures based on their findings.
A detailed participant workbook contains interactive exercises in which participants experience each step of the process from the perspective of an agency that solved the actual problem that is featured. The workbook also contains thoughtful questions for consideration to help participants prepare for group discussions and exercises and additional resources for practitioners who wish to delve more deeply into specific aspects of the diagnostic process.
Upon completion of the course, students will be able to:
The course is available for FREE delivery upon request, and the materials can be made available to State DOTs or LTAP centers for delivery to interested agency staff. If you are interested in learning more about this course, or to request training, please contact Karen Scurry at karen.scurry@dot.gov.
By: Esther Strawder, FHWA Office of Safety
The Roadway Safety Data Program (RSDP) kicked off in 2012 in response to the need among State and local agencies for support and guidance in advancing their safety data and analysis and to help fulfill the FHWA strategic goal of reducing fatalities and serious injury crashes. The Fixing America's Surface Transportation (FAST) Act reinforces the data-driven approach to safety by encouraging States to develop safety data systems sufficient to guide the Highway Safety Improvement Program (HSIP) and Strategic Highway Safety Plan (SHSP) processes, including conducting analyses and evaluations.
To support the goal of advancing agency practices, FHWA has developed several National Highway Institute (NHI) courses to address the more advanced scientific techniques and methodologies introduced in the Highway Safety Manual (HSM). These courses cover a range of areas such as network screening, diagnosis, countermeasure selection, evaluation, and predictive tool usage on two-lane rural roads, intersections, multilane highways, and freeways in an instructor-led delivery format.
One of the most important precursors to successfully analyzing safety data is collecting and managing it. FHWA has developed several training courses available online to assist with doing just that. The Fundamental Safety Data and Analysis web-based training course is available free of charge at NHI (380122 a-d).
Instructional videos also provide an easily accessible, on-demand format to train State and local personnel in planning, design, and safety analysis with a greater focus on integrating safety data and using alternative analysis methods in project development.
FHWA recently posted two new safety data and analysis instructional videos to its YouTube channel. These videos, "Safety Data and Analysis: The Predictive Method" video and the "Safety Data and Analysis: Observed, Predicted and Expected Crashes" focus on the predictive method and the difference between observed, predicted, and expected crashes. These two videos are part of a series that will give viewers a detailed look at some of the more challenging aspects of safety analysis. View both videos to learn more about these fundamental aspects of data-driven safety analysis.
For more information about the RSDP initiative or to access additional resources, please visit the DDSA web page or contact Esther Strawder at esther.strawder@dot.gov.
By: Tamara Redmon, FHWA Office of Safety
FHWA Office of Safety's Bikeway Selection Guide is now available! The guide helps practitioners make informed decisions in the selection of bikeway types, building upon FHWA's support for design flexibility and connected, safe, and comfortable bicycle networks. Referencing existing national resources, the bikeway selection process balances trade-offs by identifying the desired bikeway type, assessing and refining potential options, and evaluating feasibility. This process aims to deliver high-quality multimodal projects that improve safety for everyone and meet the transportation needs of people, regardless of age and ability.
Bikeway selection is a context-sensitive decision that involves a planning- and engineering-based analytical process. The guide discusses factors considered in the process, including motor vehicle speed and volume, road and land-use context, intersections, parking, and user types.
FHWA is currently offering training and free ongoing technical assistance from now through 2021.
For more information on the Bikeway Selection Guide, please contact Tamara Redmon at Tamara.Redmon@dot.gov.

By: Becky Crowe, FHWA Office of Safety
In the spring of 2018, the Virginia Department of Transportation (VDOT) released its first statewide Pedestrian Safety Action Plan (PSAP), which focuses on sites where the safety countermeasures promoted through the Every Day Counts round 5 (EDC-5) Safe Transportation for Every Pedestrian (STEP) initiative should be considered to improve pedestrian safety. FHWA supported VDOT's efforts with training and technical assistance, and VDOT advanced quickly to begin executing the PSAP when it identified funding in fall 2018 for implementation of STEP countermeasures and other pedestrian safety improvements.
By the Book – Using Funds Transferred under Section 154
States such as Virginia that do not enact or enforce federally compliant open container laws are required to shift a percentage of their Federal funding apportionment and use the shifted funds for highway safety. These funds are transferred under 23 U.S.C Section 154. Once the amount of funding to be transferred under Section 154 is determined each year, the funds are split between behavioral and infrastructure safety programs, including the Highway Safety Improvement Program.
VDOT Assistant State Traffic Engineer Mark Cole said "Pedestrian crashes and fatalities have increased over the past several years across Virginia. VDOT is taking action by applying training, FHWA guidance, and data analysis to select locations for pedestrian safety improvements statewide."
As part of the process for developing its PSAP, VDOT evaluated both corridors according to the potential for pedestrian crashes and sites with a history of reported pedestrian crashes. During a series of workshops across the Commonwealth during the summer of 2018, VDOT staff and contractors walked participants through the elements of the PSAP and introduced them to priority pedestrian corridors and crash clusters in their area. Following the workshops, VDOT announced a new call for PSAP projects that could be ready for funding and construction in 2019 due to the availability of funds transferred under Section 154 (see box at right). VDOT also holds an annual call for local agencies to submit safety projects to be funded through the Highway Safety Improvement Program (HSIP), including improvements for pedestrians, but Section 154 funds were a unique opportunity to kick start the implementation of the PSAP.
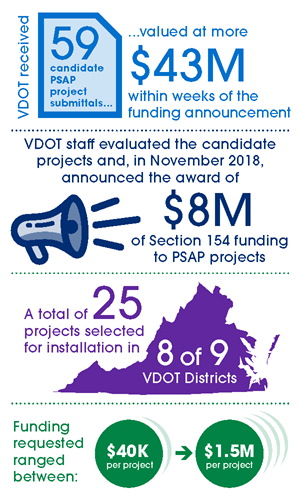
More than 90 percent of pedestrian deaths in Virginia occur when the pedestrian is crossing a road. Due to this overarching safety concern combined with a tight schedule for obligating the Section 154 funds, VDOT and the local agencies that submitted projects for PSAP funding focused on low-cost, high-benefit pedestrian crossing projects, such as installing marked crosswalks, warning signs, pedestrian refuge islands, flashing beacons, and other improvements that do not typically require additional right-of-way or extensive roadway design. VDOT stipulated that eligible projects should be located along a priority pedestrian corridor or in a crash cluster as identified by the PSAP. VDOT Traffic Engineering staff encouraged local agencies to consult with VDOT District offices to ensure that the funded projects could be delivered within several months upon announcement of award. Selected projects were also consistent with the State's Strategic Highway Safety Plan and eligible under the Highway Safety Improvement Program.
VDOT received 59 candidate PSAP project submittals valued at more $43 million within weeks of the funding announcement. VDOT staff evaluated the candidate projects and, in November 2018, announced the award of $8 million in Section 154 funding to PSAP projects, with a total of 25 projects selected for installation in 8 of VDOT's 9 Districts. Funding requested ranged between $40,000 and $1.5 million per project.
VDOT posted the PSAP online so the public can view and download it, which will help spread the word about the PSAP Priority Corridor and Crash Cluster sites as well as the locations of the funded projects. The plan includes schematics for each priority site with detailed information and the recommended improvements planned for each site. For more information about the VDOT PSAP or the 2018-2019 Virginia PSAP Funding program, contact VDOT Assistant State Traffic Engineer Mark Cole, P.E., at mark.cole@vdot.virginia.gov or (804) 786-4196. For more information about the FHWA STEP program, contact Becky Crowe at rebecca.crowe@dot.gov.
By: Adam Larsen, FHWA Office of Federal Lands Highway
On the southwest coast of Alaska, the Yukon-Kuskokwim region is home to around 25,000 people and growing. The region depends on a unique transportation network that includes very few roads. The transportation, services, supplies, and administrative hub for over 50 villages is Bethel, the eighth-largest city in Alaska. Bethel is located about 50 miles upriver from where the Kuskokwim River empties into the Bering Sea, and is accessible by river and air only.

Air travel and shipping is available in many villages, but is costly, so most residents must use alternative transportation options. In the summer, this means marine transport on the rivers and using ATV trails to haul goods. Winter travel, however, is often more perilous.
Each year when the rivers freeze over, crews from nine villages along the Kuskokwim and Johnson Rivers work tirelessly to keep the local ice roads clear and safe. An ice road is a winter road, or part thereof, that runs on a naturally frozen water surface such as a river or an expanse of sea ice. Ice roads provide a temporary means of transportation in isolated areas with no permanent road access. Local crews must continuously monitor ice thickness and quality and clear blown snow to ensure that those who travel over the frozen waterways via snowmobile or other vehicle type can do so safely. In addition to citizens and commercial delivery services, a wide array of government services use the ice road, including U.S. mail contractors, Alaska State Troopers, medical transports, school systems, and search and rescue emergency services (see photos at right).
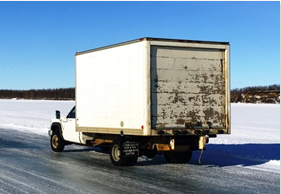
Alaska's ice roads are an important means of transportation during the winter, making it possible for residents to receive deliveries of fuel, firewood, and supplies. One project taking place this past March was delivery of fuel to a village that was operating on emergency rations. Because the ice did not become thick enough during the winter to support delivery of fuel by tanker truck, the fuel delivery company arranged for a fleet of smaller fuel trucks to deliver the fuel by following a path scouted by ice road experts from the Native Village of Napaimute.
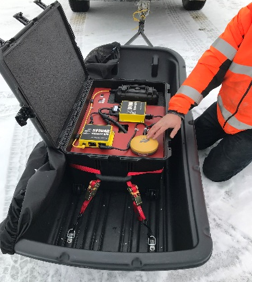
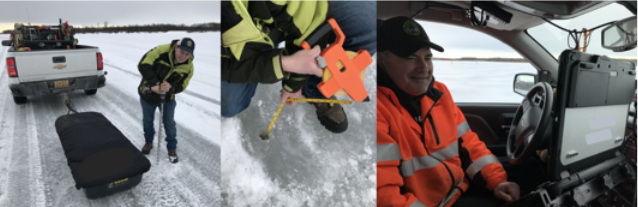
Utilizing a grant from the Tribal Transportation Program Safety Fund, the ice roads crew from the Native Village of Napaimute acquired new technology that is now being used in combination with traditional knowledge to help monitor ice thickness. The device uses ground penetrating radar (GPR) and GPS technology to constantly measure and record ice thickness (see photo at right). As the device is towed on a sleigh, the measurements are wirelessly transmitted to an in-cab computer, which generates nearly instantaneous reports from the data. After about a mile of monitoring, the radar device requires calibration, which is performed by drilling a hole in the ice just large enough to measure ice thickness with a tape measure. The depth of the hole is then recorded in a computer, which adjusts the depth reported in further readings.
This past winter saw unprecedented warm weather, resulting in unusually thin, weak ice. In addition, open holes, usually smaller than 20 inches in diameter, are appearing in the ice. These holes, whose cause is unknown, are unlike anything previously seen by those with decades of experience on the ice roads. Mark Leary, Director of Development & Operations at the Native Village of Napaimute, theorized that these holes could be the results of pockets of methane gas being trapped as permafrost melts.
The use of this new GPR technology has made it possible for maintenance crews to warn travelers of the locations of thin ice, holes, or other areas where travel should be avoided. While similar devices have been used in Canada, where ice roads with limited river crossings are more common, the Kuskokwim ice road is different in that it runs over 120 miles of river rather than simply crossing water over short distances.
The GPR is especially important when heavy loads are being moved, enabling consistent monitoring of the ice road thickness over 1-mile segments. Prior to obtaining the GPR device, maintenance crews could only drill intermittently to estimate ice thickness, and thin areas could only be identified if the crew was lucky enough to drill in that spot. GPR also provides good data, helping local maintenance crews determine when it's safe to start using the ice road as well as when ice road travel should stop.
Adapting to changing climate means adapting the operation of the ice roads and continuing to learn and innovate in order to ensure safe winter travel in one of the world's harshest environments. Advances in research and constantly evolving technology may be able to help increase the safety, frequency, and accuracy of the processes used to monitor ice quality and thickness.
"By combining our traditional knowledge with new technology we are able to manage safe travel despite a changing climate that produces less ice," said Leary.
Despite the many advances made in recent years, gaps in both technology and our understanding of the mechanical properties of ice roads exist, and research is needed to ensure that the use of ice roads can remain as safe as possible. For example, there is a need for methods to test the strength of ice samples and calculate the load that can be carried by ice of varying thickness. Exploring the use of drone photography, drone thermal imagery, sonar, radar, or other technology to screen ice roads for hazardous conditions such as thin ice, open water, and open water covered by snow will also help save lives by ensuring safe transportation in a difficult climate during severe winter conditions.
For more information about the Tribal Transportation Program that funded this technology, please contact Adam Larsen at adam.larsen@dot.gov.
By: Mike Griffith, FHWA Office of Safety
In 2017, the Every Day Counts 4 (EDC-4) Data-Driven Safety Analysis (DDSA) initiative added a local focus to its efforts to improve the quality of safety data and analysis across the country. Partnering with the National Association of County Engineers (NACE) and the Local Technical Assistance Program (LTAP), the team developed a plan to deliver a pilot program designed to help selected counties develop local road safety plans (LRSPs). LRSPs are  a proven safety countermeasure that provide a framework for local practitioners to identify the specific conditions that contribute to severe crashes on their roadways. As part of this process, agencies will partner with stakeholders, analyze local data to establish emphasis areas, determine risk factors, identify countermeasures, and prioritize safety improvements and strategies.
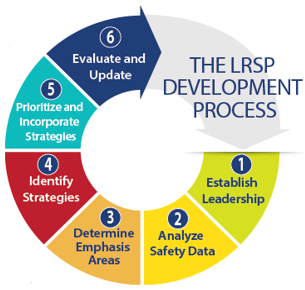
The FHWA-NACE LRSP Pilot Team is working with 42 counties to develop LRSPs. The pilot provides a blended training and technical assistance program to guide the counties and their State partners (including the State DOT and the LTAP) through the six steps for developing a LRSP (illustrated at right).
One of the five participating counties in Indiana is Montgomery County, a rural agricultural county in the western part of the State with an area of about 505 square miles and 845 total miles of county roads. The county did not have an engineer in residence from 2001 up to early 2018. Enter the new Montgomery County Engineer James Peck, P.E. "Shortly after I came onboard, I received a crash data summary and a heat map from Purdue University, which is part of the LTAP program. It became very apparent where the problems are, so I had already been thinking about the safety of our roads. When this opportunity to participate in the pilot came up, I jumped at it," said Peck, explaining that he had learned about the pilot from other county engineers in the State who were active in NACE. Peck participated in the webinar and a December workshop that kicked off the effort in 2018, and since then has been conducting data analysis and site reviewing locations with severe crashes. Roadway departure crashes are a particular challenge for the county, accounting for 57 percent of all crashes.
"What we're doing is taking bits and pieces out of what we're hearing in the pilot and through the technical assistance and applying it to our county. Some counties have substantial right of way where they can do a lot of improvements. We're trying to see what we can do within our existing right of way," he added, noting that roads in the county typically have only 5.5 to 6 feet for drainage, shoulders, and signing. "Obviously we need more delineation on the edge and center line, and we need to reduce speeds," he added, noting that these issues will be addressed in the plan.
"The LTAP has been a huge asset to our process, providing us a lot of crash information, crash tree diagrams, and other information that has really helped us break down the data. I can take this information and go drive the roads and see the issues."
— James Peck, P.E., Montgomery County Engineer
Montgomery County's participation in the LRSP pilot has dovetailed into an already-underway effort by Peck to renew the county's thoroughfare plan, which had been generated by the State several years prior and was due for an update. Thorough¬fare plans are typically concerned with the connectivity of county roads. They identify corridors for improvement to help promote commerce and coordinate improvements with surrounding county road networks. As a result of efforts to develop an updated version, and with the data provided by Purdue, Peck already had some ideas about areas and issues that would need be addressed within the county system, so the comprehensive crash data he received from the Indiana LTAP as part of the LRSP pilot was not surprising.
"The LTAP has been a huge asset to our process, providing us a lot of crash information, crash tree diagrams, and other information that has really helped us break down the data. I can take this information and go drive the roads and see the issues," he said, pointing to a roadway that he reviewed that had an unusually high number of roadway departure crashes.
"I drove the road, and I thought, 'This road is in really good condition.' I couldn't figure out why there were so many crashes." Taking a deeper dive into the data provided through the LTAP and looking at the time of day and other local area characteristics, he was able to connect the dots. "The crashes were clustered during the period shortly after classes ended at a nearby high school. The kids were getting out of school, driving too fast, and going off the road."
Speed is one of the more common safety challenges on rural roadways, and Montgomery County is no exception. "We will be looking at a county-wide speed ordnance reducing the speeds. In typical counties, if the road isn't posted, it's assumed the speed is 55 mph. If we can post a more realistic speed, that will help increase driver reaction time."
Once the current data analysis phase is complete, Peck noted, the work will shift to establishing a group of stakeholders to participate in creating a LRSP.
"Those stakeholders will likely include our sheriff's office, fire department, emergency medical services, school corporations, [the] highway department, and perhaps more groups," said Montgomery County Commissioner John Frey in a recent op-ed to publicize the effort to county residents. Frey, who has enthusiastically supported the county's involvement with the pilot also noted that "Once chosen, Peck and his team will begin to determine measures to mitigate the problem or problems and seek lowest cost options to implement solutions."
"Our goal is coming up with a good plan that will improve safety and that we can all agree to," Peck added. FHWA intends to continue working with NACE, the National Local Technical Assistance Program Association, and other State and county agencies on the development of LRSPs. The pilot program has proven to be successful for numerous counties across nine states. This effort has informed local staffs about enhancing partnerships and leveraging funding for improving local road safety.
If you are interested in learning more about FHWA/NACE LRSP Pilot, please contact Jerry Roche at jerry.roche@dot.gov or Hillary Isebrands at hillary.isebrands@dot.gov.
By: Kelly Morton, FHWA Office of Safety
A new Federal Aid Essentials video is now available that describes the Section 130 – Rail Highway Crossings Program, including an overview of requirements that State DOTs and local agencies must follow when utilizing Section 130 funds. The audience for this resource is anyone with a State DOT, local agency, or others who are interested in how to use Section 130 funds.
More information on the FHWA Rail-Highway Crossings Program (RHCP) can be found on the FHWA Office of Safety RHCP Web page.
Additional videos on the Federal-Aid Highway Program and a variety of project requirements can be found at the FHWA Federal Aid Essentials Video Library. Feel free to share!
By: Chimai Ngo, FHWA Office of Safety, Kara Chisholm, Volpe, and Susan Smichenko, Volpe
The FHWA Office of Safety sponsored a peer exchange in Seattle, Washington on September 5 and 6, 2018, to share information on approaches and practices that will help participants achieve the vision of zero traffic deaths in their localities. The participants included representatives from seven Vision Zero cities: Seattle, Washington; Anchorage, Alaska; Portland, Oregon; Minneapolis, Minnesota; Richmond, Virginia; Durham, North Carolina; and Bellevue, Washington. The purpose was to share successful practices for and approaches to improving roadway safety among the cities.
Establishing and maintaining strong stakeholder partnerships is a key component of a successful Vision Zero program. Vision Zero representatives from Durham, Richmond, and Seattle shared highlights of their approaches to training, internal and external partnerships, and strategies for outreach to communities.
The City of Durham has established an innovative process to ensure that Vision Zero remains a focus across city departments and city administrations: incorporating Vision Zero training into new employee orientation. This practice creates continuity across city leadership and departments and demonstrates the level of importance Vision Zero has in Durham.
The City of Richmond's Vision Zero Task Force provides a forum for multiple city departments to discuss Vision Zero prioritization efforts in support of traffic safety. The city's Vision Zero coordinator helps to navigate differences among city departments and engages community, non-profit, private, regional, State, and Federal resources. Richmond frames Vision Zero as a public health problem. It works with State and regional entities in the public health field to establish a shared approach and terminology for Vision Zero. Transportation and public health organizations share data in order to better direct resources to areas with the greatest need. This health and transportation partnership also allows the city to leverage and engage more partners and obtain additional funding for Vision Zero implementation.
The City of Seattle's Vision Zero program is a notable example of how communities can make connections with diverse stakeholders in order to broadly communicate the goals of Vision Zero. Seattle developed a two-minute video called "Vision Zero People on the Street" that will be translated into multiple languages to help engage and build trust among different communities. The city also developed a toolkit that guides staff in the development, implementation, and evaluation of policies, initiatives, and programs so that they have equal impact on the diverse communities in Seattle. This helps counteract the greater level of influence that some communities have compared to others simply because they more actively participate in city government or are more vocal in expressing their perspectives.
In addition, the city developed the Seattle Streets Illustrated Map tool to help communicate to the public the function of each road segment in the city and how the city treats the road as a result. The map identifies whether a road is a low-stress route where bicycling is prioritized, a primary transit corridor, a major freight route, etc.
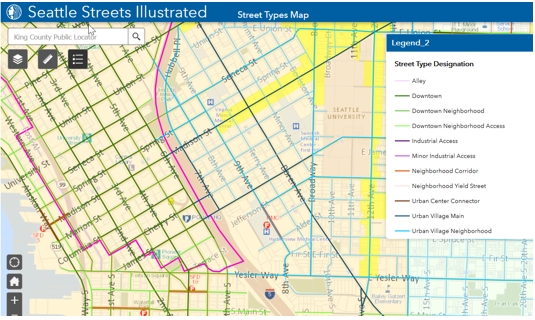
The City of Seattle harnesses technology and data to strategically improve roadway safety. Seattle has created an Open Data Web Mapping Platform that includes information about roadway geometry, traffic volumes, utility locations, land use, landscaping features, and crash records (see image at right). This platform serves as a way to control the quality of data and associated data analyses. Based on these data, Seattle developed a predictive model to identify locations for likely crashes of different types. This analysis helps the city proactively and systematically implement countermeasures as indicated by the likely crash type and counteract the underreporting of crashes.
The City of Portland developed a campaign titled "Struck" that focuses on the human toll of high speeds. The campaign uses billboards, posters on buses, online media, television, and advertisements in movie theaters to communicate the message. Key to the campaign's success has been its consistency in branding across media: campaign materials use the same colors, fonts, and logo. The city hired a marketing and production firm to create what became one of the most impactful elements of the campaign: a video entitled "Struck: Save Two Lives." Portland's research showed that almost 60 percent of viewers reported that the video had an impact on their driving behavior.
In addition to the Struck campaign, the city has produced materials with the slogan "20 is Plenty" to promote adherence to the city's 20 mph speed limit. The city created "20 is Plenty" lawn signs and flyers with educational notes about safety and the victims of traffic crashes. Portland's goal is to educate drivers about the potential consequences of their actions by focusing on the human toll of high speeds and encouraging citizens to drive within the speed limit.
Seattle has also implemented physical road design changes to help achieve Vision Zero. As noted above, it has reduced the speed limit on residential streets to 20 mph and added traffic calming measures to many roads—including chicanes, roundabouts, speed humps, and raised crossings—that create a comfortable driving speed of just 15 mph. In addition, Seattle is implementing Neighborhood Greenways to provide continuous, low-stress routes throughout the city.
Representatives of the Vision Zero cities present at the peer exchange indicated that hearing from a diverse group of cities, learning communications strategies, and hearing how cities overcome a variety of challenges helped to inform them about approaches and practices that can lead to zero traffic deaths in their cities. Many left the peer exchange ready to take steps toward building stronger partnerships with community members, using data to tell a story, and exploring ways other than traffic modeling to make road design decisions.
For more information on FHWA's Vision Zero initiatives, please contact Chimai Ngo at chimai.ngo@dot.gov.
By: Joseph Cheung, P.E. FHWA Office of Safety; Karla Sisco, Tribal Tech Initiative Program Manager at Oklahoma State University; and Lisa Bedsole, Leidos
In 2013, the Oklahoma Department of Transportation (ODOT), in conjunction with the Federal Highway Administration (FHWA), saw an opportunity to address a particularly challenging stretch of SH-20 in Mayes County in northeast Oklahoma by using Accelerated Innovation Deployment (AID) grant funding to apply High Friction Surface Treatment (HFST). ODOT had done everything it could at these curves to improve safety, including adding rumble strips and oversized chevron signs.
"Before high friction surface treatment was applied, we were seeing a high rate of crashes occurring on SH-20 in Mayes County, especially in wet conditions," noted ODOT Division Eight Maintenance Engineer Trapper Parks.
After applyingHFST to three curves in Mayes County, and observing the preliminary crash reduction at these locations, ODOT applied for and received AID Demonstration funds through the Every Day Counts (EDC) initiative to install HFST on four curves at three locations in the Oklahoma City metropolitan area in 2015. The previous applications of HFST in Oklahoma had occurred on rural two-lane highways with low average daily traffic. This project was chosen to evaluate the durability ofHFST under extreme traffic volumes.
ODOT Traffic Safety Engineer Matt Warren analyzed and provided crash data at locations before and afterHFST was applied for the project team. At the treated sites in Mayes County, 26 crashes and 4 severe injuries were observed in the 5 years beforeHFST was added. Three years after the treatment, two crashes and zero severe injuries were recorded at the same locations. Projections by Warren estimate HFST will provide a 79 percent reduction in crashes and 75 percent reduction severe injuries and fatalities at these locations.
In the Oklahoma City metro area, 159 crashes and 8 severe injuries occurred at HFST-treated locations over the 5-year period before HFST was applied. In the 1.5 years after application of HFST, 11 crashes with no severe injuries have occurred at the treated locations. Warren noted a projected benefit of 77 percent reduction in crashes and 69 percent reduction in severe injuries at the treated locations in Oklahoma City.
A key component to successful innovation deployment programs such as EDC are the State-based approach and the State Transportation Innovation Council (STIC) concept, which encourages deployment of innovative, underutilized countermeasures that shorten project delivery, enhance roadway safety, reduce traffic congestion and improve environmental sustainability.
"Oklahoma's innovation council is a unique opportunity for representatives from transportation agencies, industry, and academia to collaborate and pursue innovations that will help deliver a modern and efficient transportation system in our State," said ODOT Director of Capital Programs and STIC Chair Dawn Sullivan.
To better share its HFST successes with transportation professionals and the public, in 2018 ODOT and the STIC applied for and received State Transportation Innovation Council Incentive funds for the Accelerating Innovation Deployment in Oklahoma – Phase 2 – EDC outreach toolkit for HFST. The funding has been used to create a communications strategy that is helping the State tell the story of its success in preventing crashes and decreasing roadway fatalities by deploying HFST. While still early, this funding has so far resulted in development of an interactive informational booklet and news release promoting the benefits of HFST and highlighting the ODOT experience.
Using a $1.24 million multi-county Systemic Curve Treatment Safety Improvement Plan as its guide, in 2018 ODOT renewed its efforts to reduce the number of run-off-the-road collisions on curves in eight counties, four ODOT divisions, and 11 locations. Two of the original three treatment sites on SH-20 in Mayes County are also slated for scheduled re-application in the new curve safety plan.
"We have lots of curvy roads and places where using a treatment likeHFST can make a difference," said Anthony Echelle, an ODOT Engineer for Division Two, which includes planned treatment locations in LeFlore County, where curve-related crashes are over-represented. The ODOT curve treatment plan will fund installation of curve advisory signs, LED blinking lights, lowered-speed limit signs, guard rails and, of course, HFST.
"With guardrail and cable barrier, you only mitigate the injury after the crash happens," said ODOT Traffic Safety Manager David Glabas. "When you can't change the geometry of the road,HFST becomes a very economical solution to prevent crashes."
For more information about HFST, please visit the High Friction Surface Treatment information page or contact Joseph Cheung at joseph.cheung@dot.gov.
By: Adam Larsen, FHWA Office of Federal Lands Highway
On an annual basis, the FHWA Safety Discipline seeks to identify and recognize individuals who exemplify outstanding leadership, dedication, and accomplishments through two awards. The first is the Field Safety Leadership Peer Award, and the second is the Howard Anderson Safety Lifetime Achievement Award.
For this award, nominations are solicited annually and reviewed by a committee with representation from all parts of the safety discipline: division offices, Resource Center Safety and Design Teams, Federal Lands Highways, Turner-Fairbanks Highway Research Center, and the Office of Safety Headquarters in Washington, DC. The committee considers recent accomplishments, demonstration of leadership skills in safety, and other proven leadership capabilities in the selection process. Last year, nominations resulted in Field Safety Leadership Peer Awards for three individuals: Ken Kochevar, Emmett McDevitt, and Dick Albin.
Kenneth Kochevar, P.E., California Division Office. This award recognizes Ken's contributions and accomplishments in advancing highway safety in California and throughout the Nation. Ken has demonstrated his passion for highway safety in the many activities that he is involved in both statewide and nationally. Some of Ken's activities include hosting roadway departure workshops, promoting the proven safety countermeasures, and providing technical expertise to national efforts such as the Handbook for Designing Roadways for the Aging Population. Ken's leadership has resulted in HSIP funding for systemic deployment of safety countermeasures, a Tribal set-aside of HSIP funds, institutionalization of High Friction Surface Treatment by Caltrans, and establishment of safety performance targets for California. Ken has helped California get on track for a reduction in roadway departures and, ultimately, a trend toward zero crash-related fatalities.

Emmett McDevitt, New York Division. This award recognizes Emmett's tireless work in improving safety for the residents of New York and for the nation as a whole. Emmett was responsible for leading a collaborative effort with State and local agencies to develop three Safety Action Plans (NY State Pedestrian Safety Action Plan, NYC Pedestrian Safety Action Plan, and NY Intersection Safety Action Plan) that will further the application of systemic safety improvements throughout the State. One of his recognized strengths is his ability to bring people together to improve the safety program; for example, during an effort to install 400 roadside signs throughout the State, Emmett assessed the signs as they were being installed and identified several issues with both the signs and how they were being installed. He immediately brought the agencies involved together to discuss the situation and to find a way forward that resulted in the approval of an experimental plan that reduced the number of signs on the interstate and brought the signs themselves into compliance with MUTCD standards. In addition, with Emmett's guidance, the State of New York was able to develop a method for making crash data available to local public agencies to support their data analysis and project implementation efforts, further demonstrating his exemplary leadership, technical knowledge, and ability to collaborate with diverse partners to advance highway safety.

Dick Albin, P.E., Resource Center. This award recognizes Dick's dedication to reducing roadway departure crashes by deploying technology, training practitioners, and promoting the systemic approach. Dick has led deployment, training, and technical assistance in support of the Focused Approach to Safety for Roadway Departure (FoRRRwD). He has led or contributed to many plans to address roadway departure crashes and deploy systemic countermeasures across the country. Through Dick's efforts, every State has participated in a Roadway Departure Peer Exchange, and many have been influenced to enhance their safety toolbox by implementing proven safety countermeasures. Dick is a strong champion for reducing rural roadway departure crashes, using his strong leadership, professionalism, and technical knowledge to effectively train others on how to accomplish this important goal.
Named after the first FHWA Associate Administrator for Safety, the Howard L. Anderson Lifetime Achievement Award was established in 2014 to recognize a current or retired FHWA employee who exemplifies outstanding and significant service to the safety discipline over his or her career. Nominees are evaluated by an executive committee for continuous efforts to champion safety both internally and externally to FHWA. The 2019 Howard L. Anderson Lifetime Achievement Award has been awarded to Craig Allred of the FHWA Resource Center Safety and Design Team.
This award recognizes a lifetime of dedication to reducing highway fatalities through leadership, innovation, and mentoring. For more than 50 years Craig has demonstrated a real passion for highway safety in leadership roles at the Utah Department of Public Safety, NHTSA, and the FHWA. Craig's dedication has resulted in many innovative accomplishments including the "AMBER alert" program and integration of Road Safety Audits into the toolbox of many government agencies. Craig also led NHTSA's "Operation Buckle Down" to promote compliance with safety belt and child passenger safety laws. Having instructed many courses on highway safety, Craig was recognized as a National Highway Institute-designated Instructor of Excellence over multiple years and serves as an NHI Master Trainer. Although a law enforcement officer by training, since joining FHWA, Craig has both learned and taught others about many safety engineering concepts, going to great lengths to personally connect with and develop others interested in the crusade to save lives on our Nation's roads. Many within and outside of FHWA have been influenced by Craig, and some have even had the privilege of being mentored by him. It is for these accomplishments and his deep commitment to improving highway safety that Craig Allred is receiving the Howard Anderson Lifetime Achievement Award.
By Greg Schertz, FHWA Office of Federal Lands Highway

The Safety Team in the Federal Lands Highway Division (FLHD) has created a new program to recognize non-safety specialists for their special efforts to save lives.
The Golden Bolt award is made from a gold-painted guardrail splice bolt and includes a thank you card signed by FLHD leadership. The idea behind the award program is to continue to build the internal safety culture. Anyone in FLH who is not a safety specialist is eligible, regardless of their position or office.
The first awards were given at the Central Federal Lands Highway Division annual all-employee meeting (see photo below). The second group of recipients received their awards at the recent FLHD Construction and Project Management Discipline Seminar.
This awards program is unique in that recipients are not nominated. Instead, the Division Safety Specialists identify outstanding efforts in the area of safety by non-safety staff and take on the responsibility for getting a recognition card signed by FLH Leadership. The awards are given on a rolling basis, ideally in front of peers during all-employee meetings or discipline conferences. The Golden Bolts remind FLH staff that saving lives is very important, and people who go "above and beyond" to make our transportation system safer deserve recognition.
The Golden Bolt award will be an on-going program administered by the FLH Safety Team.
On December 3, 2018, Beth Alicandri received FHWA's Heartland Award. This award honors the memory of the 11 FHWA employees who were lost in the bombing of the Alfred P. Murrah Federal Office Building in Oklahoma City on April 19, 1995. It also recognizes the dedication of the survivors who worked diligently to reestablish their office, despite all they had been through.
This award is granted to individuals who have provided exceptional service to the traveling public. Their achievements are of marked national significance and reflect the high level of dedication and determination exemplified by the Oklahoma Division employees.
Beth received the 2018 award for being a tireless champion for building and enhancing strong coalitions and partnerships with Federal, State, and local agencies; the transportation industry; national stakeholders; and safety advocacy organizations in order to identify and resolve complex and politically sensitive transportation challenges.
Beth was also recognized for providing expert leadership and technical guidance. She has played a vital role in assisting Headquarters, field offices, and transportation partners in bringing a high level of visibility to safety concerns, offering solutions to address challenges related to highway road users' safety, and championing the mission of the Road to Zero Coalition.
The Heartland Award recognizes Beth's three decades of passionate, dedicated leadership in roadway safety.
By: Martha C. Kapitanov, FHWA Office of Operations
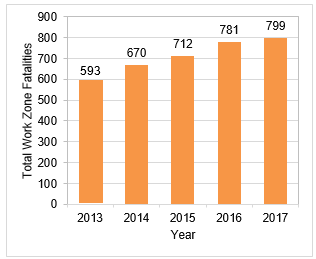
Did you know that work zone fatalities have been rising for the past 5 years? Is your State working toward zero deaths and including work zone strategies in its Strategic Highway Safety Plan?
In 2017,1 the most recent year for which we have data, 799 traffic-related fatalities occurred in work zones. According to data from the Fatality Analysis Reporting System (FARS), that number represents an increase of 2 percent from 2016, when the Nation experienced 782 work zone fatalities. The total number of pedestrian and bicyclist fatalities in work zones also increased, up by 9 percent. Speed was a contributing factor in almost 30 percent of 2017 fatal work zone crashes. (For information on work zone fatalities by year and state, visit: https://www.workzonesafety.org/crash-information/work-zone-fatal-crashes-fatalities/#national.)
| Statistic | 2016 Value | 2017 Value | 2016-2017 Change |
|---|---|---|---|
| Total work zone fatalities(1) | 782 | 799 | 2% |
| Drivers and passengers | 652 | 658 | 1% |
| Pedestrians and bicyclists | 125 | 136 | 9% |
| Others | 5 | 5 | 0% |
Furthermore, 221 (31 percent) of fatal work zone crashes involved large trucks or buses and resulted in 274 fatalities (97 percent involved large trucks and 3 percent involved buses) in 2017.1 The Federal Motor Carrier Safety Administration (FMCSA) program entitled "Our Roads, Our Safety" developed Tips for Traveling Safely in Work Zones to help drivers travel more safely through active work zone areas. FHWA is partnering with FMCSA, the National Highway Traffic Safety Administration (NHTSA), State DOTs, trucking associations, and other safety stakeholders to find solutions to improve commercial motor vehicle2 safety in work zones. For more resources and tools, visit the Large Trucks in Work Zones webpage.
FHWA joined the American Traffic Safety Services Association, FMCSA, NHTSA, the Occupational Safety and Health Administration, the American Association of State and Highway Transportation Officials, the American Road & Transportation Builders Association, Associated General Contractors, the Virginia Department of Transportation, the Maryland State Highway Administration, and other stakeholders to raise work zone safety awareness during the kick-off event for National Work Zone Safety Awareness Week (NWZAW). As part of this effort, the District Department of Transportation and the NWZAW Executive Committee developed a downloadable NWZAW poster, and FHWA developed a fact sheet for widespread distribution among its work zone safety partners and stakeholders.
The 2019 theme "Drive Like You Work Here" reminds us to pay full attention to changing road conditions while approaching, driving through, and exiting a work zone. Based on the Bureau of Labor Statistics, 132 worker3 4 fatalities in road construction occurred in 2017, about an 8 percent decrease from 2016.
The FHWA Work Zone Safety Program supports the zero deaths initiatives by providing training and developing guidelines to enhance work zone safety. For more information on work zone management training, regulations, resources and tools visit the FHWA Work Zone Management website at and the National Work Zone Safety Information Clearinghouse website.
By: Tara McLoughlin, FHWA Office of Safety
 10x10 roundabout floor decal
 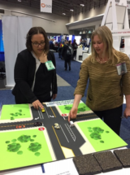 Tabletop demo of dedicated left- and right-turn lanes
Visitors to the Office of Safety booth at this year's Transportation Research Board (TRB) meeting got a multi-dimensional look at the 20 Proven Safety Countermeasures (PSCs) that were featured at this year's exhibit. These PSCs are the engineering innovations that FHWA promotes to reduce crashes that cause fatalities and serious injuries on our roads. Visitors to the booth could "drive" toy cars through alternative intersection designs (like displaced left-turn intersections) to see how these designs reduce conflicts, touch samples of High Friction Surface Treatments in the "Counter-measures Petting Zoo," plug values into the online USLIMITS2 tool to see what the appropriate speed should be for a particular stretch of road, and walk through a 10-ft by 10-ft mockup of a multi-lane roundabout.
These interactive features constantly drew crowds to the booth—the Office of Safety welcomed a record 724 visitors this year (a rate of 43 visitors per hour!). The roundabouts decal was particularly popular with visitors and was large enough for several people to walk through it simultaneously and get a "feets-on" refresher course on how to drive a multi-lane roundabout. A good number of visitors described themselves as "roundabouts champions" and noted that after seeing the decal, they'd like to get something similar produced for outreach events like public meetings. A highlight of the meeting was when FHWA's very own roundabouts champion Deputy Administrator Brandye Hendrickson visited the booth and navigated the roundabout like a champ!
Once visitors were "hooked" by the hands-on demos, Office of Safety staff shared information with them on the many other items on display. The Office of Safety featured more than 50 offerings—guides, reports, FAQs, and other materials–from its diverse program areas. Visitors picked up over 1,000 pieces of material from the Office of Safety booth over the course of the show.
In addition, the live demonstrations by safety experts drew many visitors to the booth, allowing the office to prominently feature its expert staff, promote new offerings, and answer visitors' questions in real time. The booth featured informal demos/presentations on a variety of key safety topics ranging from estimates of lives saved by Crash Modification Factors, to the USLIMITS2 online speed-setting tool, to roadway departure safety resources, and zero deaths initiatives and partnerships.
Visitors to the booth were incredibly diverse, representing local, Tribal, State, and Federal agencies; academia; private companies; international institutions; and non-profit organizations.
Finally, the Office of Safety debuted its "Safety Selfie Station" at this year's booth, where visitors could declare in a photo that they "…make roads safer, one countermeasure at a time" with the option of dressing up in safety gear for the selfie. Visitors could then post their picture to their Facebook and/or Twitter feeds, using the #safetycountermeasures hashtag.
For more information about the Office of Safety booth or if you want to borrow the booth for your outreach, contact Tara McLoughlin at tara.mcloughlin@dot.gov.
ANNOUNCEMENTS
ITS America 28th Annual Meeting. June 4–7, 2019, Washington, DC. With its theme of "Intelligent Mobility: Safer. Greener. Smarter," ITS America's 2019 annual conference will highlight seamless mobility around the movement of people, data, and freight. Sessions will address topics including workforce development, AI/automation, security, technology and liability, accessibility and equity, innovation and research, smart communities, infrastructure funding, and many more.
National Association of Counties Annual Conference and Exposition. July 12–15, 2019, Clark County (Las Vegas, NV). The NACo annual conference is the largest meeting of county elected and appointed officials from across the country. Participants from counties of all sizes come together to shape NACo's Federal policy agenda, share proven practices, and strengthen knowledge networks to help improve residents' lives and the efficiency of county government.
National Rural ITS Conference at the ITE Annual Meeting and Exhibit. July 21–24, Austin, TX. This year's theme is "Transportation Transformed." Topics will address a range of issues affecting rural and small communities including effective pedestrian and bicycle networks, benefits of transportation technology investments, Complete Streets, and designing for connected and automated vehicles, among many others.
National Local Technical Assistance Program (LTAP)/Tribal Technical Assistance Program (TTAP) & National Transportation Training Directors (NTTD) Conference. August 12–15 2019, Stowe, VT. The theme for this year's annual meeting is "Rising to New Heights." Topics relevant to safety professionals include implementing the national zero deaths strategy on highway safety at the local level, an introduction to the EDC-5 Safe Transportation for Every Pedestrian 2.0 initiative, an EDC-5 showcase, the latest human factors guide for local agencies, the importance of safety fairs/safety days/safety conferences, combating roadway departures, and much more.
2019 National Highway – Rail Grade Crossing Safety Conference. August 19–22, 2019, Pittsburgh, PA. This year's event includes a broad spectrum of topics and information for railroad and highway safety professionals, including Highway-Rail Grade Crossing State Action Plans, Section 130 Funding, resilience and disaster recovery, updates from Operation Lifesaver, Inc., an update on quiet zones, research and development with a focus on innovative technologies, MUTCD updates, and much more.
is a publication of the U.S. Department of Transportation, Federal Highway Administration.
The Federal Highway Administration publishes the Safety Compass newsletter three times a year. We can be reached at:
FHWA Office of Safety
1200 New Jersey Ave. SE
Room E71-320
Washington, DC 20590
The Safety Compass is available online at the FHWA Office of Safety web site at: https://safety.fhwa.dot.gov/newsletter/safetycompass/.
We welcome your comments and highway safety-related articles. The purpose of this newsletter is to increase highway safety awareness and information and to provide resources to help save lives.
We encourage readers to submit highway safety articles that might be of value to the highway safety community. Send your comments, questions and articles for review electronically to Tara McLoughlin at: tara.mcloughlin@dot.gov

