U.S. Department of Transportation
Federal Highway Administration
1200 New Jersey Avenue, SE
Washington, DC 20590
202-366-4000
Sign up to have Safety Compass delivered right to your inbox!
Best for printing: PDF Version (2.6 MB)
To view PDF files, you can use the Acrobat® Reader®.
In this issue:
A Message from the FHWA Associate Administrator for Safety, Cheryl Walker
What's New?
The 2019 Roadway Safety Awards — Recognizing Road Safety Projects That Are Making a Difference
Third Edition of the Highway-Rail Crossing Handbook Now Online!
A Second "Go-Around" for the National Roundabouts Week Campaign
Safety Data and Analysis
Crash Trees: A Useful (and Now Automated) Tool for Systemic Safety Analysis
Safety-Driven Changes and Improvements
Low-Cost Safety Countermeasures: Small Changes Make a Big Difference on Rural Roads
Systemic Safety Improvements on Rural Roadways on the Lake Transverse Reservation
Learning Together
Agencies Are Inspired to Action During Pedestrian Safety Peer Exchanges
Teaching Pedestrian and Bicycle Concepts to the Next Generation of Transportation Leaders
IHSDM Update: Release 15.0.0 Now Available!
Announcements
Upcoming Conferences and Events
Visit the FHWA Office of Safety at Booth 721 in the TRB Exhibit Hall!

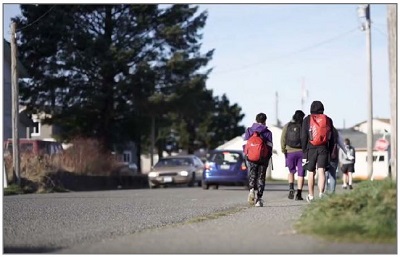
Hello to all of our safety-focused friends! Welcome to the winter edition of the Safety Compass. The traditional holiday season has passed on by, and we find ourselves in the midst of the months that bring us short, winter days. Any break in the weather has folks with mid-winter cabin fever clambering to get outdoors—maybe a brisk walk or jog?
Nearly all of us are pedestrians over the course of our daily activities and have seen or encountered close calls over the years. I'm an avid runner, and I often run early in the morning, before the sun is up. While on the running paths, I am diligent about keeping aware of my surroundings, and I am even more so after a near miss a couple of years ago. I was running in a crosswalk at an intersection controlled by a stop sign, and I was certain the driver saw me. But the driver did not see me and kept coming nearly at speed, likely planning to stop at a point past the crosswalk. I stopped in my tracks just short of the point where we would have collided. These near misses are powerful reminders that everything can change in an instant.
The National Highway Traffic Safety Administration's (NHTSA) recent report of Fatality Analysis Reporting System (FARS) data shows that in 2018, the total number of fatalities declined 2.4 percent compared to 2017's total. This is 913 fewer fatalities. I love the thought of those 913 people going home to their families and friends each evening.
This positive news is tempered by a 3.4 percent increase in pedestrian fatalities for the same period—which is part of a worrisome 53 percent overall increase since 2009. My heart sinks when I see this continued uptick in pedestrian fatalities.
A total of 6,283 pedestrians lost their lives in 2018. All of us—drivers and pedestrians—must stay vigilant while using our roadways.
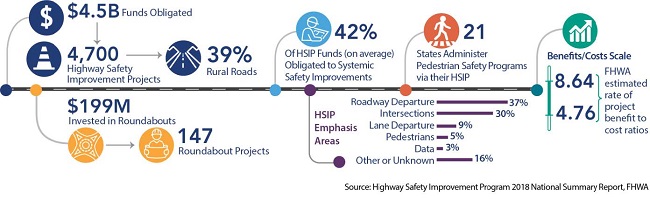
We can do more than just increase general awareness. FHWA promotes many infrastructure improvements shown to reduce fatalities. Our Safe Transportation for Every Pedestrian (STEP) program encourages systemic application of specific, cost-effective, proven safety countermeasures. In this issue, read about our recent STEP peer exchange (page 16) focusing on local agencies. Also take a look at the winners of the 2019 Roadway Safety Awards (page 3). Seven projects, including two for pedestrian safety, were recognized for contributions to saving lives on our roadways through successful engineering, innovative solutions, and effective programs. And, as the infographic on the following page shows, States are rising to the challenge and investing in highway safety improvements. The statistics are from the newly released 2018 HSIP National Summary Report. (available here) These latest statistics show States' progress in implementing Highway Safety Improvement Program (HSIP) projects and how States are targeting their resources.
These examples, plus other strategies highlighted in this issue that improve roadway safety, show that our work is making a difference for all road users—pedestrians, cyclists, motorcyclists, and motorists alike.
I hope you all stay warm during these winter months. Most importantly, let's all be safe out there!
By the Numbers: States' Investments in Highway Safety
By: Norah Ocel, P.E., FHWA Office of Safety

On October 23, 2019, seven transportation safety projects were recognized for their contributions to saving lives on our Nation's roadways. In a ceremony that took place at the United States Capitol in Washington, DC, the Roadway Safety Foundation (RSF) and the Federal Highway Administration (FHWA) gave awards for projects that involved successful engineering and operational solutions, were innovative and effective, and moved the nation closer to reducing the number of fatalities and serious injuries on our roads.
Representatives from five State departments of transportation (DOT) and one county were on hand to accept the awards.
The awards were given in two categories: infrastructure and operational improvements and program planning, development, and evaluation.
Infrastructure and operational improvements
Missouri Department of Transportation (MoDOT): U.S. 63 Road Safety Assessment and Safety Improvements. Public outreach, median U-turn solutions, and a roadway safety assessment reduced injury crashes at three intersections on U.S. 63 in north central Missouri. In 4 years, total crashes have been reduced by 50 percent, and four fatal and eight serious injury crashes were reduced to zero!
Arizona Department of Transportation (ADOT): Wrong-Way Driving Detection System. The first-in-the-nation wrong-way driver detection system was implemented in Phoenix using thermal cameras to detect and track wrong-way vehicles. It was a success, providing immediate alerts to State troopers that resulted in quick responses to incidents.
South Dakota Department of Transportation (SDDOT): Application of High-Friction Surface Treatment in Winter Road Conditions. High-friction surface treatments at 15 horizontal curves in Black Hills, South Dakota, reduced road departure crashes, where winter road conditions were a contributing factor, by 78 percent in the first 2 years.
Program planning, development, and evaluation

Florida Department of Transportation (FDOT) (2 awards):
Virginia Department of Transportation (VDOT) (2 awards):

An honorable mention also went to Garfield County, Washington, for its Road Improvement Safety Plan, a cornerstone of its long-term, comprehensive plan for investing in rural roadway safety.
For more information, contact Norah Ocel at norah.ocel@dot.gov.
To listen to a Federal News Radio story on the awards, visit https://federalnewsnetwork.com/federal-drive/2019/10/fha-auto-safety-group-honor-efforts-to-engineer-life-saving-projects/.
By: Kelly Morton, FHWA Office of Safety

The new 2019 edition of the Highway-Rail Crossing Handbook is a joint publication from FHWA and the Federal Railroad Administration (FRA) and is available today on the Office of Safety website at www.safety.fhwa.dot.gov/hsip/xings/com_roaduser/fhwasa18040/!
The new third edition of the handbook is intended to support anyone who designs or manages highway-rail crossings. The handbook contains recommended safety engineering treatments and current noteworthy practices.
What is covered in the new third edition? Fully compliant with the Manual on Uniform Traffic Control Devices (MUTCD), the new content in the handbook includes:
For more information, contact Kelly Morton at kelly.morton@dot.gov.
By: Jeffrey Shaw, FHWA Office of Safety, and Hillary Isebrands, FHWA Resource Center

The second National Roundabouts Week (NRW) campaign was held during the third week of September 2019. The NRW was established to educate the public about the safety benefits of roundabouts and to salute the State, local, and Tribal agencies constructing roundabouts in their communities to prevent severe crashes and save lives. The campaign leveraged Facebook, Twitter, LinkedIn, and Instagram to share information about the effectiveness of roundabouts, how to drive them properly, and interesting related facts. The FHWA web page devoted to NRW was updated with fresh content and can be found at https://safety.fhwa.dot.gov/nrw/. The hashtag #roundaboutsweek was used to help find, link, and track related posts.
A metrics analysis of reaches—the number of people seeing the content—provided by the social media team in the FHWA Office of Public Affairs revealed encouraging takeaways for FHWA social media channels during NRW, as compared to the prior 2-week baseline activity.

Clearly, roundabouts can be a hot and exciting topic! What's more, there were two FHWA Tweets during NRW that made the daily top 50 from Federal agencies, a first for FHWA. These two Tweets were ranked #35 and #44 on their respective days. Additionally, internet search results suggest there were several hundred other roundabouts-related posts throughout the week, including some from familiar road safety partners, such as the National Safety Council and the National Association of County Engineers. However, it was the debut of the newest action hero—Professor Roundabout—that was arguably the most entertaining. Major kudos go out to the City of Hilliard, Ohio, and Deputy City Engineer Letty Schamp for this wonderfully creative public outreach effort. We're all rooting for Professor Roundabout to use her #RoundaboutsRules superpowers to defeat Major Chaos once and for all!
As we close the books on NRW 2019, let's remember why we're all working hard to build more roundabouts: they can reduce crashes that result in injuries and fatalities by approximately 80 percent. As our new Associate Administrator for Safety, Cheryl Walker, stated in our NRW promo video, "Each roundabout we build is one more step toward our goal of zero deaths."
For more information, contact Jeff Shaw at jeffrey.shaw@dot.gov.
By: Karen Scurry, FHWA Office of Safety, and Frank Gross, VHB
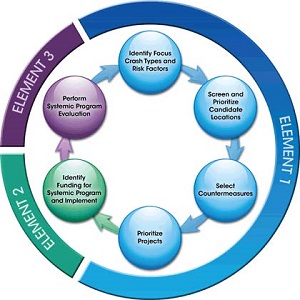
The systemic approach to safety management seeks to identify and treat locations with the greatest potential for safety improvement based on site-specific geometric and operational attributes known to increase crash risk. The image to the right illustrates the six-step systemic approach, detailed in FHWA's Systemic Safety Project Selection Tool.
The systemic approach starts with identifying focus crash types, focus facility types, and risk factors. Focus crash types typically represent the greatest number of severe crashes across the roadway network of interest and provide the greatest potential to reduce fatalities and serious injuries. Emphasis areas from State Strategic Highway Safety Plans (SHSP), County Road Safety Plans (CRSP), and Local Road Safety Plans (LRSP) are good places to start to identify focus crash types. Emphasis areas may include high-level crash categories (focus crash types) such as roadway departure, intersections, pedestrians, impaired driving, or speeding. From here, an analyst might define the focus crash type as "fatal and serious injury roadway departure crashes." Another focus crash type might include fatal and serious injury pedestrian crashes. Once an agency identifies focus crash types, there is a need to further identify focus facility types and risk factors.
Focus facility types are roadways on which the focus crash type most frequently occurs. For instance, fatal and serious injury roadway departure crashes may occur most frequently on rural, two-lane undivided roads. Risk factors are characteristics associated with locations where targeted crash types occurred. For example, risk factors for fatal and serious injury roadway departure crashes on rural, two-lane undivided roads may include presence of horizontal curves, narrow pavement width, and steep roadside slopes.
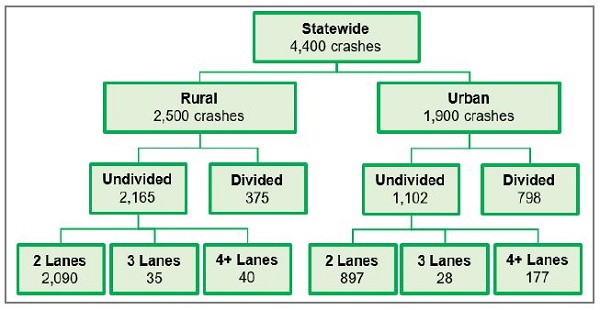
Crash trees are a useful tool to help identify focus facility types and potential risk factors for further analysis. A crash tree is a visual representation of crashes, where each branch represents a variable of interest. The flow chart above is an example crash tree for statewide fatal and serious injury roadway departure crashes. The variables of interest are area type (rural or urban), median type (undivided or divided), and number of lanes (2, 3, or 4+).
Typically, focus facility type represents the greatest number of focus crashes. In the example crash tree provided above, the crash tree indicates that of the 4,400 statewide fatal and serious injury roadway departure crashes, 48 percent occurred on rural, two-lane undivided roads, which could be selected as the focus facility type.
From a systemic perspective, this helps narrow the area of interest and number of potential miles to treat while still including a large number of crashes. Analysts might also consider exposure (i.e., the number of miles represented by each potential facility type) to detect over-representation. For example, the crash tree shows that nearly 50 percent of fatal and serious injury roadway departure crashes occurred on rural, two-lane undivided roads. If rural, two-lane undivided roads represent 40 percent of the network, then this suggests a good opportunity to impact safety.
Crash trees should start with a trunk and branch out into subsets of crashes. Each variable of interest becomes a new branch and each branch should support subsequent branches. Specifically, core branches should represent those variables with fewer categories. It is useful to start with binary variables, such as area type (rural or urban) or crash location (intersection or non-intersection), before branching into variables with several categories such as posted speed limit or number of lanes.
Branches may include roadway-, traffic-, or crash-related variables. It is useful to develop crash trees with focus facility types or risk factors in mind. Thinking about the focus crash type (e.g., fatal and serious injury roadway departure crashes) and focus facility type (e.g., rural, two-lane undivided roads), potential risk factors might include surface type, lane width, shoulder width and type, roadway alignment, surface condition, light condition, and roadside features. It may be useful to develop crash trees to explore these potential risk factors.
Traditionally, developing crash trees includes using pivot tables to summarize crashes by combinations of variables, manually transcribing results to text boxes, and connecting the boxes with connector lines. This time-intensive process presented an opportunity for automation.
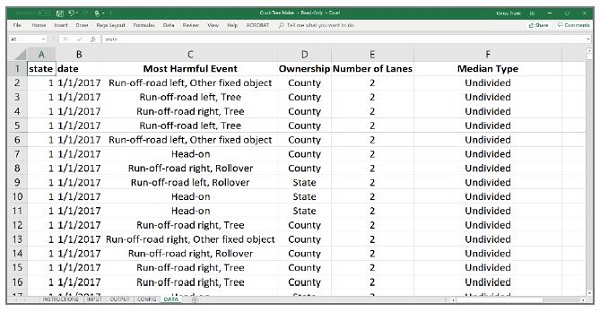
In response, FHWA developed the Crash Tree tool to automate creating crash tree diagrams. The Crash Tree tool is a spreadsheet application that allows users to import crash data, select variables of interest, and generate crash trees. The images provided show screenshots of the data, input, and output tabs. The data tab shown on page 6 allows users to import the data set of interest. The variables can be text or numeric values, but each row should represent an individual crash and each column a potential variable of interest.

The input tab on the left, allows users to define the study area and study period and filter variables of interest from drop-down menus. The study area field is useful for generating crash trees for specific regions, counties, or local agencies within a larger (e.g., statewide) data set. Start and end years are useful for defining a narrow study period when the data set includes several years of data. Filters represent branches of the crash tree, where filter 1 is the first branch, followed by filter 2, filter 3, and so forth. After specifying parameters for the crash tree, users can click Generate Crash Tree and view results on the output tab.
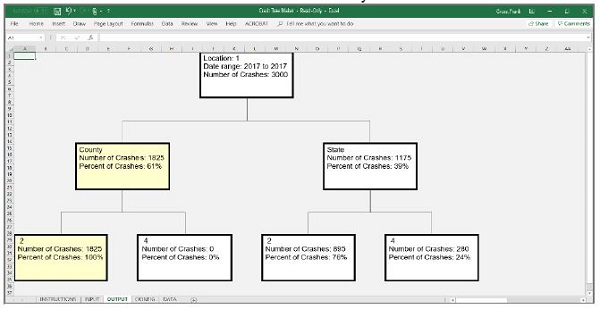
The output tab on page 7 shows the crash tree diagram. Note this crash tree only shows two variables of interest (ownership and number of lanes). If filter 3 (most harmful event) was included, as shown in the screenshot on the previous page, the crash tree output would include one more row of branches with a summary of crashes by most harmful event.
Crash tree diagrams support the systemic safety analysis process to help you identify and select facility types where focus crash types most frequently occur and explore potential risk factors. The Crash Tree tool, user guide, and training video are available for free from the National Center for Rural Road Safety.
For training or technical assistance on the systemic safety analysis process, including the Crash Tree tool, contact Karen Scurry or Jerry Roche from the FHWA Office of Safety at Karen.scurry@dot.gov or jerry.roche@dot.gov.
By: Danielle Betkey, FHWA Office of Safety
Is the time approaching for your State to begin updating your Strategic Highway Safety Plan (SHSP)? Well, if so, now is the perfect time to think about EVALUATION!
Why, you ask? Besides being a requirement, evaluations provide an easy, straightforward way to determine the effectiveness of your SHSP. The success of an SHSP depends on a program of data-driven safety priorities and proven, effective strategies. Evaluation will help you achieve this goal by analyzing the SHSP process and performance and determining if current activities should be enhanced, revised, or replaced.
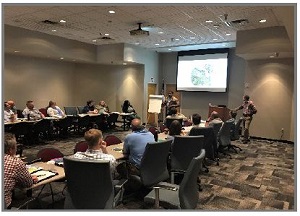
So, do we have your attention yet? Well, it gets better! To help you begin the SHSP evaluation process, the FHWA Office of Safety is offering a FREE workshop specifically tailored to your State's needs. The workshop is based on the SHSP Evaluation Process Model (EPM), which helps answer some basic questions about evaluation, including:
Evaluation also strengthens buy-in, showing stakeholders and elected officials that safety investments are generating results and addressing safety through an evidence-based process. It is important to remember that evaluation provides feedback on both positive and negative results, which can lead to course corrections and an improved return on safety investments.
What are some of the benefits of having a workshop in your State, you ask? The answer is easy—it provides a great opportunity to bring together your infrastructure and behavioral partners to:
If you are still wondering if hosting an SHSP EPM workshop in your State would be beneficial, here are testimonials from Tennessee, Colorado, and Kentucky—States that have all hosted successful SHSP EPM workshops.
Here's what Jessica Rich, safety engineer, from the FHWA Tennessee Division office had to say:
"Tennessee adopted its first SHSP in 2004 and has revised the plan three times since inception. In August 2018, Tennessee began the process of updating its SHSP and felt the SHSP EPM workshop would be good for the process. Therefore, Tennessee hosted the workshop in March 2019 to fully evaluate the process for updating the SHSP, analyze areas of improvement, and develop new ideas. Participants included Tennessee Department of Transportation (TDOT), Tennessee Highway Patrol, Tennessee Highway Safety Office, University of Tennessee's Center for Transportation Research, and four of the 11 metropolitan planning organizations (MPO). The workshop helped make Tennessee more aware of areas of improvement among the agencies involved. Some of the recommendations included developing an executive SHSP committee in addition to the SHSP committee that meets quarterly, conducting workshops on the SHSP at the annual highway safety and operations conference and the State MPO conference, and developing an SHSP communications plan. There are also plans underway to have mini-SHSP meetings in the four TDOT regions for local law enforcement, engineers, etc., to make them more aware of the SHSP and discuss local safety issues."
Still need more reasons to host an SHSP EPM workshop? Here's what Dahir Egal, safety engineer, from the FHWA Colorado Division office had to say:
"The evaluation was very useful to safety stakeholders and came at an opportune time to coincide with the beginning of the next cycle of the SHSP update…lessons learned from the workshop and results of the evaluation will be incorporated into the development of the next update."
– Dahir Egal, safety engineer, FHWA Colorado Division
"The Colorado Division hosted the SHSP EPM workshop in June 2019. Workshop participants included representatives from a large contingent of Colorado SHSP stakeholders, including steering committee members and representatives from National Highway Traffic Safety Administration (NHTSA), Colorado Department of Transportation (CDOT), Colorado Department of Revenue (CDOR), MPOs, Transportation Planning Regions (TPR), and others. The purpose of the workshop was to bring together steering committees, emphasis-area teams, and other stakeholders to collectively take a hard look at processes and performance outcomes of the current SHSP. The result of this workshop determined how effective the SHSP really was and what enhancements and revisions were needed to make it better.
"The evaluation was very useful to safety stakeholders and came at an opportune time to coincide with the beginning of the next cycle of the SHSP update. Since the task of any evaluation can be complicated and far reaching in scope, CDOT narrowed down objectives of the workshop and was keenly interested in focusing on certain areas. First, it wanted to review the process followed by CDOT back in 2014, when the update was being put together, and determine if there were any gaps or missed opportunities for identifying and reaching out to key safety stakeholders in the State. Second, CDOT was interested in briefly reviewing how the SHSP aligned with or complemented other plans, including the Highway Safety Improvement Program (HSIP), Highway Safety Plan (HSP), Commercial Vehicle Safety Plan (CVSP), Long Range Transportation Plan (LRTP), and Statewide Transportation Improvement Program (STIP). The third objective of the evaluation was to broadly examine and conduct a high-level overview of how data-driven methodologies were used to set safety targets, identify problem areas, arrive at a set number of emphasis areas, and assign countermeasure strategies to each area. The final objective was to identify the weakest aspects of the SHSP and come up with improvement recommendations that include safety countermeasures that are specific, measurable, achievable, realistic, and time bound. It is important to note the evaluation confirmed a lack of SHSP implementation as the key flaw in the 2014–2019 Colorado SHSP. In conclusion, the success of the workshop may have been best defined by the many takeaways for CDOT and stakeholders to develop a much-improved SHSP update in 2019. Lessons learned from the workshop and results of the evaluation will be incorporated into the development of the next update."
And lastly, here's what Ryan Tenges, safety engineer from the Kentucky FHWA Division office had to say:
"Of particular utility was strategic planning process guidance we used in focus groups, terminology and plan outline recommendations, and example graphics conveying technical information in an easily understandable and compelling way."
– Ryan Tenges, safety engineer, FHWA Kentucky Division
"In August 2019, highway safety stakeholders participated in the SHSP EPM workshop, which was designed to assist Kentucky in determining the effectiveness of its SHSP and to identify what changes could be made before its next plan update. The workshop included a presentation on the general strategic planning process—definitions and examples of basic elements—as well as specific advice regarding steps in the process. It included guidance on roles and responsibilities of each leadership group—the executive committee, steering committee, and emphasis-area task forces—and methods and templates the various groups could use to set objectives and monitor progress.
"The facilitator provided valuable examples of planning strategies that have worked well in other States and those that can be improved upon. Informational materials from other States were presented with an eye toward effective communication. Recommendations were given for approaches to educating the public and other stakeholders on highway safety initiatives beyond the strategic plan document itself: websites dedicated to SHSP messaging and one- and two-page flyers with effective branding strategies and concise messages disseminated at meetings and public events.
"It was very helpful to get feedback on the process at an early stage of the development of Kentucky's new SHSP. It was clear the safety community not only learned a good deal from the workshop, but also from the Kentucky perspective as well. Of particular utility was strategic planning process guidance we used in focus groups, terminology and plan outline recommendations, and example graphics conveying technical information in an easily understandable and compelling way."
As you can see, several States have already benefited from the SHSP EPM workshop. The workshop is a great way to bring safety stakeholders together to discuss the SHSP and begin preparing for the update process.
If you are interested in hosting a workshop in your State or would like more information, please contact Danielle Betkey at Danielle.Betkey@dot.gov or 202-366-9417.
By: Esther Strawder, FHWA Office of Safety
Now Available: Second U.S. Roadway Safety Data Capability Assessment (CAP2) Final Report!
The first Roadway Safety Data Capability Assessment concluded with results showing a need for more training, guidance, technical assistance, and resources to improve crash, roadway inventory, and traffic data. It also gave FHWA an opportunity to develop a new Roadway Safety Data Program (RSDP) to meet the needs of States that want to improve their roadway safety data. The second assessment allowed FHWA to measure progress to date and identify ways to enhance RSDP in new areas such as safety performance management. Based on the assessment, the nation is gradually improving in most areas of safety data collection, analysis, integration, and management.
The project's final report provides an overview of key CAP2 assessment findings. While each State is unique, there are commonalities in the final results:
Based on the action plans, States want to improve their current roadway safety data capabilities and take necessary steps to achieve desired performance levels. States indicated the desire to improve in most areas of the assessment. Particularly noteworthy, improvements are needed in data quality management; data governance policies, roles, and responsibilities; countermeasure selection; and performance management analytic capabilities. These findings will help FHWA address key needs for States identified in the assessment. Thirty States also participated in three CAP2 peer exchanges during summer 2019 to offer more detailed input on refining and expanding resources available through the RSDP, and to promote States' noteworthy practices and programs.
For more information, visit https://safety.fhwa.dot.gov/rsdp/downloads/rsdp_usrsdca_final.pdf or contact Esther Strawder at esther.strawder@dot.gov.
By: Rosemarie Anderson, FHWA Office of Safety, and Jennifer McCabe, ARA
You may think "the road less traveled" is a safer one, but of all people killed in traffic crashes in 2017, about half died from crashes on rural roads.
To combat this deadly problem, the FHWA is promoting proven, affordable solutions to agencies nationwide.
Many local transportation practitioners may feel they don't have the money, time, or technical expertise to deploy extensive safety countermeasures on local and rural roads. When applied using a systemic approach, the cost savings can be significant.
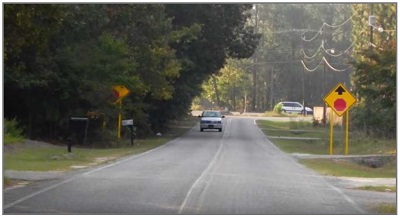
FHWA's proposed countermeasures, including enhanced signage, pavement markings, speed management techniques, crosswalk enhancements, sidewalks, and road diets, offer significant safety improvements for relatively low investment.
See the Big Picture
Thousands of local and Tribal agencies struggle with improving rural road safety. These unique roads widely vary—straight, winding, paved, unpaved—and may travel through any terrain, from mountains to farmland. Crashes in rural areas tend to be widely dispersed, which can delay emergency response.
In these areas, the key to evaluating where and what to invest in is to use data to prioritize locations and countermeasures that will best mitigate risk.
A systemic approach, recommended by FHWA, evaluates risk across an entire roadway system rather than only looking at specific crash locations. This takes a proactive approach to safety rather than a reactive one. This is especially valuable for rural road systems, where risk may be spread over many miles of roadway, painting a misleading picture of safety due to low crash density.
Low Cost, High Impact
Pavement markings are one of the least expensive countermeasures available to improve safety. They can help drivers stay in their lanes, stop at intersections, become aware of approaching curves or pedestrian crossings, and encourage slowing down.
"Pavement markings can be used to create lane narrowing which makes the driver feel more constrained and slow down," said Shaun Hallmark, director of Iowa State University's Institute for Transportation.
The South Carolina Department of Transportation (SCDOT) has demonstrated the benefit and affordability of the systemic approach of these countermeasures. SCDOT identified and targeted more than 2,000 locations across the State to receive improvements, mostly in the form of pavement markings and updated signing. The State wanted to reduce frequency and severity of crashes at stop-controlled intersections by alerting drivers to the presence and type of approaching intersection.
"In the past, our typical approach was to treat hot spot locations which may involve a new signal or a left-turn lane," said Joey Riddle, SCDOT safety program engineer. "The total cost of these projects was roughly half a million dollars. The systemic approach allowed us to treat 80 similar projects for nearly the same price as one."
A History of Success
The proposed countermeasures FHWA recommends for these roads come with a proven track record. Basic signing improvements—advanced warning signs, speed plaques, and chevrons—alert drivers to upcoming curves and intersections. A simple 3-year before-and-after analysis of the Pennsylvania Department of Transportation's (PennDOT) efforts to enhance delineation and make other corrections at curves showed that overall crashes dropped 17 percent, major injury crashes went down 40 percent, and fatal crashes reduced 44 percent.
Did you know that adding edge lines can reduce total crashes by 15 percent and severe crashes by 19 percent? Adding these, or other longitudinal pavement markings, should be considered, even in locations where due to low traffic volumes they may not be required.
"Edge lines are considered especially effective because that is where a driver will tend to look when they are drowsy or trying to avoid the glare from an oncoming car," said FHWA Transportation Safety Engineer Cathy Satterfield.
Increasing the width of edge lines is another trend that is successfully improving safety on rural roads. In Kansas, Michigan, and Illinois, using 6-inch edge lines in place of standard 4-inch edge lines has reduced non-winter crashes on two-lane rural roads by 15 to 30 percent, and fatal or injury non-winter crashes by 15 to 37 percent.
Low-cost solutions can also combat pedestrian crashes along roadways, where more than 6,000 people are killed each year. Installing sidewalks and paved shoulders can reduce pedestrian-involved crashes by up to 89 percent. Numerous low-cost improvements can also enhance pedestrian safety—crosswalks, pedestrian hybrid beacons, rectangular flashing beacons, medians, pedestrian refuge islands, and road diets.
Learn More
FHWA created a series of six short videos, entitled Low-Cost Safety Improvements, to help practitioners incorporate road safety into their existing responsibilities. In the videos, learn about low-cost safety improvements designed to make stop-controlled intersections, curves, unpaved roads, walking, and biking safer. The videos also highlight the use of pavement markings and speed management techniques to improve safety on a small budget.
To learn more, contact Rosemarie Anderson at rosemarie.anderson@dot.gov.
By: Robert Accetta, NTSB Investigator in charge, Office of Highway Safety, and Amy Terrone, NTSB Safety Advocate
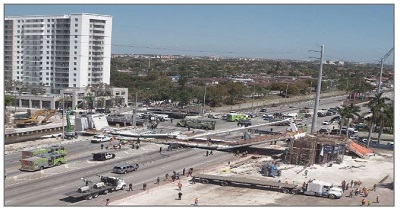
On March 15, 2018, a partially constructed pedestrian bridge crossing an eight-lane roadway in Miami, Florida, in Miami-Dade County, experienced a catastrophic structural failure in the nodal connection between truss members 11 and 12 and the bridge deck. The 174-foot-long bridge span fell about 18.5 feet onto the street below. Eight vehicles under the bridge were crushed, and six people died, including a bridge worker. Ten others were injured.
The pedestrian bridge was under construction as part of the Florida International University (FIU) UniversityCity Prosperity Project. On the day of the collapse, a construction crew was working on retensioning the post-tensioning rods within member 11, connecting the bridge canopy and the deck at the north end.
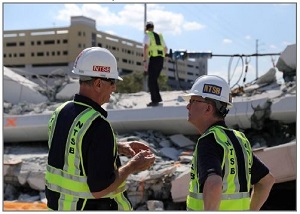
In October, the National Transportation Safety Board (NTSB) determined the probable cause of this tragic accident was load and capacity calculation errors made in the design of the main span truss member 11/12 nodal region and connection to the bridge deck. Contributing to the collapse was an inadequate peer review, which failed to detect the calculation errors in the bridge design.
While the span was being prefabricated in a construction yard next to the roadway before it was placed over the roadway, workers had documented cracks on the north and south end of the bridge. After the bridge span was moved and placed onto the piers and the diagonal supports 2 and 11 were detensioned, cracks at the north end 11/12 nodal region continued to widen. During its post-accident investigation, NTSB found the cracks were more than 40 times larger than the maximum considered acceptable in a pre-stressed reinforced concrete bridge. The engineer of record's failure to identify the significance of structural cracking observed in this node before the collapse, and failure to obtain an independent peer review of the remedial plan to address the cracking, further contributed to the collapse.
Additionally, the failure to cease bridge work and close SW 8th Street to protect public safety contributed to the severity of the collapse outcome.
Through its investigation, NTSB made 30 significant findings–but four key safety issues stood out:
Based on its investigation of the bridge collapse, NTSB issued 11 safety recommendations in total, with one issued to the Federal Highway Administration (FHWA). Specific to actions the FHWA should take to help prevent such a future accident, the NTSB recommended that FHWA assist AASHTO with developing a requirement that concrete bridge structures be designed with reasonable estimates for interface shear demand, the cohesion and friction contributions to interface shear capacity, and the clamping force across the interface shear surface.
To read the final report and all the related recommendations, visit the accident page on the NTSB website. To view the board meeting presentations, visit the event summary page on the NTSB website.
By: Adam Larsen, FHWA Tribal Transportation Program
The Sisseton Wahpeton Oyate (SWO) Tribe of the Lake Traverse Reservation is improving roadway safety through systemic application of two proven safety countermeasures: edge-line rumble stripes and multiple low-cost countermeasures at stop-controlled intersections.
Through a grant from the FHWA Tribal Transportation Program Safety Fund (TTPSF), provided through the FHWA Office of Tribal Transportation, the SWO Tribe installed 30.6 miles of narrow-width (8-inch) rumble stripes on roadways with little or no shoulder, and installed multiple low-cost countermeasures at 13 rural, stop-controlled intersections. Similar to the Highway Safety Improvement Program (HSIP), projects funded by the TTPSF must be data driven and identified in a transportation safety plan.
The SWO Tribe developed a transportation safety plan using the five-step process developed by the University of Wyoming, combining crash data and qualitative field observations to identify not only high-crash locations but also systemic safety risks. This study evaluated crash data from 2004–2013 and found 1,065 recorded crashes for the SWO Tribe. Thirty percent of these crashes resulted in injury and 3 percent were fatal, compared to all crashes in South Dakota, in which 24 percent involved an injury and only 1 percent resulted in fatalities. Among the crash data for the Lake Traverse Reservation, 46 percent of reported crashes were off-roadway crashes, which align with the crash experience in the rest of South Dakota. There was also a high instance of intersection-related crashes (20 percent of all crashes on the Lake Traverse Reservation).
The resulting SWO Roadway Safety Improvement Plan identifies safety improvements both to address locations and risks. High-crash concentrations are identified at several intersections on the reservation. These locations received safety enhancements, including installation of oversized stop signs, supplemental installation of a left-side stop sign, LED-flashing borders around stop signs, advanced transverse rumble strips, and stop-ahead warning signs.
The crash data also identified roadway departure as a concern, but such crashes were scattered across the roadway network rather than at a specific location. As a result, the plan recommends systemic improvement on corridors with the highest risk for fatal or serious injury roadway departure crashes. Systemic improvements include enhanced signing and rumble-stripe installations, such as those recently installed with the TTPSF grant.
Cliff Eberhardt of SWO reflected on the project saying, "The SWO Roadway Safety Improvement Project has been a very popular project for the Lake Traverse Reservation. With the safety funds, we were able to create a stand-alone project which was geared specifically toward transportation safety. We have already seen some results from the project and hope to include other routes in the near future. We have a long way to go with transportation safety projects on the Lake Traverse Reservation."
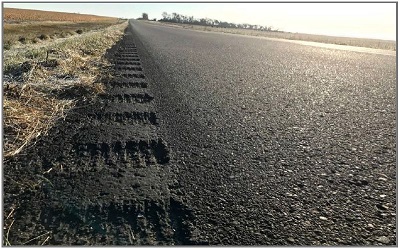
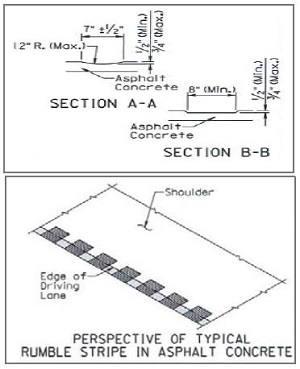
In the United States, rumble strips and stripes have been extensively deployed with great success along major highways with wide shoulders. Such installations usually consume 12 inches of paved surface on the roadway shoulder and allow an average vehicle's tire to completely drop within the rumble strip. However, rumble strips are an innovative feature on rural roadways where little or no shoulder is available. SDDOT has been partnering with county and Tribal governments to deploy rumble stripes on roadways where the typical section consists of two 12-foot lanes, no shoulder, and a ditch at the edge of pavement. Such installations consist of a rumble strip that is 8 inches wide and painted with a 4-inch-edge-line stripe.
Andy Vandel of SDDOT stated, "Rural local roads account for 85 percent of all roadway miles and 26 percent of all severe crashes in South Dakota. In order to reach our goal of reducing fatal and serious injury crashes, proven low-cost safety improvements must be deployed systemically."
According to the national Tribal Transportation Strategic Safety Plan, more than 60 percent of fatal crashes in Tribal areas involve roadway departure. FHWA recommends transportation safety plans developed by Tribes address roadway departure and other topics identified in the national Tribal Transportation Safety Plan. Among the recommendations in the plan, FHWA encourages Tribes to pursue systemic application of low-cost countermeasures to combat roadway departure crashes.
For more information, contact Adam Larsen at adam.larsen@dot.gov.
By: Becky Crowe, FHWA Office of Safety
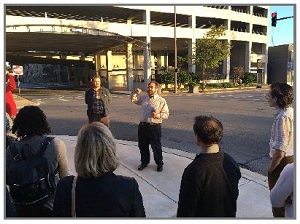
The National Highway Traffic Safety Administration (NHTSA) released data in October 2019 announcing that pedestrian fatalities increased 53 percent between 2009 and 2018. Soon after, the FHWA and America Walks convened representatives from seven cities to discuss FHWA's Safe Transportation for Every Pedestrian (STEP) program and share best practices for improving pedestrian safety. Participants discussed a wide range of strategies, including partnerships with public health agencies, innovative crash data analysis approaches, corridor studies focused on pedestrian crossings, and leveraging State agency maintenance activities to improve safety locally. Attendees came from Ann Arbor and Flint, Michigan; Charleston and Myrtle Beach, South Carolina; Knoxville, Tennessee; Richmond, Virginia; Chapel Hill, North Carolina; and Little Rock, Arkansas.
The City of Little Rock hosted the event on October 23 and 24, beginning with a walking tour through downtown and the riverfront; the peer exchange included other walking tours of local transportation projects and corridors. Most of the cities' attendees had been meeting for more than a year via conference calls, as part of America Walks' Road to Zero program. The peer exchange in Little Rock was the first opportunity for attendees to meet in person and be joined by staff from Ann Arbor and Charleston–two cities known for innovative and inclusive approaches to improving pedestrian safety.
Earlier in 2019, three other States hosted pedestrian safety peer exchanges. Participants at these events and the Little Rock meeting discussed several common issues. City staff discussed the challenges and benefits of implementing STEP countermeasures. Attendees who did not represent government agencies asked where to find and how to use crash data to better advocate for pedestrian safety. Participants agreed that saving the lives of people walking along and crossing roads is an urgent but complex issue.
Following the death of students crossing busy roads in Morgantown at West Virginia University (WVU), stakeholders came together in June 2019 to identify opportunities for improving pedestrian safety locally. The peer exchange included members of the Morgantown Pedestrian Safety Task Force, the West Virginia Division of Highways (WVDOH), FHWA, WVU, the West Virginia Local Technical Assistance Program (LTAP), elected officials, and representatives of similarly sized municipalities in the region. The 2-1/2-day event included a Road Safety Audit (RSA) of one of Morgantown's high-concern corridors. Peer exchange participants agreed it would be beneficial to standardize RSAs in future corridor studies for pedestrian safety improvements.
In late August 2019, more than 40 participants from more than 20 agencies across Arizona met to share experiences and ideas for improving pedestrian safety in the State. The Arizona STEP team—comprised of volunteers and staff from cities, Arizona Department of Transportation (ADOT), and the FHWA Arizona Division office—organized the peer exchange in Phoenix. Following a series of presentations from transportation agencies, participants met in groups of small and midsized cities, large cities, metropolitan planning organizations (MPO), and Tribal groups to discuss common challenges and opportunities for improving pedestrian safety. Juan Guerra, an engineer from the City of Nogales, Arizona, applauded FHWA and ADOT for organizing the event. "I learned that while every community has a different culture in regard to pedestrian and biking facilities, in the end we all (small, medium, and large cities) face the same issues to address so many pedestrian and bicycle needs that grow according to the population growth."
The Illinois Department of Transportation (IDOT) organized a pedestrian safety peer exchange that included more than 100 participants across Illinois and from several adjoining states, including Missouri, Michigan, and Indiana. The 2-day event occurred in September in Champaign, Illinois. Presentations described approaches to using data for making decisions, the role of speed in pedestrian safety, and options for funding pedestrian safety improvements. Days before the event, the Illinois Center for Transportation released a report on U.S. policies for the installation of pedestrian hybrid beacons (PHB)—one of STEP's countermeasures. The report and speaker presentations challenged attendees to quickly advance improving pedestrian safety at crossings.
If your agency is interested in hosting a STEP peer exchange or learning more about resources available through the STEP program, contact Becky Crowe (FHWA Office of Safety) at rebecca.crowe@dot.gov. To request a STEP workshop or additional training, contact Peter Eun (FHWA Resource Center) at peter.eun@dot.gov.
By: Kristen Brookshire, University of North Carolina Highway Safety Research Center, and Becky Crowe, FHWA Office of Safety
If you teach them, they will come. That was our motto as we updated the Federal Highway Administration (FHWA) Bicycle and Pedestrian Transportation University Course. Thousands of universities, junior, technical, and community colleges offer foundational coursework for future transportation practitioners. They play a critical role in preparing future professionals to address transportation challenges and building skills they'll need on their first day of work and throughout their careers. There are more than 300 accredited civil engineering programs in the U.S. and nearly 100 accredited graduate or undergraduate degree programs in planning. The new course provides educators with the tools they need to inspire thousands of students to support safe and vibrant multimodal transportation systems.
"The FHWA Bicycle and Pedestrian Transportation University Course is designed to help students recognize the legitimacy of bicycle and pedestrian modes; understand how policy, planning, and engineering practices can be improved to create a more balanced transportation system; and become familiar with basic policies, practices, tools, and design principles that can be used to create bicycle and pedestrian-friendly communities."
– Rebecca Crowe, FHWA Office of Safety
The FHWA Bicycle and Pedestrian Transportation University Course is designed to help students recognize the legitimacy of bicycle and pedestrian modes; understand how policy, planning, and engineering practices can be improved to create a more balanced transportation system; and become familiar with basic policies, practices, tools, and design principles that can be used to create bicycle and pedestrian-friendly communities. The course content fits concisely within planning and engineering programs, and is relevant for courses in policy, public health, public administration, or landscape architecture.
The FHWA course update includes pedestrian and bicycle course materials broadly applicable to diverse student audiences and learning styles and adaptable to instructor needs and contexts. The FHWA course offers a solid starting point for someone new to teaching bicycle and pedestrian topics and should provide a quick reference for those who already teach these topics, but want a source for new resources, images, and examples. The materials can also be used for self-directed learning by those who already work in the transportation field.
The FHWA course contains 21 presentations with detailed speaker notes and complementary assignments, readings, and videos. Most of the individual lessons fit into one of these six broader topics:
An example of the breadth and depth of content in a lesson is demonstrated in the module entitled Safety Analysis. This lesson introduces current methods and challenges for measuring safety for pedestrians and bicyclists. The module covers specific topics like crash data analysis and interpretation, tools for countermeasure selection, safety effectiveness evaluation, and the roadway safety management process. Most lessons include at least one case study example. In this lesson, Washington, DC's use of leading pedestrian intervals (LPI) at all eligible locations is an example that illustrates a system-wide approach to improving safety. The recommended assignment for this module is a network screening exercise that includes a data set of roadway segment characteristics from a large U.S. city. Students are asked to sort the data using different measures of safety and discuss the differences.
The course materials and an informational webinar are available for download at www.pedbikeinfo.org/FHWAcourse. If you're already using the materials and equipping our future generations of practitioners, please contact Becky Crowe at rebecca.crowe@dot.gov and share your experiences of how you're bringing the next generation into the transportation field.
By: Clayton Chen, FHWA Office of Safety Research and Development
The Interactive Highway Safety Design Model (IHSDM) 2019 public release (version 15.0.0) is now available on the IHSDM home page. The FHWA held a Data-Driven Safety Analysis (DDSA) webinar on November 7 to introduce the new release. A recording is available at http://www.ihsdm.org/wiki/IHSDM_2019_Web_Conference.
What is IHSDM?
Supporting FHWA's DDSA initiative, the IHSDM is a suite of safety analysis tools designed to evaluate the safety and operational effects of project-level geometric design decisions on highways. The IHSDM Crash Prediction Module (CPM) serves as a faithful implementation of Highway Safety Manual (HSM) Predictive Methods (part C) for two-lane rural highways, multi-lane rural highways, urban and suburban arterials, freeways, and ramps/interchanges. The complete IHSDM suite consists of six evaluation modules and the IHSDM Economic Analyses Tool. The software is available for download at no cost.
What's New in the IHSDM 2019 Release?
How Do I Obtain the 2019 Release?
Whom Do I Contact for IHSDM Technical Support?
Contact the IHSDM technical support team at IHSDM.Support@dot.gov or 202-493-3407. The IHSDM home page includes information related to the IHSDM user group, case studies/user applications, past webinar materials, and frequently asked questions.
By: Charles Fay, FHWA Office of Safety Research and Development

The SHRP 2 Naturalistic Driving Study Pooled Fund: Advancing Implementable Solutions, managed under the Transportation Pooled Fund program, is sponsoring new research using data from the second Strategic Highway Research Program (SHRP 2) Naturalistic Driving Study (NDS). The research will address priority topics in the areas of highway safety, operations, and planning. The FHWA is leading the pooled fund with very active participation from State departments of transportation (DOT) partners in determining the research to be undertaken. State DOT partners include Alabama, Connecticut, Illinois, Iowa, Nevada, and Washington. Within FHWA, three offices are participating: Office of Operations; Office of Planning, Environment, and Realty; and Office of Safety Research and Development.
SHRP 2 has been a partnership among FHWA, the American Association of State Highway and Transportation Officials (AASHTO), and the Transportation Research Board (TRB). SHRP 2 had four focus areas: safety, capacity, reliability, and renewal. The safety focus area produced a one-of-a-kind data set of value to highway practitioners and researchers from many fields including, but not limited to, operations and planning.
These data are referred to as the SHRP 2 NDS database and SHRP 2 Roadway Information Database (RID). Together, these data provide previously unavailable information to the highway community on how people actually drive and use the roadway system in real-world conditions. The NDS data provide information on drivers and driving behavior, individual trip characteristics including events (crashes and near-crashes) and normal driving non-events (exposure data), and vehicle characteristics and performance.
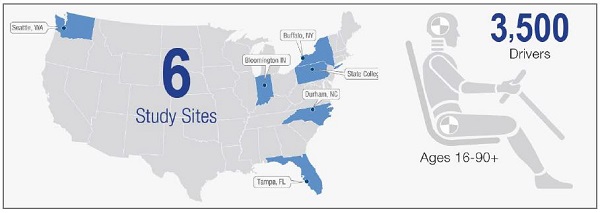
The SHRP 2 RID is a geospatial database that provides additional contextual information for the SHRP 2 NDS trips, including roadway characteristics and features that have been collected consistently and to the same data specification in the six NDS study States, crash histories, traffic volumes, general weather conditions, 511 information (including work zones) and railroad crossings. The RID is linkable to the NDS trip data and provides previously unavailable information to researchers on how drivers interact with various elements encountered on these trips. The RID, which contains seven years of crash histories for the six NDS States mentioned below, is also a stand-alone research tool for highway safety researchers, even without the NDS data, since these crashes can be matched to infrastructure characteristics and features. In the SHRP 2 NDS, 3,500 volunteer participants (females and males, ages 16-90+) in six U.S. locations (FL, IN, NC, NY, PA, WA) had their vehicles outfitted with small video cameras, radar, GPS, and other sensors that continuously collected data (ignition on to ignition off) as they went about their daily driving tasks. The majority of participants were in the study for 1-2 years. In total, 5.5 million trips were continuously recorded, resulting in more than 30 million miles traveled and millions of hours of video and other sensor data recorded. Hundreds of crashes and thousands of near-crashes were captured and recorded. Altogether, 2 petabytes of driving data were collected.
The Technical Advisory Committee (TAC) for the pooled fund issued a request for proposals spanning highway safety, operations, and planning research. Twenty-five projects were proposed totaling approximately $8 million. The TAC had $2.1 million available and picked the six projects for research described below. Project deliverables will focus on providing the highway practitioner with actionable results through guidelines, recommendations, and/or practitioner-friendly tools.
Projects include:
Validation of Performance-Based Design
Validation of Performance-Based Design (PBD) has mainly focused on crash data, expected crashes, or microsimulation. SHRP 2 NDS data provide a unique and unprecedented opportunity to broaden the validation of PBD. The objective of the proposed exploratory research is to use safety surrogates obtained from SHRP 2 NDS trips and event data to validate performance-based design practices on curves on rural two-lane roadway segments.
Investigating How Multimodal Environments Affect Multitasking Driving Behaviors
This study will us the SHRP 2 NDS data to examine multitasking behaviors when drivers are in environments that include large numbers of pedestrians and cyclists. Multitasking behavior refers to any secondary activity not related to the primary driving task, such as engagement in mobile devices, eating, drinking, and talking to passengers. More specifically, this study will focus on: (1) the likelihood of drivers engaging in (or disengaging from) secondary task activities given the presence of pedestrians and cyclists and (2) the effect of different types of crosswalks and bike lanes (including pavement markings and signage) on secondary task activities.
Developing Speed Crash Modification Factors (CMF) Using SHRP 2 Data
The objective of this project is the development of speed-related CMFs for the Highway Safety Manual crash prediction models. The SHRP 2 RID contains roadway and crash data for six States in the U.S. The National Performance Management Research Data Set (NPMRDS) database contains travel time data for 5-minute epochs for the National Highway System (NHS). Linking these two databases provides a rich source of data with roadway, crash, and operating speed characteristics, thereby allowing research on the effect of operating speed and/or operating and posted speed differentials on crash frequency and/or crash severity.
Incorporating the Impacts of Driver Distraction into Highway Design and Traffic Engineering
The objective of this research is to leverage the SHRP 2 NDS data to examine and quantify the impacts of driver distraction on perception-reaction time and deceleration rate, two key performance measures for highway design and traffic engineering. This study will examine perception-reaction time and deceleration rate under several contexts, such as freeways, two-lane highways, and signalized intersections, and develop recommendations for how existing assumptions can be calibrated for applications across a range of settings, including different facility types (e.g., freeways, two-lane highways, signalized intersections).
Verification and Calibration of Microscopic Traffic Simulation Using Driver Behavior and Car-Following Metrics for Freeway Segments
The main objective of the project is to leverage microscopic driving behavior and car-following metrics directly derived from the SHRP 2 NDS data to develop guidelines to assist and enhance calibration and verification of microscopic traffic simulation. This project is intended to provide practitioners and researchers with new criteria to evaluate simulation from a microscopic point of view, complementing typical calibration efforts for macroscopic performance measures.
Freeway Guide-Sign Performance at Complex Interchanges: Reducing Information Overload
Complex freeway interchanges are known to be difficult to navigate. This study seeks to provide detailed and performance-based guidelines for guide-sign design at freeway interchanges. The study will examine freeway interchange guide-sign information overload thresholds by roadway, traffic, background, and visibility conditions, and the impacts of sign complexity on driver behavior relevant to safety.
Webinars will be provided for the research community at the initiation of these projects during the first quarter of 2020, as well as after the projects have completed in 2022, along with other tech transfer activities.
For further information on these projects or the SHRP 2 Naturalistic Driving Study Pooled Fund: Advancing Implementable Solutions, please contact Charles Fay at FHWA's Turner-Fairbank Highway Research Center at charles.fay@dot.gov.
By: Thomas Elliott, FHWA NHI, and Christine Kemker, contractor for the NHI
Much has changed since Eisenhower's interstate era. The American Association of State Highway and Transportation Officials (AASHTO) initiated a national highway research program in 1962, the Bureau of Public Roads became the FHWA in 1966, and the National Highway Institute (NHI) began training transportation industry professionals in 1970. There have been numerous advances in technology, in both how roads are built and the vehicles that drive on them.
But while there's often hubbub over intelligent transportation systems and self-driving cars, we're still a long way off from a nation of automated drivers. That means considering the human user in road design and operations is still essential for safe roads.
"By taking this safety training, non-experts in human factors can more effectively integrate the capabilities and limitations of road users into their design and operations practices."
– Thomas S. Elliott, FHWA, Training Program Manager
While it's broadly understood that highway safety relies on consideration and integration of three components (the road, vehicle, and road user), the human factor is often forgotten in road design and traffic engineering. The neglect of human factors in highway design is not intentional, but typically comes from lack of knowledge and practice around current information needs, capabilities, and limitations of roadway users.
Driver errors (including misperceptions, slow reactions, and poor decisions) are a contributing factor in approximately 44 percent of crashes leading to a fatality. This statistic shows the human factor often slips through the cracks. Some current practices are limited by outmoded data (not representative of current driver behaviors), overly simple models, incorrect assumptions about user capabilities, or lack of consideration for recent changes in technology and some road users' special needs. Updating roadway design practices to be more driver-centric can reduce this tragic statistic.
Almost 50 years after NHI opened its doors, the Transportation Research Board (TRB), AASHTO, and FHWA released NCHRP 600, the second edition of the Human Factors Guidelines for Road Systems (HFG). This report was designed to meet the ever-evolving information gap often present in traffic safety.
Through extensive research and tutorials, the HFG aims to improve and justify driver-centered design decisions. Intended as a complement to existing standards, such as A Policy on Geometric Design of Highways and Streets (the AASHTO Green Book) or the Manual on Uniform Traffic Control Devices (MUTCD), the HFG provides guidance addressing the above limitations through empirical data and expert judgment.
But how does a non-expert in human factors begin to apply that guidance? That's where NHI comes in. NHI's instructors and instructional designers know that without prior understanding of human factors as a discipline, integrating the HFG into roadway design and operations practices can be daunting.
NHI's 2-day safety training course, FHWA-NHI-380120 Introducing Human Factors in Roadway Design and Operations, provides applicable support and direction regarding the HFG. This course helps participants update their design and operations practices based on an improved understanding of human characteristics as they apply to roadway safety. These road user factors include driving behavior and expectancies, as well as the effects of age, visual demands, and cognition. By studying physical and cognitive limitations of drivers on the road, highway designers and traffic engineers can develop a more user-centered approach in roadway design and operation, in turn improving highway safety. NHI's course provides both a broader understanding of these human factors as well as modern, hands-on case studies to explore how to apply the HFG to real roadway situations. By taking this safety training, non-experts in human factors can more effectively integrate the capabilities and limitations of road users into their design and operations practices.
Meeting training priorities like this has always been NHI's focus. That's why, 50 years after its establishment by Congress, NHI is continuing efforts to align its training to each State's focus areas. Toward that end, and to address local safety needs, NHI is offering an NHI-sponsored* session for FHWA-NHI-380120 Introducing Human Factors in Roadway Design and Operations, held at NHI's training facility in Arlington, VA, January 16–17, 2020.
You can benefit from this NHI-sponsored offer by emailing Training Program Manager Thomas Elliott (thomas.elliott@dot.gov) to enroll in the January session or if you have other State-partnered safety training requests.
*Disclaimer: NHI-sponsored sessions are sessions in which NHI waives 100 percent of the student registration fees for State, local, and Tribal government employees. Other sponsorship options exist for FHWA employees; please contact thomas.elliott@dot.gov for more details. Additional sponsored courses will be offered in 2020 based on availability and demand. Other restrictions and exclusions may apply.
2020 Lifesavers National Conference on Highway Safety Priorities, March 15–17, 2020, Tampa, FL
(https://lifesaversconference.org/)
The Lifesavers Conference brings together a unique combination of public health and safety professionals, researchers, advocates, practitioners, and students committed to sharing best practices, research, and policy initiatives that are proven to work. From distracted motorists and pedestrians to new technologies, drugged driving, autonomous vehicles, and more, Lifesavers addresses the issues impacting roadway safety today.
Safe Streets for Everyone: 21st Annual National Bike Summit, March 15–17, 2020, Arlington, VA
(https://bikeleague.org/summit)
With both traditional and mobile workshops throughout the week, capped off with a congressional reception, the 21st annual National Bike Summit will put a hands-on spin on advocating for bike safety.
NACE Conference & Expo, June 2–5, 2020, Minneapolis, MN
(https://www.naceweb.org/conferenceexpo/default.htm)
This annual conference will allow attendees to compare competing technologies and services, yet spend quality time with the solution providers and peers. The conference includes a series of sessions on topics related to construction and construction management, pavement surfacing and preservation, emergency management, local road safety plans, innovative technologies, and much more.
2020 American Society of Highway Engineers (ASHE) National Conference, June 3–7, 2020, Raleigh, NC
(http://2020conference.ashe.pro/)
The conference is expected to attract public and private sector design professionals, vendors, contractors, and guests from across the country, and provide a forum for networking and education on topics relevant to the transportation industry.
Joint ITE International and Southern District Annual Meeting and Exhibition, August 9–12, 2020, New Orleans, LA
(https://www.ite.org/events-meetings/ite-calendar/itenola2020/)
This international meeting and exhibit is an international membership platform for professionals working to improve transportation mobility and safety.
Nearly 12,000 people die every year in rural roadway departures. That's 30 people today and every day. If there were a way to save the people behind the numbers, would you use it? Rural lane departures are typically not found in "hot spots," but spread across the State and local road networks. Using systemic analysis, risk factors can assist decision makers in planning where to add proven roadway departure countermeasures.
Please watch this video to learn more about moving FoRRRwD (Focus on Reducing Rural Roadway Departures): https://www.youtube.com/watch?v=WfdBrrl0WwU.
Contact Cate Satterfield at cathy.satterfield@dot.gov for more information!
If you are attending the 98th Annual Transportation Research Board meeting, be sure to stop by booth 721 in the exhibit hall to check out all the Office of Safety has to offer!
Exhibit hours will be as follows:
Sunday, January 12, 4 p.m.-7 p.m.
Monday, January 13, 9:30 a.m.-4 p.m.
Tuesday, January 14, 9:30 a.m.-4 p.m.
For more information, please contact Tara McLoughlin at 202-366-2176 or tara.mcloughlin@dot.gov.
is a publication of the U.S. Department of Transportation, Federal Highway Administration.
The Federal Highway Administration publishes the Safety Compass newsletter three times a year. We can be reached at:
FHWA Office of Safety
1200 New Jersey Ave. SE
Room E71-320
Washington, DC 20590
The Safety Compass is available online at the FHWA Office of Safety web site at: https://safety.fhwa.dot.gov/newsletter/safetycompass/.
We welcome your comments and highway safety-related articles. The purpose of this newsletter is to increase highway safety awareness and information and to provide resources to help save lives.
We encourage readers to submit highway safety articles that might be of value to the highway safety community. Send your comments, questions and articles for review electronically to Tara McLoughlin at: tara.mcloughlin@dot.gov

