U.S. Department of Transportation
Federal Highway Administration
1200 New Jersey Avenue, SE
Washington, DC 20590
202-366-4000
Sign up to have Safety Compass delivered right to your inbox!

Best for printing: PDF Version (1.18 MB)
In this issue:
A Message from the FHWA Associate Administrator for Safety, Cheryl Walker
What's New?
Safety-Driven Changes and Improvements
Barrier Design for Motorcyclist Safety
Automated Work Zone Speed Enforcement (AWZSE) in Pennsylvania
Learning Together
Every Day Counts (EDC) Safety Summit Series — Sharing Your Success
Data and Analysis
The 2019 State Performance Target Assessments Are In
Selecting Projects and Strategies to Maximize HIghway Safety Improvement Program (HSIP) Performance
New Resource Roundup
Promoting the Value of HSIP to Decision Makers
FHWA Releases a Primer on Safe System Approach for Pedestrians and Bicyclists
Announcements

Cheryl Walker, Associate Administrator for Safety.
In June, the National Highway Traffic Safety Administration (NHTSA) released its early estimates of crash fatalities for 2020, and the news is grim. An estimated 38,680 people lost their lives on our roadways in 2020, an increase of 7.2 percent from 2019. Seeing the sheer number of fatalities increase is particularly troubling because the Federal Highway Administration (FHWA) estimates that vehicle miles traveled decreased by 13.2 percent in 2020.
All of us who work on roadway safety felt so disheartened in seeing these numbers. Since 2016, we had seen a decrease—albeit modest—in the number of fatalities. When we first became aware that traffic volumes would be decreasing in 2020, we hoped that one positive outcome would be a decrease in the number of fatalities. Instead, fatalities increased, highlighting even more of a need to change our traditional strategies to save lives.
We truly are at a crossroads in safety. Do we stay the course and keep doing things as we have, hoping to make incremental progress? Or—do we make changes so that we can see the safety outcomes improve by leaps and bounds, as we all work together toward zero deaths? We know the answer.
Rather than accepting fatalities and serious injuries as a normal consequence of traveling on our roadways, the Safe System Approach sets the ethical imperative that no one should die or be seriously injured while using our roadways. The Safe System Approach aims to eliminate all fatalities and serious injuries for all road users by accommodating human mistakes and keeping impacts on the human body at tolerable levels. The Safe System Approach is giving us new hope and tested strategies to achieve our goal of zero deaths.
Zero is our goal. A Safe System is how we get there.
By: Chimai Ngo, FHWA Office of Safety, and Kevin Elliott, ARA
Transportation safety boils down to people, including transportation practitioners themselves. Those who design and deploy safety treatments travel the roads like everyone else. Many times, they are saved by those treatments.
This is a series of stories about real people, including transportation practitioners, who were saved from harm by the safety strategies and countermeasures we promote every day. Their stories underscore the importance of making safety a top priority in the transportation industry.
Michael Kennerly. Iowa Department of Transportation (DOT)
Share Your Story
Do you have a story to share or know someone in your organization whose life was saved by safety treatments or whose career was inspired by a safety story? If so, please contact Chimai Ngo at chimai.ngo@dot.gov.
Michael Kennerly was saved by his own work.
Michael is the Design Bureau director for Iowa DOT. Part of his job involves deploying proven safety countermeasures on Iowa highways. He and his team had recently designed and installed a cable median barrier on a highway segment. This segment is a stretch of roadway Michael regularly drives himself.
One foggy morning, a driver was too close to the cars in front. That driver slammed on the brakes, causing a chain reaction of cars suddenly stopping. Michael was able to pull into the median to avoid a crash, but the semitruck behind him was not able to do the same. The truck collided with and destroyed Michael's vehicle, but also pushed his vehicle against the cable median barrier that Michael's team had designed.
"If that median barrier had not been there, that semi would have pushed me into oncoming traffic," Michael said. "It's times like that that remind you what we do saves lives."
Juan Carlos Rivera-Ortiz. FHWA
Juan Carlos Rivera-Ortiz, a highway engineer for FHWA, had a roadway departure crash on an expressway during his college years in Puerto Rico. A median guardrail saved his life and prevented a possible crash with drivers traveling in the opposite direction.
A driver in the opposite lane crossed over to Juan Carlos' lane, nearly hitting Juan Carlos head-on. Luckily, Juan Carlos was able to react in time to get out of the way, but that meant his vehicle left its travel lane to the roadside.
"Thanks to the guardrail I am a transportation safety engineer, and I promote safety in every project as a former State safety engineer, as a university professor, as an FHWA employee, and as a citizen," Juan Carlos said.
By: Guan Xu, FHWA Office of Safety
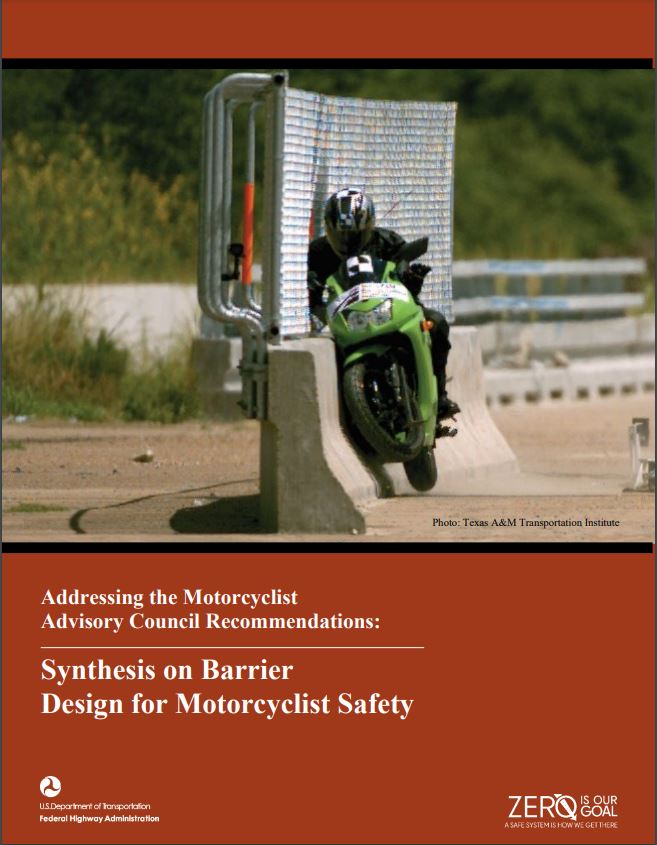
Cover of Synthesis on Barrier Design for Motorcyclist Safety. (Source: FHWA)
Motorcycle riders continue to be overrepresented in fatal traffic crashes. According to NHTSA's Traffic Safety Facts on motorcycles, 5,014 motorcyclists died in 2019. This accounted for 14 percent of traffic fatalities, while motorcycles only represent about 3 percent of registered motor vehicles and less than 1 percent of vehicle miles traveled.
The Motorcyclist Advisory Council (MAC), established by FHWA under requirements of Fixing America's Surface Transportation (FAST) Act, was tasked with providing recommendations to address certain infrastructure issues related to motorcyclist safety. One of the issues specified in the FAST Act and discussed in the MAC recommendation report is barrier design.
The purpose of roadside barrier systems is to reduce the severity of injuries and the number of fatalities by controlling and mitigating crash forces. While barrier systems have been designed and proven to be beneficial for motor vehicles, they do not currently address the problems associated with motorcycle crashes. Research and experiments have been conducted on some of the treatments designed to mitigate the safety impacts and risks that barriers create for motorcyclists. MAC recommended that FHWA evaluate the existing options for barrier applications in the United States and identify cases where no treatments to address barrier risk to motorcyclists have been developed. The newly published Synthesis on Barrier Design for Motorcyclist Safety aims to address the barrier design issues evaluated and recommended by MAC.
Through a comprehensive literature review, the synthesis examined the characteristics of motorcycle-related crashes. The synthesis also examined the role of helmet use and the motorcyclist's position at the time of the crash on the overall crash condition. The review concluded that motorcyclists are more vulnerable than drivers of motor vehicles and are therefore more likely to be severely injured when they crash into a barrier system. It also concluded that addressing the challenges associated with barrier systems is critical for reducing the severity of injurious and number of fatalities associated with motorcyclist-barrier crashes.
The synthesis also identified and summarized:
For more information, please visit the FHWA Motorcycle Safety web page or contact Guan Xu at guan.xu@dot.gov.
By Benjamin Snyder, P.E., Senior Project Engineer, RK&K
In 2020, crashes within a work zone in Pennsylvania accounted for 816 injuries and 15 fatalities, including one worker present in the work zone. Improving the safety of workers and the motoring public within work zones needs to be a focus as we work toward the goal of zero fatalities on Pennsylvania roadways.
In order to improve safety within Pennsylvania work zones, on October 19, 2018, the State legislature passed Act 86 of 2018. This legislation enables automated speed enforcement to be used during a 5-year pilot in active work zones that receive Federal aid. The Pennsylvania DOT, Pennsylvania Turnpike Commission (PTC), and Pennsylvania State Police (PSP) support the operation of this program.
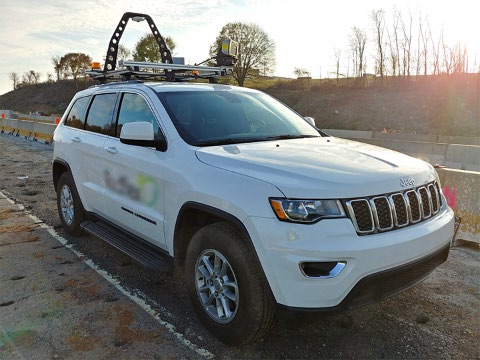
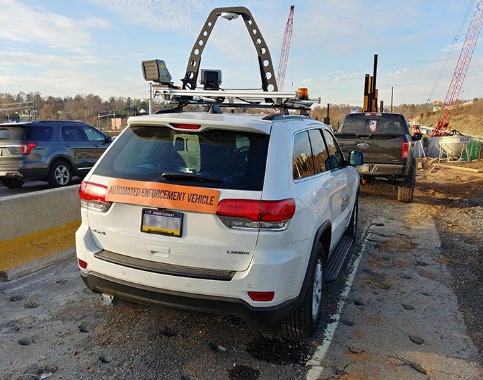
Vehicles used for automated speed enforcement in Pennsylvania work zones featuring enforcement signage. (Source: Pennsylvania DOT)
Pennsylvania's AWZSE program involves deploying a mobile unit to an active work zone. This mobile unit detects the speed of each passing vehicle. If a vehicle is traveling at least 11 miles per hour (mph) over the posted speed limit, two images of the front of the vehicle and two images of the rear are captured. The two front images are captured to identify the front plates on commercial vehicles.
PennDOT and PTC determined that a joint program between the two agencies was the best approach. This ensured consistency between programs on each agency's roadways and consolidated the efforts of program startup. A program administrator team is developing, coordinating, and executing the program on behalf of Pennsylvania DOT and PTC. The program administrator team is also responsible for scheduling the enforcement units, performing quality control checks on the violation database and the field deployments, and developing reporting statistics for the program. A jointly procured system administrator is responsible for all services associated with the field deployments, including speed detection and image capture, violation tracking, violation payment services, and all back-office processes.
The system administrator is required to provide two advance warning signs before the location of the enforcement unit. These signs have been developed in coordination with Pennsylvania DOT and PTC and are approved by FHWA. These roll-up signs are 48 x 48 inches and are mounted on portable x-frame sign stands capable of variable heights to ensure visibility over temporary barrier or channelizing devices.
The mobile units used for the program are vehicle-mounted systems capable of detecting speeds and capturing images over a 52-inch glare screen. The units are managed by an operator throughout the enforcement shift. This allows for continued confirmation that advance warning signs remain upright and in place throughout the deployment and that workers remain present during the deployment. A notice identifying the location of the enforcement vehicle at the work zone is affixed to the top of the enforcement vehicle.
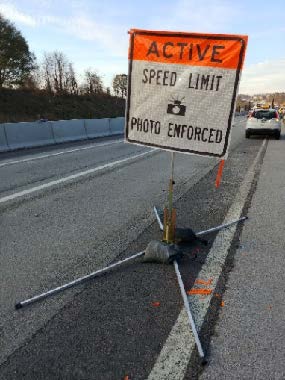
Advance warning sign. (Source: Pennsylvania DOT)
The program administrator team reviews historical speed data at the proposed work zone locations to identify areas where excessive speeding is an issue. The team also reviews the traffic control plans to identify any geometric features of the work zone where speeding may cause issues and determines the exposure to the workers. Workers are less protected when behind channelizing devices compared to a barrier. These operational, geometric, and worker exposure considerations all go into project prioritization to ensure the deployments are located where they provide the highest possible safety benefit for motorists and workers.
The first test deployments began in November 2019. These test deployments allowed all parties to further refine their processes, and ensure any issues encountered during this stage did not impact or delay the start of live enforcement. The program entered a mandatory 60-day pre-enforcement period from January to March 2020. Live enforcement began on March 9, 2020, upon expiration of the 60-day pre-enforcement period. As currently established, the program will operate through early 2024.
Deployments are scheduled jointly between the agencies on a weekly basis. Seventeen units are available for deployments across the State, with roughly 10 units available for Pennsylvania DOT roadways and seven units available for turnpike roadways. Each unit is capable of working two shifts per day, generally meaning a day shift and night shift, resulting in a maximum deployment potential of 34 shifts per day.
Between March 9, 2020, and April 30, 2021, the program issued more than 375,000 notices of violation. Approximately 14 percent of those violations have been issued to repeat offenders.
Over the past year and a half, volumes were down and speeds were up during the first few months of operation. Speeds normalized between June and November 2020 as more traffic returned to the roadways, with 20–25 percent of vehicles speeding and 2–5 percent of vehicles excessively speeding.
Analysis of speed data collected from the enforcement units indicated that vehicles are more likely to speed in barrier-protected work zones than channelizer-protected work zones. Through March 31, 2021, the program has deployed 800 units to barrier-protected work zones, half as often as to channelizer-protected work zones (1,600). Yet these deployments to barrier-protected work zones have resulted in 230,000 potential violations—nearly double the number as channelizer-protected work zones (124,000).
Significant reductions in speed have been observed in two specific work zones that AWZSE has been consistently deployed to since program startup. These two work zones saw a 4–6 mph drop in speeds after about six months of AWZSE operation.
In accordance with Act 86 of 2018, the AWZSE program team prepares an annual legislative report for the prior calendar year. This report is submitted to the chairs of the Pennsylvania Senate Transportation Committee and House Transportation Committee. The report includes a general program summary from the prior calendar year as well as legislatively mandated statistics and reporting.
Providing workers and motorists within Pennsylvania work zones with an additional tool to improve safety is the most important part of this program. Pennsylvania DOT, PTC, and PSP are committed to delivering a quality program that benefits the workers and motoring public within Pennsylvania. Improving safety on our roadways is everyone's responsibility, and this program supports that mission.
For more information, visit https://workzonecameras.penndot.gov/ or email Dan Farley at dfarley@pa.gov, Chad Smith at chsmith@paturnpike.com, Mahmood Shehata at c-mshehata@pa.gov, or Benjamin Snyder at c-bensnyde@pa.gov.
By Hillary Isebrands, FHWA Resource Center Safety & Design Technical Service Team; Jerry Roche, FHWA Office of Safety; and Holly Kostrzewski, NE Minnesota Regional Toward Zero Deaths Director.
Public health is the science of protecting and improving the health of people and their communities. Public health professionals' primary responsibilities include promoting healthy lifestyles, preventing injuries, and responding to infectious diseases. Two of these three core functions align with those of transportation safety professionals: promoting healthy lifestyles and preventing injuries.
When you think about the biggest opportunities in injury prevention, what's the most common risk-taking activity that nearly every one of us does each day? It is transportation—by walking, biking, or driving or riding in a motor vehicle. When you think about the biggest opportunity in promoting healthy lifestyles, what is an important way to live healthier? It is becoming more active—by walking or biking.
Holly was 18; she was driving her car near an intersection and didn't see the approaching vehicle. The collision left Holly with a traumatic brain injury.
"That moment of my life—you might say was the ‘intersection of my life,' which resulted in the trajectory of my entire career and my life forward. I truly believe that everything happens for a reason, and I believe that I didn't choose my career path—my career path chose me. I knew of public health professions because my mom was a nursing director, but I never thought of the link to transportation. I wish that more people in public health knew about traffic safety as a specialization."
— Excerpt from interview with Holly Kostrzewski
Public health professionals are experts at interdisciplinary partnerships, because they're trained to work collaboratively across disciplines in their mission to protect the public. They're trained to communicate sensitive subjects, and they have experience educating the public about positive and negative behaviors. For example, they're involved with child and teen checkups, nutrition, diabetes prevention, smoking cessation, wellness, exercise, and substance abuse. They concern themselves with the care of babies, children, teens, and sick and older populations; they go into homes, schools, and facilities. Changing personal behaviors is directly applicable to traffic safety.
Public health professionals also track communities' injuries and deaths and try to prevent them. According to the Centers for Disease Control and Prevention, the public health injury prevention approach has four steps: define the problem, identify risk and protective factors, develop and test prevention strategies, and assure widespread adoption of effective injury prevention principles and strategies. Interdisciplinary safety teams, such as a Toward Zero Deaths (TZD) coalition, or participating in the development of a local road safety plan (LRSP) fit well within the role of public health professionals. It's essentially a public health model for traffic safety. If your community is trying to improve traffic safety, public health professionals can help get the players to the table. They can help with framing and communicating the message to other stakeholders, elected officials, and the public, and they have a knack for seeking and leveraging funding opportunities.
Likewise, there are things that local transportation agencies can assist public health professionals with. First and foremost, there's the infrastructure. A primary way for people to maintain a healthy lifestyle (and reduce future healthcare costs) is mobility and exercise, including walking, running, or biking. This requires the presence and maintenance of sidewalks, shared-use paths, and roads. Many progressive transportation agencies are now providing enhanced active transportation infrastructure, with features such as protected bike lanes, bike boxes, road diets, roundabouts, and leading pedestrian intervals at signalized intersections.
In addition, transportation agencies often have data, such as the number of vehicles, pedestrians, and bicyclists traveling along a roadway or passing through an intersection, which are helpful to public health agencies that need metrics for grant applications or post-project reports. Engaging public health leaders with development and implementation of LRSPs is also a great way to establish and enhance relationships to reduce fatal and serious injury crashes.
At the core, public transportation and public health share a common goal. If you're a State, county, or city engineer, you're very concerned that your citizens and visitors arrive safely at their destinations. And the same is true for public health. Transportation and public health professionals are concerned about protecting people both inside and outside our communities. We need to collaborate more and be interdisciplinary partners to achieve zero deaths on the roads across the country. And so, how can we better link arms and help each other figure out why our fatalities are rising, and what we can do collectively instead of individually?
Led by the Departments of Public Health, Public Safety, and Transportation, the Minnesota TZD partnership is supported by eight regional coalitions including Native American Tribes in the regions. This enables regions to look at data specific to their geographic areas to identify factors leading to fatal and serious injury motor vehicle crashes, and then work with their constituents to implement proven countermeasures. These countermeasures commonly include the 4 E's: education, engineering, enforcement, and emergency medical services. The regional TZD coordinators are co-funded by the Minnesota Department of Public Safety and Minnesota DOT. These partnerships have resulted in projects such as Minnesota's LRSPs, a program that started in 2010 and produced LRSPs for the State's 87 counties. Minnesota TZD regions provide a public health perspective and bring a public health lens to the challenges and solutions associated with fatal and serious injuries crash on the local road system.
Fostering interdisciplinary partnerships is key to success. The regional coordinators nurture these partnerships with other safety disciplines, including educators, engineers, emergency medical services, and law enforcement at the State and local levels. We need to make sure everybody is interdisciplinary. If the champion of safety in your organization leaves their job today and goes somewhere else, the team they had been a part of will still be talking because we've all devoted ourselves to building those interdisciplinary partnerships. As Aristotle said, "The whole is greater than the sum of its parts."
For more information, please contact Hillary Isebrands at Hillary.isebrands@dot.gov, Jerry Roche at jerry.roche@dot.gov, or Holly Kostrzewski at holly.kostrzewski@state.mn.us.
By Karen King, FHWA Office of Safety and FHWA Virginia Division Office
Join us for the EDC Safety Summit Series in September to learn more about deploying life-saving initiatives, overcoming challenges, sharing your own success stories, and building your network!
This free, virtual summit is scheduled each Wednesday in September 2021 and will highlight the seven EDC safety initiatives and share how they can save lives. The series will benefit those who are just beginning to implement these initiatives, those who are further along and could gain from peer-to-peer engagement, and those with success stories to share. It will include opportunities to discuss hot topics with peers and establish relationships that can boost success now and in the future.
Register here!
We are also showcasing your EDC success stories and other safety successes you'd like to shine a light on. This is an amazing opportunity to get word out on your achievements!
The summit will take place from 10 a.m. to 2 p.m. eastern time each day and is open to all State, local, and Tribal stakeholders. Participants can join for as many Wednesdays as they desire.
If you have any questions please contact Karen King at karen.king@dot.gov or 804-775-3363.
By Becky Crowe, FHWA Office of Safety
Using a variety of media and training events, this summer FHWA's STEP program highlighted national issues facing pedestrian safety. Summer STEP outreach efforts included forums, new videos, and roadside audit technical assistance.
Snapshot of the FHWA STEP speed video. (Source: FHWA
In June and July 2021, STEP hosted a series of State DOT discussion forums highlighting the following strategies:
During each session, FHWA staff and representatives from dozens of State DOTs shared resources to help implement these strategies to improve pedestrian crossing safety. Virtual scan tours and peer-to-peer exchanges held in 2020 focused on inventory methods, systemic analysis, and arterial safety for pedestrians. These topics inspired the 2021 STEP summer sessions.
STEP is also creating two animated videos to focus on fundamental safety issues for pedestrian fatalities. The first video explains the relationship between vehicle speed and pedestrian crash risk. The second video illustrates challenges for people trying to cross multilane roadways—roads with two or more lanes in each direction. Speed and multilane crossings are especially problematic for people crossing arterials and other high-speed or high-volume roadways. These same issues are also featured in issue briefs and social media posts as part of the FHWA STEP UP campaign.
The speed video explains how higher vehicle travel speeds decrease stopping sight distance, increase the chances of fatal pedestrian crashes, and decrease the driver's cone of vision approaching crosswalks. The animated speed video shares options for countermeasures such as refuge islands and road diets that enhance visibility of pedestrians in crosswalks and slow speeds of approaching vehicles.
The multilane crossing video demonstrates how crash risk increases with longer crossing distances and restricted visibility of people in crosswalks. The multi-threat crash type occurs on multilane roads—where other vehicles in adjacent travel lanes obstruct the view of people in the crosswalk. The multilane video shows a revised game plan for multilane crossings, such as advance yield markings and signs, parking restrictions, and improved bus stop locations.
The STEP team is also supporting agencies in Missouri, Washington, Maine, North Carolina, and Tennessee with road safety audits, technical assistance, and workshops that promote the "Spectacular Seven" countermeasures. To ask about technical assistance offered through the STEP program, contact Becky Crowe at rebecca.crowe@dot.gov or Peter Eun at peter.eun@dot.gov. To learn more about the STEP "Spectacular Seven" countermeasures, visit the STEP web page.
By Karen Timpone, FHWA Office of Safety; Stephanie Roldan, Ph.D.; and Mafruhatul Jannat, Ph.D.
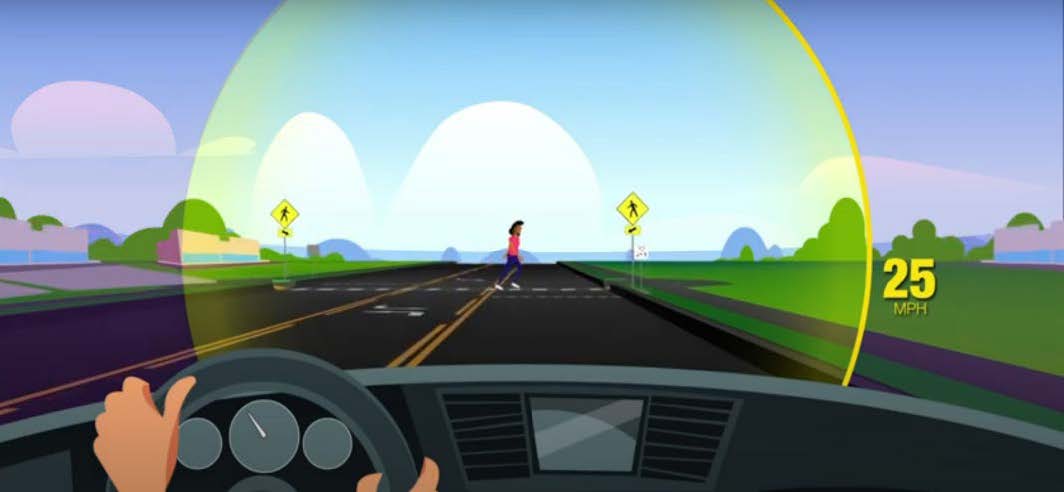
Warning signal for drivers. (Source: FHWA))
Despite an overall reduction in traffic fatalities in the past decade, the number of pedestrian and bicyclist fatalities has continued to increase. In 2019, 6,205 pedestrians were killed in traffic incidents. Fatality data from 2019 also show that the greatest proportion of pedestrian fatalities occurs at non-intersection locations (73 percent), in urban settings (82 percent), and at night (76 percent). Compared to signalized intersections, non-intersection locations, such as marked mid-block crossings, may have less frequent and predictable patterns of use and are less likely to be equipped with the physical and electronic infrastructure required to support other dynamic safety treatments such as rectangular rapid-flashing beacons. To address this gap, FHWA and the Intelligent Transportation Systems Joint Program Office are exploring connected wireless vehicle and pedestrian technology to provide accessible, cost-effective mid-block crossing safety treatments available on-demand. One area of research is communication among pedestrian devices, infrastructure, and vehicles to improve safety as part of the vehicle-to-pedestrian research program.
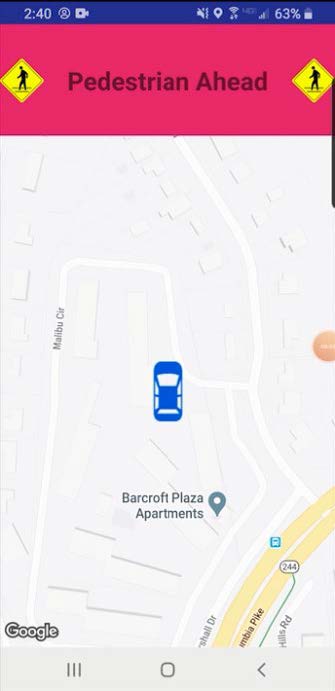
Due to their increasing availability and continuous technological improvements, smartphones are a promising candidate for rapid deployment of connected pedestrian safety applications. However, smartphone-based systems face critical challenges related to pedestrian and driver safety, including comprehension, usability, and consistency of use. In an effort to develop a smartphone-based safety system to improve pedestrian safety at mid-block crossings, FHWA developed the smartphone-based mid-block pedestrian crossing in-vehicle warning application (app). The mid-block app allows pedestrians to signal their intent to cross at a marked mid-block crossing when they are within a predefined region surrounding an enabled crosswalk. The pedestrian crossing signal sends a warning message to drivers who are using the same app within a geofenced region around the crosswalk. The warning notifies drivers that a pedestrian is ahead to improve driver awareness and prepare drivers to yield or stop to allow the pedestrian to cross. The effectiveness of the mid-block app was tested in a multiphase study to evaluate driver response and pedestrian usability.
The U.S. Department of Transportation recently completed phase 1 of the Smartphone-Based Mid-Block Pedestrian Crossing project. Phase 1 focused on a scenario in which a driver reacts to an in-vehicle alert as a pedestrian is crossing at a marked mid-block crossing that does not have an active traffic control device (e.g., traffic signal, pedestrian beacon). The mid-block app was tested with 80 participant drivers on a closed track at Turner-Fairbank Highway Research Center in McLean, Virginia. The participants drove a route in which they approached a mid-block crossing four times. In one of the approaches, a researcher who acted as a pedestrian was present at the crosswalk and activated a crossing alert. The crossing alert triggered an audio-visual in-vehicle warning consisting of the message "Pedestrian Ahead," which was delivered via a smartphone mounted on the dashboard. In another approach to the crosswalk, the pedestrian was present but did not activate the crossing signal. The order in which participant drivers either received or did not receive a crossing signal was counterbalanced across the sample. As shown in the graph, drivers who had received the in-vehicle alert were more likely to have stopped to allow the pedestrian to cross. Although no alert had been provided on the second encounter with a pedestrian, drivers who had received an in-vehicle alert on their first encounter approached the crosswalk more slowly than drivers who had never received a warning. These results suggest that the in-vehicle warning may reduce conflicts at marked mid-block crosswalks, which motivated further investigation of the app's effectiveness.
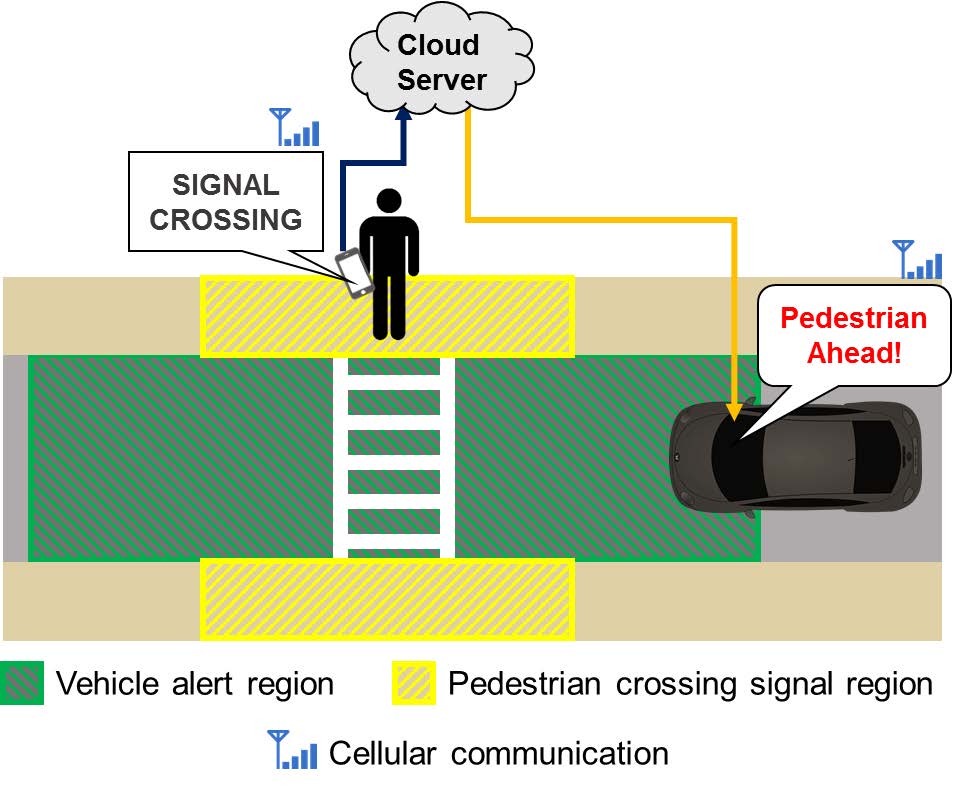
Mid-block pedestrian crossing in-vehicle warning system. (Source: FHWA
Although testing indicated favorable driver response to the mid-block app's pedestrian safety alert, phase 1 did not gather information about pedestrians' interactions with the app. Considering that the mid-block app relies on pedestrians to voluntarily trigger the in-vehicle warning, phase 2 employed a two-part assessment of pedestrians' attitudes toward and interactions with the app.
The first part of phase 2 brought participants of varying ages together for focus groups to collect feedback on the app's clarity and interface, from the perspective of a pedestrian. An even number of participants was split into two groups (those younger than 46, and those 46 or older). The mean age was 48. Interviewees were asked about their willingness to accept and use a variety of potential smartphone-based interfaces aimed at improving pedestrian safety. Participants discussed points of confusion or dissatisfaction related to app interfaces, as well as the features they considered most valuable. This feedback was used to modify the pedestrian component of the mid-block app interface to improve clarity and support proper use. Specifically, messages were added to emphasize that the crossing alert was active and to remind users that activating the alert did not guarantee safety.
After the focus group, the modified mid-block app was field tested with participant pedestrians at three live mid-block crossing locations. The pedestrian field study explored participants' comprehension of the app's role in supporting safe crossings, and how the app influenced crossing behavior in different roadway settings when an approaching vehicle was present or was not present. Participants also completed a questionnaire to provide feedback on their satisfaction with and acceptance of the mid-block app.
In the phase 2 field study, crossing locations with various features were selected to explore the influence of roadway setting (rural, suburban, or urban), crossing configuration, and surrounding infrastructure on pedestrians' use of and attitudes toward the mid-block app. Sixty participants were instructed to activate the pedestrian warning before entering the crosswalk 20 times. On 10 of these crossings, a vehicle that had received the in-vehicle pedestrian alert approached the crosswalk and yielded to allow the pedestrian to cross. Participant crossing behavior was measured, including the time it took participants to enter the crosswalk after they had activated the warning, the time it took participants to exit the crosswalk, and participants' looking behavior toward the approaching vehicle before and during crossing.
In general, any smartphone app designed to assist pedestrians with crossing a road might influence crossing behavior. Therefore, pedestrian behavior while using the mid-block app was compared with pedestrian behavior while using a non-connected app that had been designed to make pedestrians more conspicuous. The non-connected app, referred to as the flashing app, consisted of a high-contrast flashing pattern. The flashing app was deployed in half of the trials in a controlled, randomized order. At the end of the experiment, participants rated both apps on preference, effectiveness, and acceptance.
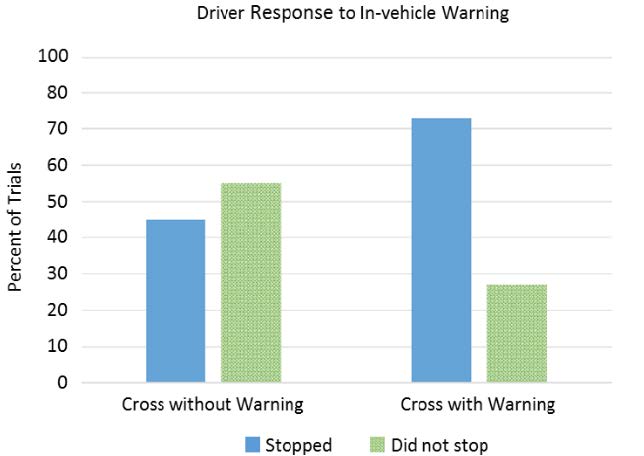
Percent of trials with and without a warning in which drivers stopped or did not stop ahead of the crosswalk. (Source: FHWA))
The results of the pedestrian field experiment indicate that pedestrian crossing behavior was similar when using either the mid-block app or the flashing app. Safety-related behaviors, such as waiting to enter the crosswalk after participants had activated the signal and looking toward the approaching vehicle before and during crossing, were observed during use of both apps. In later trials, participants entered the crosswalk more quickly after they had activated the app and completed crossings more quickly.
Roadway setting also influenced the delay between when participants activated the app and when they entered the crosswalk. The shortest delay occurred at the urban location, followed by the suburban and rural locations. At the urban location, participants over 46 years old waited significantly longer to enter the crosswalk than participants under 46 years old. In the post-experiment questionnaire, participants rated the mid-block app and the flashing app similarly on preference, satisfaction, and acceptance. Participants thought the mid-block app was more helpful than the flashing app for detecting hazards.
The outcomes of the pedestrian field test provide preliminary evidence that, when compared to the flashing app, the mid-block app neither promoted nor discouraged safe crossing behaviors. Participants appeared to remain aware of the need to maintain their own safety, and they perceived the mid-block app as having an added benefit over the flashing app. Although pedestrian crossing behavior while using the mid-block app was not compared to unassisted crossing behavior, the field observations and survey responses suggest that pedestrians reliably comprehended and deployed the mid-block app without having introduced significantly more risk than a non-connected alternative.
Finally, the information collected from all experiments conducted in phases 1 and 2 are used to provide recommendations and near-term needs for larger-scale field testing. Larger-scale testing could explore interactions between drivers and pedestrians using the app in a real-world urban-like setting. A wider-scale deployment would allow researchers to evaluate the conditions under which participants most often use the app and perceive the app to be most valuable. In addition, researchers could explore the use of and response to the app over time. Natural variations in crossing conditions, such as weather, traffic volume, and crossing geometry, and the proportion of the population with access to the app, may have important implications for consistency of use and, therefore, effectiveness.
For more information, contact Karen Timpone at Karen.timpone@dot.gov.
By Danielle Betkey, FHWA Office of Safety
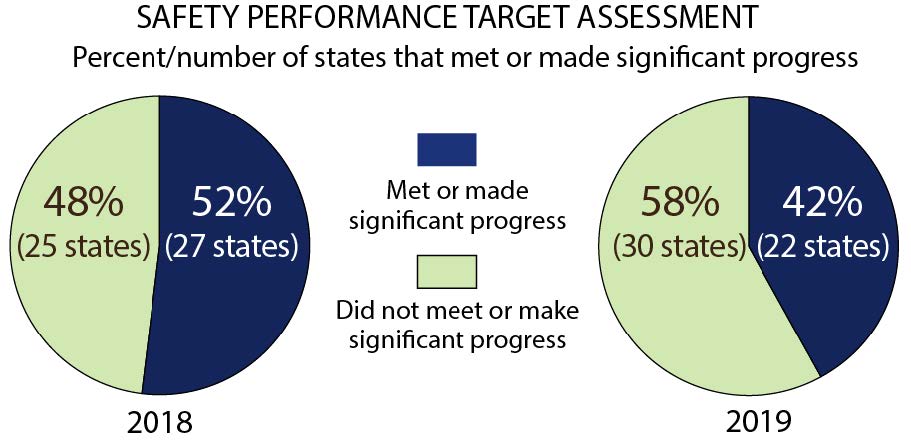
FHWA has completed the State safety performance target assessments for calendar year (CY) 2019. This year is the second cycle of States setting safety performance targets and FHWA assessing whether States have met them or have made significant progress toward meeting them. A State is determined to have met their targets or made significant progress toward meeting them when at least four of the five safety performance targets have been met, or if the actual outcome for the target is better than the baseline performance.
Safety performance target assessment for U.S. States and territories. (Source: FHWA
For CY 2019, a total of 22 States (42 percent) met or made significant progress, as compared to 27 States (52 percent) for CY 2018. For CY 2019, a total of 30 States (58 percent) did not meet or make significant progress, as compared to 25 States (48 percent) for CY 2018. Comparing CY 2018–2019 safety performance target assessments, 16 States (31 percent) met or made significant progress for both CY 2018 and CY 2019, and 19 States (37 percent) did not meet or make significant progress for either CY 2018 or CY 2019. There were 11 States (21 percent) that met or made significant progress for CY 2018, but did not meet or make significant progress for CY 2019. Conversely, six States (12 percent), did not meet or make significant progress for CY 2018, but met or made significant progress for CY 2019.
It is important to note that each State uses its own State-specific methodology when setting annual safety performance targets. Therefore, some States may have set aggressive targets and did not meet those targets, while other States may have set more attainable targets and met those targets. For this reason, it is difficult to draw any conclusions about a State's safety program based solely on the safety performance target assessment as it does not fully depict each State's unique approach.
FHWA has recently updated the Transportation Performance Management website to include the CY 2019 safety performance target assessment. The website provides a glimpse into each State's safety performance targets, which represent annual performance levels as we all work toward the long-term goal of zero fatalities. The website also displays historical data and information on how States set their safety performance targets. The website includes the results for each State for the CY 2018–2019 safety performance target assessments.
FHWA shares the vision of zero fatalities on our Nation's roadways. States' annual safety performance targets represent an important step in helping States work toward the goal of eliminating traffic deaths and serious injuries on our Nation's roadways.
For more information, please contact Danielle Betkey at Danielle.Betkey@dot.gov.
By Karen Scurry, FHWA Office of Safety
The purpose of the HSIP is to significantly reduce fatalities and serious injuries on all public roads and for all road users. The purpose of the HSIP is consistent with the Safe System Approach principle that death and serious injuries are unacceptable, and FHWA's long-term vision of zero fatalities on our Nation's roads. To achieve this vision, State and local agencies use a data-driven roadway safety management process to plan, design, and implement highway safety improvement projects under the HSIP. While States are proactively addressing safety needs through this program, there may be opportunities to enhance current project planning and selection practices to maximize HSIP performance. The Selecting Projects and Strategies to Maximize Highway Safety Improvement Program Performance guide highlights those opportunities.
Cover of Selecting Projects and Strategies to Maximize Highway Safety Improvement Program Performance. (Source: FHWA)
The guide explains how State DOTs, metropolitan planning organizations, and other agencies can use economic analysis methods and safety management approaches to have the greatest potential to reduce fatalities and serious injuries. The guide discusses how projects affect safety performance, presents current approaches for highway safety management, and provides considerations for new economic methods and strategies that may improve upon current methods.
The performance of the HSIP depends on the performance of its projects. The performance of each project largely depends on the effectiveness of countermeasures and where they are installed. This guide presents fundamental analytical methods and a conceptual framework for maximizing the effectiveness of the HSIP by increasing the individual performance of HSIP projects. The best-performing, most cost-effective, highest-priority HSIP projects deliver the greatest reductions in fatalities and serious injuries at the lowest costs. To address fatal and serious injury crashes, agencies should focus on the change in fatal and serious injury crashes, rather than all crashes or all injuries, when identifying and selecting projects.
Benefit-cost analysis allows analysts to quantify and compare the benefits and costs among highway safety improvement projects. The benefit cost ratio (BCR) is the best measure of economic performance for projects, countermeasures, and the overall program. Because the HSIP is constrained by a budget, projects that improve safety performance most cost-effectively should maximize HSIP performance. BCR allows agencies to rank projects by performance and select the best-performing combination of projects. Analysts can use BCR in terms of reduced fatal and serious injury crash costs per dollar spent (BCRKA) to quantify and rank the performance of individual projects or the overall program. States can improve HSIP performance by increasing the average BCRKA of implemented projects or by adding funding.
The guide also presents an alternative way to calculate BCR based on the ratio of maximum monetary potential for safety improvement at a site and the countermeasure score (CM score) for proposed improvements, rather than estimated benefits and costs. CM score is a new measure proposed in this guide that represents the life cycle project costs to reduce 1 percent of crashes at any applicable location, providing a more comprehensive way to compare countermeasure effectiveness than offered by currently available measures such as crash modification factors (CMFs).
This guide presents case studies using data from two States that illustrate how agencies can apply BCRKA and the CM score to prioritize projects. In these case studies, the BCRKA method resulted in selecting projects expected to prevent more fatal and serious injury crashes than the current project selection methods used by the two States. While BCRKA is appropriate to prioritize projects and alternatives among different locations, analysts can use CM scores to select among countermeasures at a given location. CMFs, costs, and service lives used in determining CM scores have a large effect on the relative comparison between countermeasures. The CM score method holds promise but requires further evaluation to confirm the case study findings.
To maximize performance of the HSIP, agencies can:
There are opportunities to use the recommendations presented in the guide to save more lives and prevent more serious injuries with the HSIP. While more complete and higher-quality data will help identify locations and projects with the greatest potential to improve safety, States can implement the concepts and methods of BCR-based prioritization with almost any level of data. Researchers can assist practitioners by developing new tools that apply the methods presented in the guide and expanding the library of available safety performance functions, CMFs, and implemented countermeasure data.
Every phase of the HSIP and project development process has a potential impact on the safety performance of the resulting projects. Ensuring that agencies are selecting projects and strategies to maximize HSIP performance will help reduce fatalities and serious injuries across the country.
For more information please contact Karen Scurry at Karen.scurry@dot.gov.
By Karen Scurry, FHWA Office of Safety
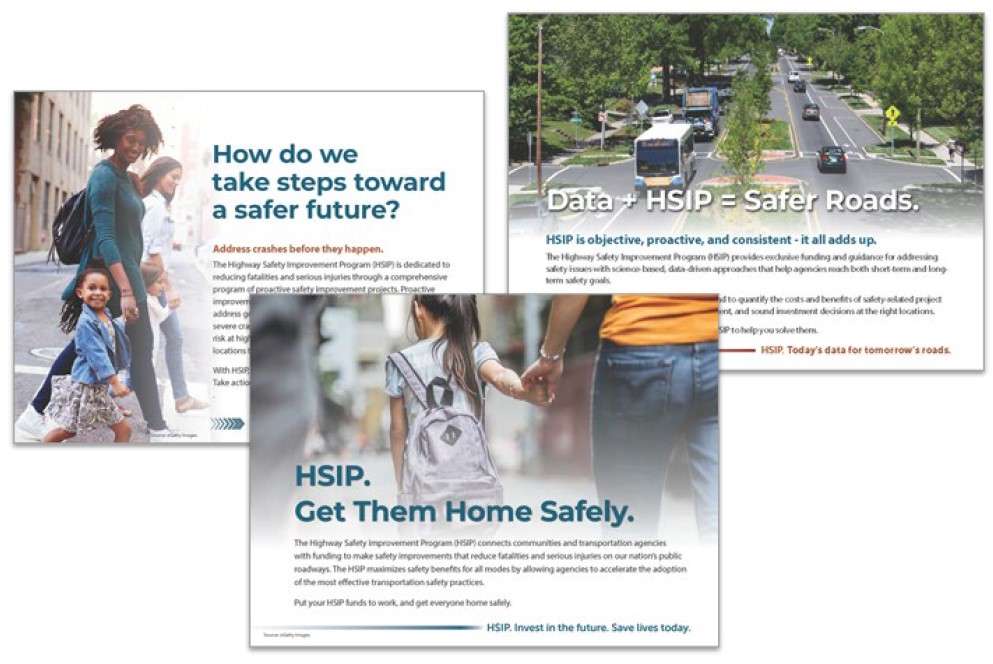
HSIP promotional cards. (Source: FHWA)
The HSIP saves lives, and it's important to promote the value of HSIP to decision makers who determine how and where to invest limited HSIP dollars. The FHWA Office of Safety recently published promotional cards that Federal, State, and local safety champions can use to promote the value of HSIP to decision makers. There are three cards, each focused on a different theme:
Each card contains general messaging on the front and a case study example on the back. Agencies can customize the back to feature their own examples using the PowerPoint version of the file.
Consider how you might use these cards to encourage design engineers, district engineers, and directors to prioritize safety and maximize opportunities to advance highway safety improvement projects that have the greatest potential to reduce the State's roadway fatalities and serious injuries.
Here are some ideas:
Through continued outreach and communication about the value of highway safety improvement projects and the HSIP, we can achieve our long-term vision of zero deaths on our Nation's roads. For more information or to ask questions, please contact Karen Scurry at karen.scurry@dot.gov.
Cover of Primer on Safe System Approach for Pedestrians and Bicyclists. (Source: FHWA)
By Tamara Redmon, FHWA Office of Safety, and Karen King, FHWA Office of Safety and FHWA Virginia Division office
Are you interested in learning how the Safe System Approach relates to bicycle and pedestrian safety? Then the Primer on Safe System Approach for Pedestrians and Bicyclists is for you! This primer examines how pedestrians and bicyclists are included in the five distinct elements of the Safe System Approach:
The primer provides approaches that can be taken now at the Federal, State, and local levels to implement a Safe System Approach. Since the Safe System Approach inherently prioritizes pedestrians and bicyclists by focusing on eliminating fatal and serious injuries, this primer will help start the conversation and work toward formalizing the Safe System Approach.
For more information, contact Karen King at karen.king@dot.gov or Tamara Redmon at tamara.redmon@dot.gov.
By Thomas Elliott, FHWA NHI training program manager, and Christine Kemker, NHI senior marketing specialist contractor
NHI is focused on providing innovative and relevant training that meets the needs of the transportation industry. This fall, NHI has added two recently released courses for highway safety practitioners:
More than 200,000 highway-rail grade crossings exist across the United States, more than half of which are under jurisdiction of a public authority. To keep these crossings safe for vehicles, bicycles, and pedestrians, FHWA offers funds through the Railway-Highway Crossings (Section 130) Program to eliminate hazards at public highway-rail grade crossings. In fiscal year 2020, $245 million was allocated to improve safety at railway-highway crossings.
States interested in using Section 130 funds or other grants to improve their highway-rail crossings should enroll their personnel in NHI's newest course, Where Highways Meet Rails: Crossing Safety. This course will help practitioners who are responsible for planning, engineering, design, construction, or maintenance of highway-rail crossings navigate the planning and funding process and maximize the safety impact of their rail projects.
The training provides information on highway-rail crossings and grade crossing components, including program/project development and administration. Participants will learn to evaluate highway-rail crossings for safety issues and identify regulations and requirements applicable to the crossings.
In addition, the course is offered in a unique training format. Inspired by massive open online courses (MOOC), the training combines independent self-paced elements that have interactive learning opportunities with peers and expert instructors. In an efficient and effective way, this MOOC-like format allows participants to fit the training into their schedules while also benefiting from the experience of other industry professionals. Learners will have opportunities to discover local area examples (rural crossings, metropolitan crossings, or both) by working through focused application assignments. This tailors each participant's experience based on relevant data and involves their local stakeholders.
This innovative, learner-focused format expands the depth of material that participants can study and maintains opportunities for engagement, both with the virtual instructor and with industry peers, while allowing participants to work at their own pace. With this approach, NHI is getting the information into the hands of people who can use it while minimizing disruptions.
Virtual materials include video, text, electronic publications, learner-based research, and the latest edition of the Highway-Rail Crossing Handbook. The course simulates the work that highway-rail crossing planners and engineers perform on a regular basis, and participants will have opportunities to apply the material in hands-on activities.
This course is expected to take an average of 16 hours over 12 weeks (1.5–2 hours a week). During this time, participants can work through the course materials and assignments at their own pace. At the end of the 12-week course, participants who pass the final exam with a 70 percent or more earn 1.6 continuing education credits (CEUs).
Interested practitioners can register for Where Highways Meet Rails: Crossing Safety, along with other safety training courses, at https://www.nhi.fhwa.dot.gov/.
Estimating roadway project safety is an integral part of the road safety audit process. While traditional methods of crash and roadway analysis rely on subjected or limited quantitative measures of safety performance, IHSDM employs evidence-based models to quantify safety impacts.
First released in 2003, the IHSDM software provides a suite of tools to evaluate the safety and impact of highway design decisions. With version 16.0.0 released in September 2020, the updated IHSDM — Highway Safety Manual (HSM) Predictive Method remains a state-of-the-art tool for safety and operational performance analysis. The software supports FHWA's data-driven safety analysis initiative and can automate design policy checks, safety performance evaluations, and economic impact assessments for roadway design projects.
To help highway design professionals maximize their application of the software, NHI offers an updated virtual training on IHSDM application and output evaluation. This training benefits any personnel working with IHSDM or applying its results.
IHSDM is a blended online training. It combines independent self-paced web-based modules with live instructor-led web conference sessions. This blended learning environment offers flexibility to planners, designers, and engineers interested in taking this course. Participants will start off at their own pace, asynchronously learning the basics of IHSDM through guided online lessons. The virtual instructor-led sessions dive into the application of IHSDM modules, and participants will learn how to synthesize IHSDM outputs to make real-world decisions. By the end of the training, participants will be able to make, justify, and defend geometric design and investment decisions throughout the highway design process.
Through this virtual course, participants will get hands-on experience with each of the five IHSDM modules: Crash Prediction, Design Consistency, Policy Review, Traffic Analysis, and Driver/Vehicle, along with its economic analysis tool. With real highway design analysis and evaluation activities, participants will be able to quantify and compare the safety and operational performance of their design decisions, beyond a simple check against design standards.
With 12 hours of training time, participants who pass the exam with a 70 percent or higher earn 1.2 CEUs. More important, participants will be empowered to make quantitative, data-driven highway design decisions to improve safety and operations.
The IHSDM-HSM Predictive Method 2020 release can be downloaded for free at https://www.ihsdm.org/. Practitioners can register for the IHSDM training course at https://www.nhi.fhwa.dot.gov/.
For more information, please contact Thomas Elliott at Thomas.elliott@dot.gov.
American Society of Civil Engineers (ASCE) 2021 Convention
The ASCE 2021 Convention will be hosted virtually October 6–8, 2021.
Intelligent Transportation Systems (ITS) World Congress
The ITS World Congress will be held October 11–15, 2021 in Hamburg, Germany.
National Safety Council Safety Congress and Expo
The National Safety Council Safety Congress and Expo will be hosted October 11–13, 2021, in Orlando, FL.
International Conference on Transportation and Safety
Hosted by the World Academy of Science Engineering and Technology, the International Conference on Transportation and Safety will be hosted virtually October 21–22, 2021.
American Association of State Highway and Transportation Officials (AASHTO) Annual Meeting
The AASHTO Annual Meeting will be held October 26–29, 2021, in San Diego, CA.
American Public Transportation Association (APTA) TRANSform Conference and Expo
APTA's TRANSform Conference and Expo will be hosted in Orlando, FL, November 7–10, 2021.
National League of Cities (NLC) City Summit
The NLC City Summit will be hosted virtually and in-person November 18–20, 2021, in Salt Lake City, UT.
2021 Intelligent Transportation Systems (ITS) America Annual Meeting
The 2021 ITS America Annual Meeting will be hosted December 7 – 10, 2021 in Charlotte, NC.
Transportation Research Board (TRB) Annual Meeting 2022
The TRB 101st Annual Meeting will be held January 9–13, 2022, in Washington, DC.
is a publication of the U.S. Department of Transportation, Federal Highway Administration (FHWA).
FHWA publishes the Safety Compass newsletter 3 times a year. We can be reached at:
FHWA Office of Safety
1200 New Jersey Ave. SE
Room E71-320
Washington, DC 20590
The Safety Compass is available online at the FHWA Office of Safety web site at: /newsletter/safetycompass/.
We welcome your comments and highway safety-related articles. The purpose of this newsletter is to increase highway safety awareness and information and to provide resources to help save lives.
We encourage readers to submit highway safety articles that might be of value to the highway safety community. Send your comments, questions, and articles for review electronically to Tara McLoughlin at: tara.mcloughlin@dot.gov.

