U.S. Department of Transportation
Federal Highway Administration
1200 New Jersey Avenue, SE
Washington, DC 20590
202-366-4000
This section of the Handbook provides treatments to enhance the performance of aging drivers for the following design elements associated with roadway segments. Also, after the last element, six promising practice treatments are provided. Drawings are for illustrative purposes only; they are not to scale and should not be used for design purposes.
Proven Practices
Promising Practices
Crashes on horizontal curves have been recognized as a considerable safety problem for many years. Crash studies indicate that roadway curves experience a higher crash rate than tangents, with rates ranging from one-and-a-half to four times higher than tangents (Glennon, Neuman, and Leisch, 1985; Zegeer, et al., 1990; Neuman, 1992). Lerner and Sedney (1988) reported anecdotal evidence that horizontal curves present problems for aging drivers. Also, analyses of crash data in Michigan found that aging drivers were involved in crashes on horizontal curves as a result of driving too fast for the curve or, more significantly, because they were surprised by the curve alignment (Lyles, et al., 1997). In reviewing literature on driver behavior on rural road curves, Johnston (1982) reported that horizontal curves that are less than 1960 ft in radius on two-lane rural roads, and those requiring a substantial reduction in speed from that prevailing on the preceding tangent section, were disproportionately represented among crash sites.
Successful curve negotiation depends on the choice of appropriate approach speed and adequate lateral positioning through the curve. Many studies have shown that loss-of-control crashes result from an inability to maintain a lateral position through the curve because of excessive speed, with inadequate deceleration in the approach zone. These problems, in turn, stem from a combination of factors, including poor anticipation of vehicle control requirements, induced by the driver's prior speed, and inadequate perception of the demands of the curve.
Many studies report a relationship between horizontal curvature (and the degree of curvature) and the total percentage of crashes by geometric design feature on the highways. The reasons for these crashes are related to the following inadequate driving behaviors:
With respect to vertical curves, design policy is based on the need to provide drivers with adequate stopping sight distance (SSD). That is, enough sight distance must exist to permit drivers to see an obstacle soon enough to stop for it under some set of reasonable worst-case conditions. The parameters that determine sight distance on crest vertical curves include the change of grade, the length of the curve, the height above the ground of the driver's eye, and the height of the obstacle to be seen. SSD is determined by the driver's reaction time, design speed, and deceleration rate. Current practice assumes an obstacle height of 2.0 ft and controlled braking rather than locked-wheel braking (AASHTO, 2004). Minimum lengths of crest vertical curves are based on sight distance and driver comfort. These criteria do not currently include adjustments for age-related effects in driving performance measures, which would suggest an even more conservative approach. At the same time, the general lack of empirical data demonstrating benefits for limited sight-distance countermeasures has led some to propose liberalization of model criteria, such as obstacle height (Neuman, 1989; Fambro, Fitzpatrick, and Koppa, 1997).
Standards and criteria for sight distance, horizontal and vertical alignment, and associated traffic control devices are based on the following driver performance characteristics: detection and recognition time, perception-reaction time, decision and response time, time to perform brake and accelerator movements, maneuver time, and (if applicable) time to shift gears. However, these values have typically been based on driving performance (or surrogate driving measures) of the entire driving population, or have been formulated from research biased toward younger (college age) as opposed to aging driver groups. The models underlying these design standards and criteria therefore have not, as a rule, included variations to account for slower reaction time or other performance deficits consistently demonstrated in research on aging driver response capabilities. In particular, diminished visual performance (reduced acuity and contrast sensitivity), physical capability (reduced strength to perform control movements and sensitivity to lateral force), cognitive performance (attentional deficits and declines in choice reaction time in response to unpredictable stimuli), and perceptual abilities (reduced accuracy of processing speed-distance information as required for gap judgments) combine to make the task of negotiating the highway design elements addressed in this section more difficult and less forgiving for aging drivers.
With the increasing need to provide more capacity on freeways and urban arterials, more jurisdictions are moving to the use of reversible lanes to accommodate peak-period traffic flows. The control of wrong-way movements on these facilities may be accomplished through the use of lane control signals (LCS), which provide real-time information to motorists about which lanes are open (green downward arrow), which are closed (red X) and which lanes are about to be closed (yellow X) either because of an incident downstream or because the lane is a reversible lane. Drivers should vacate lanes designated with a yellow X and should not enter lanes designated with a red X. Safe and effective responses to these indications by aging drivers hinge upon visual target detection and recognition processes that decline with advancing age.
White edge lines on horizontal curves (see Figure 51) are to be maintained at the following in-service contrast levels:
Contrast should be calculated according to this formula:

* Luminance is the amount of light reflected from an object. This is different from retroreflectivity, which is a property of a material. While increasing retroreflectivity generally results in higher luminance, (often described as brightness)—especially at night—this may vary greatly for the same object or marking depending upon such factors as the location and intensity of the source of illumination, and the angle at which a driver views it.
References *: MUTCD: 4
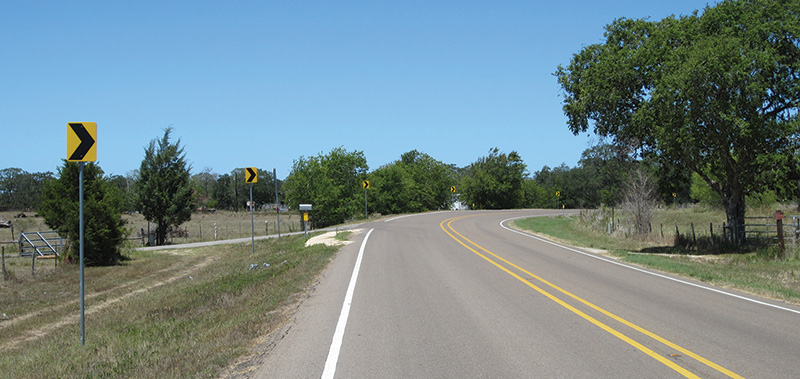
Figure 51. White edge lines, centerline RPMs, and chevrons on a horizontal curve
The use of retroreflective raised pavement markers (RPMs) is recommended to improve the visibility of surface delineation treatments on horizontal curves in the following situations where demands on motorists for path maintenance and vehicle guidance are increased:
References *: MUTCD: 4
In addition to the installation of chevron alignment signs (W1-8) as specified in the MUTCD, roadside post-mounted delineators should be installed on horizontal curves with approximate uniform spacing as shown in Table 7.
References *: MUTCD: 2
| Radius of Curve (Feet) | Approximate Spacing (Feet) |
|---|---|
| < 600 | 40 |
| 700 | 75 |
| 800 | 80 |
| 900 | 85 |
| > 1000 | 90 |
Note: Spacing for curves greater than 600 ft based on the following formula from the MUTCD (Table 3D-1):
![]()
Where:
On two-lane rural roads, the combined (lane plus shoulder) paved width in one direction should be at least 18 ft throughout the length of the curve for a horizontal curve with a radius less than 1900 ft.
References *: Green Book: 4
The rationale and supporting evidence for this treatment can be found beginning on page 260 of this Handbook.
To accommodate the exaggerated decline among aging drivers in response to unexpected hazards, strict adherence to a perception-reaction time (PRT) of at least 2.5 sec for a roadway hazard obscured by the vertical curvature should be used in the design of new and reconstructed facilities.
References *: Green Book: 1
Where a need has been determined for installation or replacement of a device to warn motorists that sight distance is restricted by a crest vertical curve, use the 30-in x 30-in HILL BLOCKS VIEW sign (MUTCD W7-6) with an Advisory Speed plaque (MUTCD W13-1P) as shown in Figure 52.
References *: MUTCD: 2
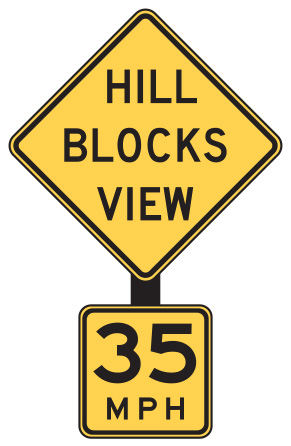
Figure 52. (MUTCD W7-6 and W13-1P)
If a signalized intersection is obscured by vertical curvature in a manner that the signal becomes visible at a preview distance of 8 s or less (at operating speed), then it is recommended that, in addition to the standard advance signal warning sign (MUTCD W3-3), a BE PREPARED TO STOP warning sign (MUTCD W3-4) and WHEN FLASHING plaque (MUTCD W16-13) be used along with a warning beacon interconnected with the traffic signal controller (see Figure 53). The yellow warning beacon should be activated at a sufficient interval prior to the onset of the yellow signal phase and sustained after the onset of the green signal phase to take into account the end of queues experienced during peak traffic conditions, as determined through engineering study. [See time-speed-distance table on page 5.]
References *: MUTCD: 2
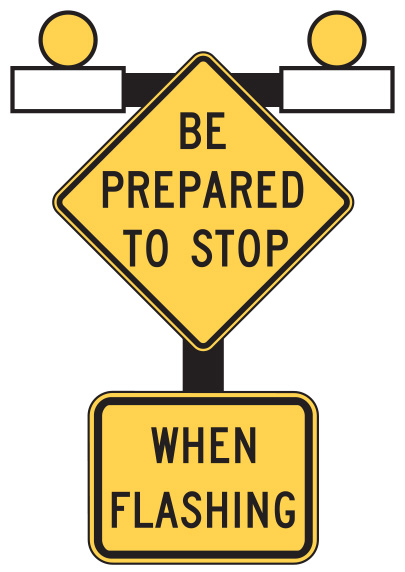
Figure 53. (MUTCD W3-4 and W16-13)
The rationale and supporting evidence for these treatments can be found beginning on page 272 of this Handbook.
To accommodate age-related difficulties in judging gaps and longer decision-making and reaction times exhibited by aging drivers, use the most conservative minimum required passing sight distance (PSD) values from the 2009 MUTCD, Table 3B-1. See Table 8.
References *: Green Book: 2, TEH: 2, MUTCD: 1
| 85th-Percentile or Posted or Minimum Passing | Statutory Speed Limit Sight Distance |
|---|---|
| 25 mph | 450 feet |
| 30 mph | 500 feet |
| 35 mph | 550 feet |
| 40 mph | 600 feet |
| 45 mph | 700 feet |
| 50 mph | 800 feet |
| 55 mph | 900 feet |
| 60 mph | 1,000 feet |
| 65 mph | 1,100 feet |
| 70 mph | 1,200 feet |
Use of the MUTCD oversized (48-in x 64-in x 64-in) NO PASSING ZONE pennant (W14-3), or the standard size (36 in x 48 in x 48 in) using fluorescent yellow retroreflective sheeting, is recommended as a high-conspicuity supplement to conventional centerline pavement markings at the beginning of no passing zones (see Figure 54).
References *: MUTCD: 1, MUTCD: 3
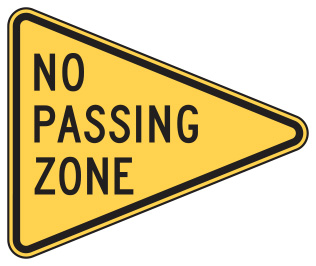
Figure 54. (MUTCD W14-3)
To the extent feasible for new or reconstructed two-lane facilities, the implementation of passing/overtaking lanes (in each direction) at intervals of no more than 3.1 mi is recommended.
References *: Green Book: 4, TEH: 4
The rationale and supporting evidence for these treatments can be found beginning on page 277 of this Handbook.
To increase the legibility distance of overhead lane-control signal indications for prohibited movements (red X), use a double-stroke arrangement of pixels that are small (approximating 0.15 in diameter) and closely spaced (approximating 0.70 in center-to-center), as shown in Figure 55.
References *: MUTCD: 4
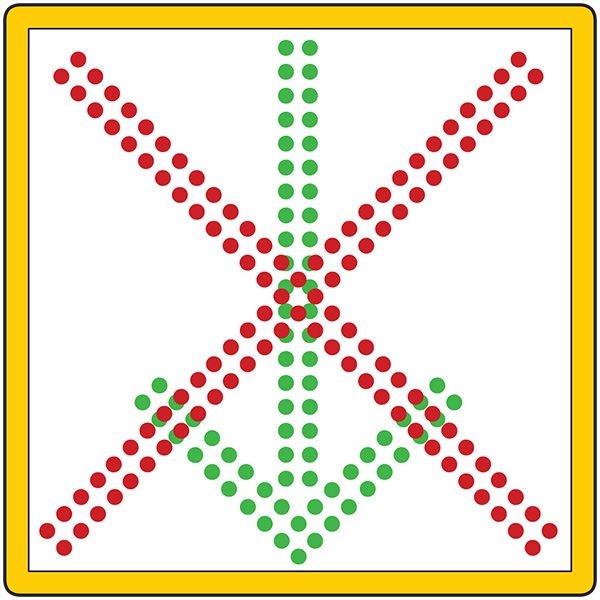
Figure 55. Lane Control Signal (adapted from Ullman et al. 1996)
The rationale and supporting evidence for these treatments can be found beginning on page 281 of this Handbook.
These are treatments being utilized by transportation agencies that should benefit aging road users as determined by a subjective assessment by staff participating on the development of this Handbook. Current trends indicate these practices have a positive impact on aging road user safety.
To provide additional guidance where a through lane becomes a mandatory turn lane at an intersection or becomes a mandatory exit lane at an interchange, a "dotted" lane line should be used to separate the continuing through lane from the mandatory turn or mandatory exit lane, as described in Section 3B.04 of the 2009 MUTCD and as shown in Figure 56.
References *: MUTCD:1
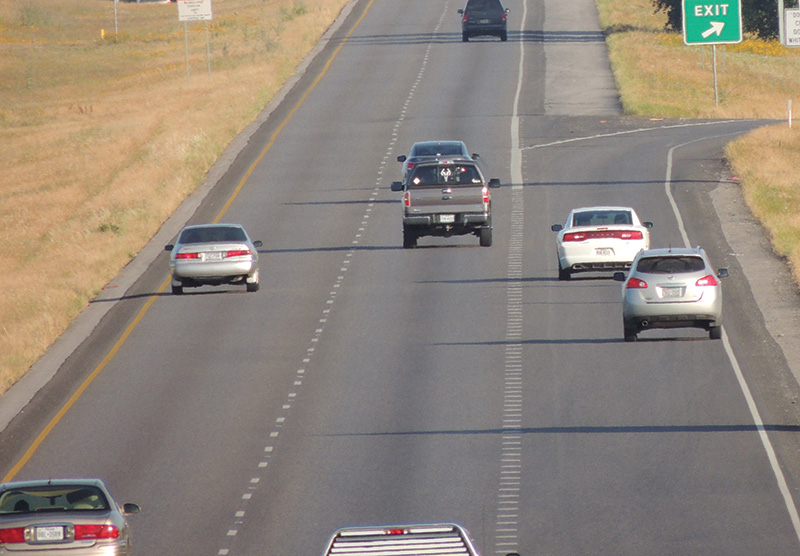
Figure 56. Dotted Lane Line Markings at Freeway Lane Drop
The rationale and supporting evidence for these treatments can be found beginning on page 284 of this Handbook.
Contrast markings should be used wherever the pavement color is light to increase visibility of pavement markings (see MUTCD Section 3A.05 and Figure 57).
References *: MUTCD:1
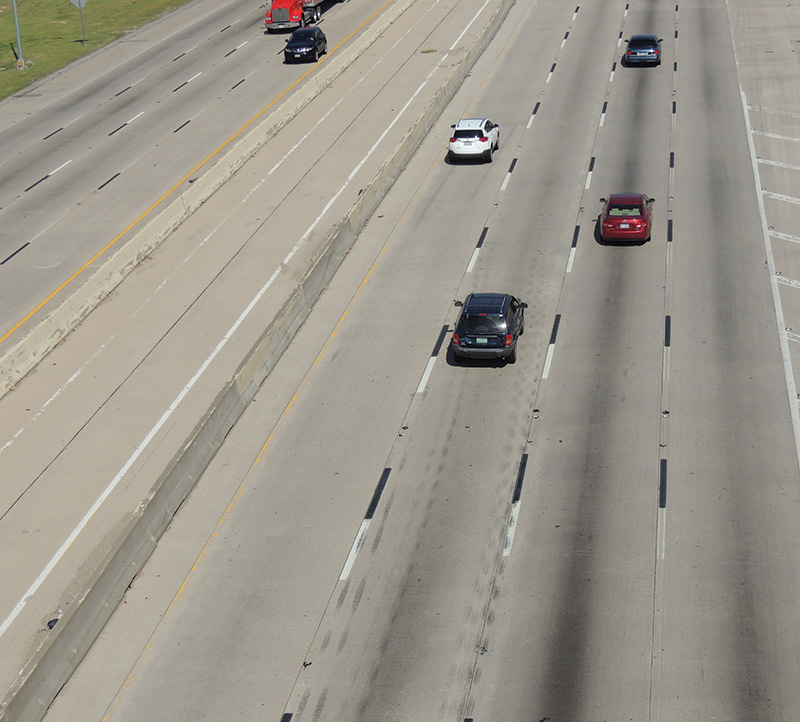
Figure 57. Contrast Markings on Light Colored Pavement
The rationale and supporting evidence for these treatments can be found beginning on page 284 of this Handbook.
To maintain visibility under adverse driving conditions, use highly retroreflective marking material.
References *: MUTCD:4
The rationale and supporting evidence for these treatments can be found beginning on page 285 of this Handbook.
Curve warning pavement markings, such as shown in Figure 58, should be considered as a supplement to curve warning signs at horizontal curves identified as a safety problem.
References *: TEH: 4, FHWA:2, MUTCD:5
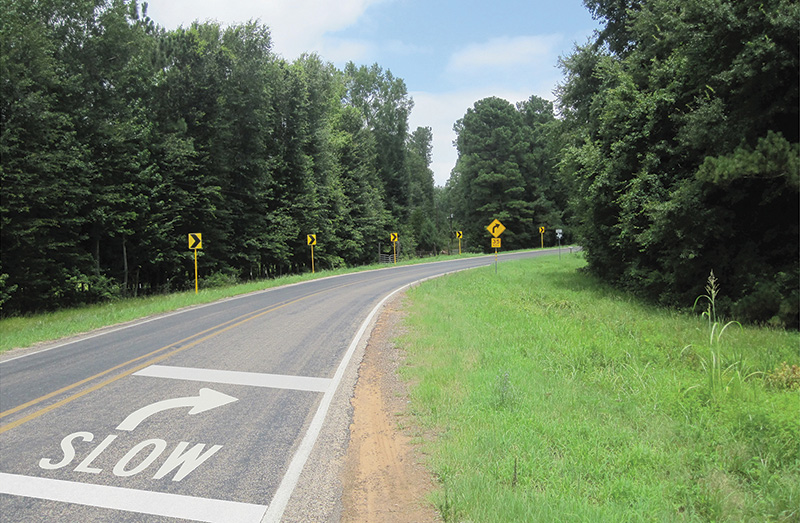
Figure 58. Curve Warning Markings (MUTCD:5)
The rationale and supporting evidence for these treatments can be found beginning on page 285 of this Handbook.
The classic roadway reconfiguration commonly referred to as a "road diet" involves converting an undivided four-lane roadway into three lanes made up of two through lanes and a center two-way left turn lane. An example of a completed road diet is shown in Figure 59. When performing an evaluation or road safety audit of a roadway segment that may be redesigned or reconstructed, a road diet should be included among the options to be considered.
References *: HCM:1
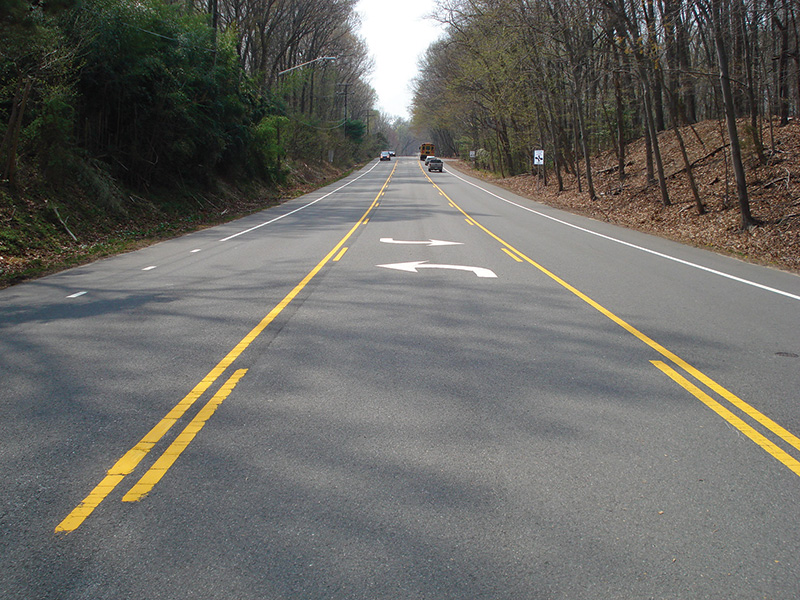
Figure 59. Example of Road Diet
The rationale and supporting evidence for these treatments can be found beginning on page 286 of this Handbook.
High friction surface treatments (HFST) are the site-specific application of very high quality polish-resistant, abrasion-resistant aggregates bonded to the pavement surface using a polymer binder that restores and maintains pavement friction where the need for a safer pavement surface is the greatest.
HFSTs are recommended on horizontal and vertical curves (such as the example shown in Figure 60), at intersections, at on and off-ramps, on bridge decks, locations prone to frequent rain, snow, or ice, or where additional side friction is beneficial.
References *: Green Book:1
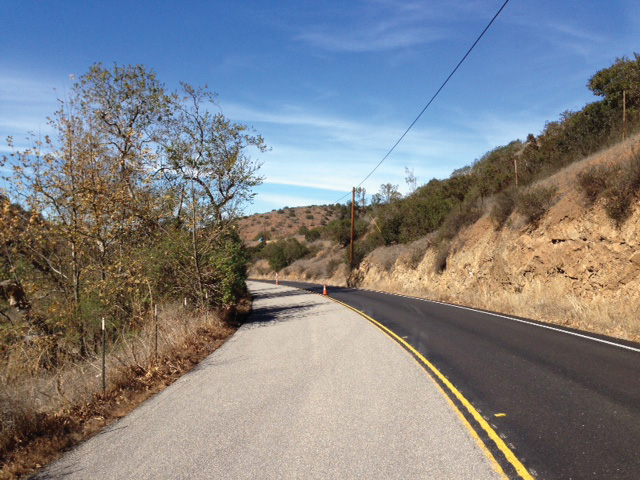
Figure 60. High Friction Surface Treatment on a Horizontal Curve
The rationale and supporting evidence for these treatments can be found beginning on page 287 of this Handbook.
See pages 3 and 4 for full description of codes and acronyms of cited design guides.

