U.S. Department of Transportation
Federal Highway Administration
1200 New Jersey Avenue, SE
Washington, DC 20590
202-366-4000
| < Previous | Table of Contents | Next > |
Horizontal curves only comprise 10 percent of the rural roadway network in Minnesota; yet from 2003 to 2011, 20 percent of crashes occurred on curves (when reviewed in five-year increments). The crash data revealed that over 25 percent of the fatal and serious injury crashes occurred at curves. Moreover, over 30 percent of the fatal and serious injury roadway departure crashes occurred at curves.

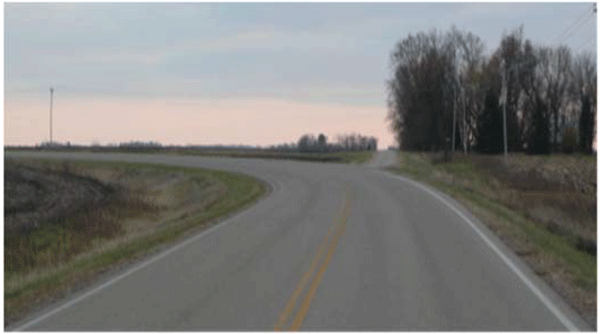
Figure B-1. Photo. Example of a visual trap; one of MnDOT's five risk factors for horizontal curves.
In 2007, the Minnesota Department of Transportation (MnDOT) completed and delivered the first phase of County Safety Plans and District Plans in an effort to improve curve safety. MnDOT started with studies in Olmsted County in Southern Minnesota, and then expanded to 20 other counties and eventually, all 87 counties. The first phase of the analysis examined data from 2003-2007 and revealed there were nearly 6,900 curves in the State, 77 fatal crashes, 150 A injury (serious) crashes, 349 B injury (moderate) crashes, 394 C injury (minor) crashes, and 1,117 Property Damage Only (PDO) crashes. It took approximately three years to complete the analysis process and the data range kept moving as data became available. The final analysis used county data from 2007-2011. From the analysis, MnDOT identified five risk factors these high-crash curves had in common, including:
Beginning in 2010, action was taken to address the curves that exhibited three or more of the five risk factors with the systemic approach to reduce crashes (http://safety.fhwa.dot.gov/systemic).
Despite some hesitancy to supplement the traditional reactive approach to safety with a proactive approach, the program was launched in all 87 counties and 8 districts in 2010. MnDOT has also since recommended treating thousands of curves on state-maintained roads.
County and district traffic engineers are provided a list of high risk curves and recommended potential project types to select from. Based on that list, each county and district is responsible for submitting candidate projects and, if selected, contract and construction administration on their system.

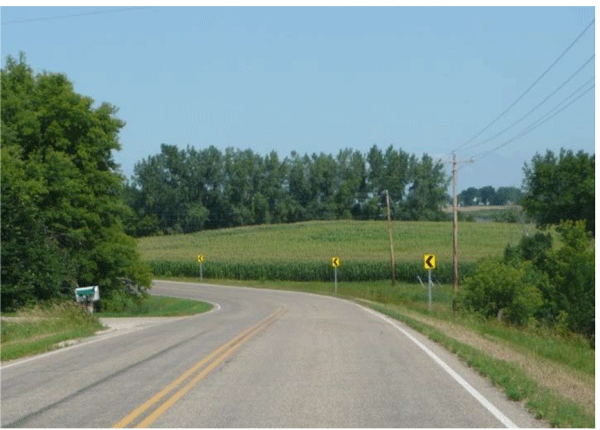
Figure B-2. Photo. MnDOT installed chevrons as part of their Systemic Safety Improvements Program.
As part of their systemic program, MnDOT has recommended installing several countermeasures including edge line and center line rumble strips, advanced signing, 2-foot shoulder paving adding rumble strips and Safety EdgeSM, 6-inch edge lines, intersection lighting when there is an intersection in a curve, and delineators. Chevrons have been the most commonly installed countermeasure as part of this program. The districts received funds from direct capital funds, Highway Safety Improvement Program (HSIP), and Section 164 safety funds. Counties received funding from HSIP in addition to their own capital program. MnDOT's "sharing" of the Federal HSIP funds with local agencies was critical to the success of the program. Without those funds the plans would not have been able to be implemented on the county/local system.
Minnesota has recorded a drop in roadway departure crashes from 2009 to 2013. Although definitive data are not yet available, it is assumed that the systemic safety improvement program contributed to the decrease in crashes. Detailed information about the performance of individual curves will be needed in order to further quantify the program effectiveness. Additionally, the general public has provided MnDOT with unsolicited positive feedback in response to the treatments, especially regarding the chevrons, enhanced (6-inch) edge lines, and lighting.
MnDOT noted that effective communication with the general public and local agencies has played a large part of the program's success. The approval of the public is a crucial aspect of moving a program from idea to reality. MnDOT noted that while the Highway Safety Manual (HSM) is an important tool for modeling to show proposed projects' safety benefits, the general public do not generally have the background knowledge to understand the methodology. They may even become suspicious that the agency is masking information or motivations behind the numbers. MnDOT showed consideration for the public by creating programmatic goals and objectives that were accessible and easy to understand, which in turn contributed to the public's support of the program.
Brad Estochen and Derek Leuer from MnDOT provided the information for this case study. Visit http://www.dot.state.mn.us/ for additional information. All images are courtesy of MnDOT.
| < Previous | Table of Contents | Next > |
