U.S. Department of Transportation
Federal Highway Administration
1200 New Jersey Avenue, SE
Washington, DC 20590
202-366-4000
Download Version PDF [733 KB]
![]()

![]()
This document is disseminated under the sponsorship of the U.S. Department of Transportation in the interest of information exchange. The U.S. Government assumes no liability for the use of the information contained in this document. The U.S. Government does not endorse products or manufacturers. Trademarks or manufacturers' names appear in this report only because they are considered essential to the objective of the document.
The Federal Highway Administration (FHWA) provides high-quality information to serve Government, industry, and the public in a manner that promotes public understanding. Standards and policies are used to ensure and maximize the quality, objectivity, utility, and integrity of its information. FHWA periodically reviews quality issues and adjusts its programs and processes to ensure continuous quality improvement.
| 1. Report No. |
2. Government Accession No. | 3. Recipient’s Catalog No. | |
| 4. Title and Subtitle Motorcoach Roadway Safety Assessment Tool User's Manual |
5. Report Date May 2014 |
||
| 6. Performing Organization Code | |||
| 7. Author(s) Alan Blatt, Kevin Majka, Susan Schock |
8. Performing Organization Report No. FHWA-SA-14-103 |
||
| 9. Performing Organization Name and Address
Center for Transportation Injury Research (CenTIR) |
10. Work Unit No. | ||
| 11. Contract or Grant No. DTHF61-07-H-00023 CENTIR II |
|||
| 12. Sponsoring Agency Name and Address
Federal Highway Administration (FHWA) |
13. Type of Report and Period Covered User's Manual |
||
| 14. Sponsoring Agency Code FHWA |
|||
| 15. Supplementary Notes The investigation was conducted in cooperation with the U. S. Department of Transportation, Federal Highway Administration. The contract manager for this project was Keith D. Williams |
|||
| 16. Abstract This document is the installation guide and user’s manual for The Motorcoach Roadway Safety Assessment Tool (Motorcoach Motorcoach RSAT). The motorcoach Motorcoach RSAT is an assessment tool for states to use to identify and evaluate the safety of rural routes that are utilized by motorcoaches. It utilizes inputs from transportation and EMS professionals to measure crash risk along a route, as well as the robustness of communications, EMS response capabilities, and proximity to hospitals and trauma centers. |
|||
| 17. Key Words Motorcoach, Safety |
18. Distribution Statement No restrictions This document is available to the public through National Technical Information Center, Springfield, Virginia 22161 |
||
| 19. Security Classification (of this report) Unclassified |
20. Security Classification (of this page) Unclassified |
21. No. of Pages 25 |
22. Price |
Form DOT F 1700.7 (8-72)


January 15, 2015
Submitted by:
Center for Transportation Injury Research (CenTIR)
CUBRC Inc.
4455 Genesee St
Buffalo, NY 14225
Submitted to:
U.S. Department of Transportation
Federal Highway Administration
1200 New Jersey Ave., SE
Washington, DC 20590
| Technical Point of Contacts: | Contract Point of Contact: | |
| Alan Blatt Director, CenTIR CUBRC 716-204-5138 blatt@cubrc.org |
Kevin Majka Principal Investigator, FA 15 CUBRC 716-204-5144 majka@cubrc.org |
Susan Schock Contract Manager CUBRC 716-204-5137 susan.schock@cubrc.org |
The Roadway Safety Assessment Tool (RSAT) is an assessment tool for states to use to identify and evaluate the safety of rural routes that are utilized by motorcoaches. It utilizes inputs from transportation and EMS professionals to measure crash risk along a route, as well as the robustness of communications, EMS response capabilities, and proximity to hospitals and trauma centers. In essence RSAT is a collection of defined methodologies for ingesting, processing, analyzing, and mapping of data for the assessment of roadway safety for motorcoach travel. RSAT is based on a geographic information system (GIS) platform that utilizes ArcGIS for processing data and Google Earth for visualization. A working of knowledge of ArcGIS is necessary to perform additional processing and manipulation of the data while only a basic understanding of Google Earth is necessary to visualize the data. The details of installing and utilizing the two pieces are described in the following sections.
RSAT is distributed in a single compressed (RSAT.zip) file folder containing the data and files to support processing and visualization of the data. Separate access is required to ArcGIS Desktop Basic Edition 10.2 with Spatial Analyst extension for processing and Google Earth 7.1 is required for visualization. Google Earth can be downloaded here: http://www.google.com/earth/download/ge/agree.html. After unzipping the RSAT folder should be placed in the top level of the local hard disk (C:)
The RSAT folder contains a wealth of example data layers in point, line, and raster format on various infrastructure and safety data. The folder with the data should look similar to the following:
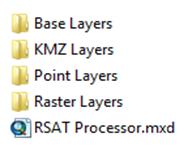
'Base Layers' contains background ESRI Shapefiles for Lakes (Lakes_US), Neighboring Countries (neighcountry), Major Roadways (NHPN), Major Roadway Centroids (NHPN_Centroids), Scored Roadways (NHPN_Scored), and State Boundaries (States).
'KMZ Layers' contains Google Earth files in raster format for Air Medical Service Providers (AAMB), Communications (CELL), Aggregated Safety Scores (CUMLATIVE), Fatal Crashes 2007-2011 (FARS), Ground Ambulance Depots (GAMB), and Locations of Level 1, 2, and 3 Trauma Centers (TC). In addition a vector file is also provided for Scored Roadways (NHPN).
'Point Layers' contains ESRI Shapefiles for Fatal Crashes 2007-2011 (FARS_07_11) obtained from http://www.nhtsa.gov/FARS. Other layers used in demonstrating RSAT can be obtained from their respective agencies or substituted with user supplied data on: Air Medical Service Providers (AirAmbulance) obtained from http://www.adamsairmed.org/ , Communications (CellTowers) and Ground Ambulance Depots (Ground Ambulance) obtained from https://www.hifldwg.org/, and Locations of Level 1, 2, and 3 Trauma Centers (TraumaCenters) obtained from http://www.amtrauma.org/?page=TIEP.
'Raster Layers' contains ESRI files in raster format in two folders for UnClassed (raw distance data) and ReClassed (standardized distance data) for Air Medical Service Providers (AAMB), Communications (CELL), Aggregated Safety Scores (EQUALWEIGHT), Fatal Crashes 2007-2011 (FARS), Ground Ambulance Depots (GAMB), Locations of Level 1 Trauma Centers (TC1), Locations of Level 1, and 2 Trauma Centers (TC12), and Locations of Level 1, 2, and 3 Trauma Centers (TC123).
As previously mentioned 'RSAT Processor.mxd' launches the processor application in ArcGIS.
The sources of the data are as follows:
The RSAT processor was designed to be used with ArcGIS 10.2. After this software has been installed the RSAT Processor application can be opened to create, manage, and process infrastructure and safety data. To start the RSAT Processor open 'RSAT Processor.mxd' by double clicking on it. The start-up screen will look similar to below:
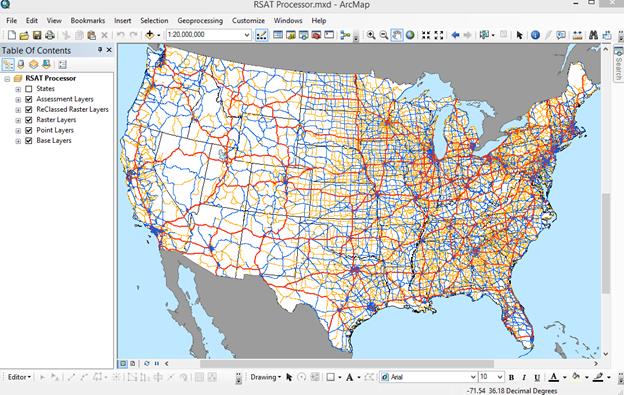
The RSAT processor allows users to selectively browse the different data sets previously discussed as well as process and implement new data layers. Any data set that is considered relevant to the assessment of safe motor coach travel can be imported as an ESRI point shapefile. The Following example will demonstrate adding new data or working with existing data to create an overall safety raster layer and highway line file.
Point based layers can be added for national, regional or the local level.
![]()
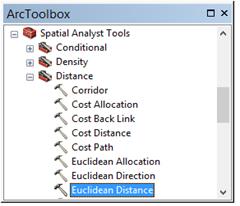
This step will create a continuous raster image which measures the distance in a straight line to the nearest asset in the point layer that was previously added. Navigate to:
ArcToolbox > Spatial Analyst >Euclidian Distance
In the Euclidean Distance dialog box set the input as the layer of interest. Name a output raster file name and location, leave maximum distance blank, set output cell size to 1,609.34 (1 mile grid in meters), and output direction blank.
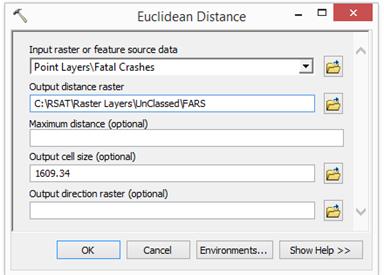
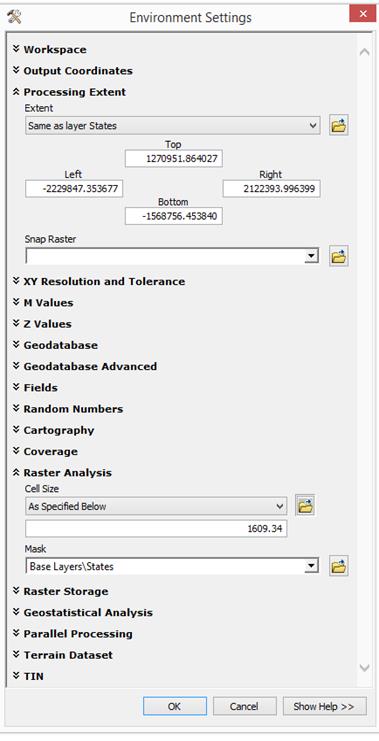
Click on the 'Environments...' button and then expand Environment Setting>Processing Extent. Set Extent to 'Same as layer States'. This limits the analysis search and measurement functions to be contained within boundary of the US states. In 'Raster Analysis' set cell size to be 'As Specified Below' to 1609.34 (1 mile grid as measured in meters). Set 'Mask' to 'BaseLayers\States' to show the output raster only within the confines of the US states boundary layer.
Next select 'OK' for Environment Settings and the 'OK' for Euclidean Distance. The result should be a continuous value grid for the continental US. Analysis can be done with the resulting layer or it may be standardized for use with additional data. To standardize proceed with step 3.
This step allows the user to create standardized values for the distribution of values that were computed in the previous step. The standardized values can then be added to other dissimilar layers that have also been standardized.
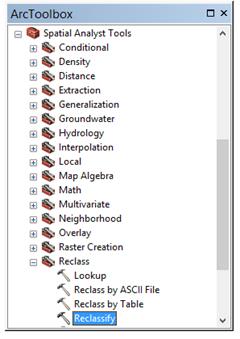
ArcToolbox > Spatial Analyst > Reclass > Reclassify
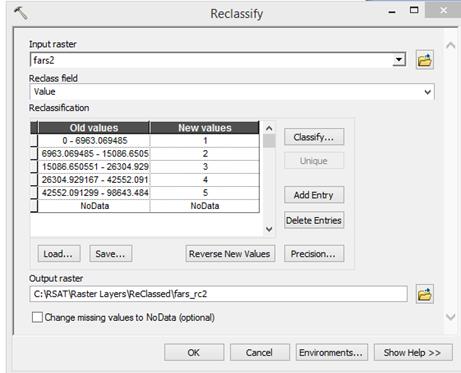
Set the parameters for the reclassification by selecting the input raster. Next set the reclass field to 'Value' and set the output raster to the desired location and name.
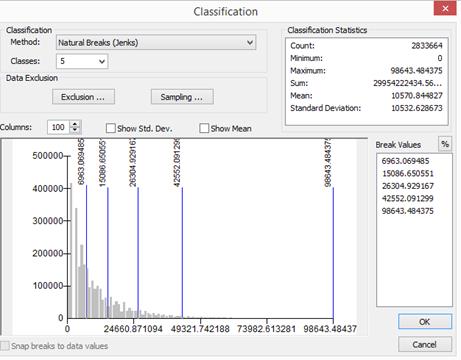
Next click on 'Classify' and set the method to Natural Breaks (Jenks) and Classes to 5. Alternatively, a different statistical method can be used to classify the value such as equal breaks, equal interval or standard deviation as deemed appropriate by the analyst.
Next select 'OK' for Classification and the 'OK' for Reclassify. The result should be a continuous value grid for the continental US similar to the raster created previously but with standardized grid values.
After steps 1-3 are repeated for all layers of interest that can be combined to produce a similar cumulative score. In this method, weighting of individual layers can be used to adjust the relative importance of those assets to the overall calculated safety score. Navigate to:
ArcToolbox > Spatial Analyst > Map Algebra > Raster Calculator
Add together all layers of interest and give appropriate weights to each layer based on a 0-1 scale. Note: proximity to beneficial layers should be weighted as positive values while proximity to detrimental layers i.e. fatal crashes should weighted as negative. The default value to set beneficial assets to is 1.0 and -1.0 for harmful assets). The analyst should provide appropriate values that are consistent with their understanding of available assets and distribution in the study area.
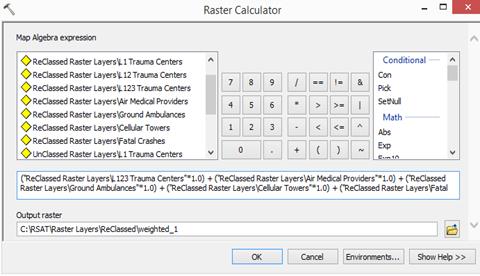
Select 'OK' for Raster Calculator to generate the overall safety raster layer.
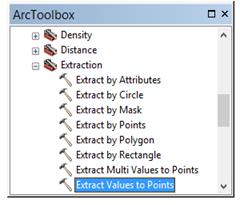
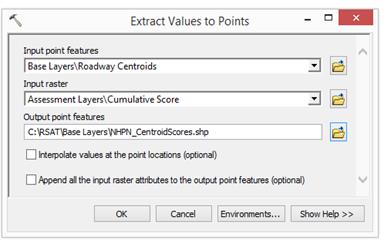
This step will allow the user to
ArcToolbox > Spatial Analyst > Extraction > Extract Values to Points
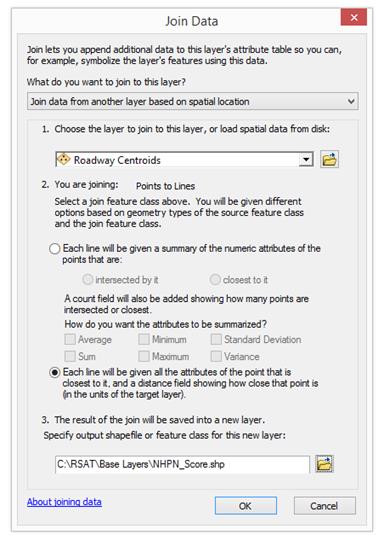
Next, right click on the Major Roadways layer under Base Layers in the table of contents. Select Joins and Relates and then Join.
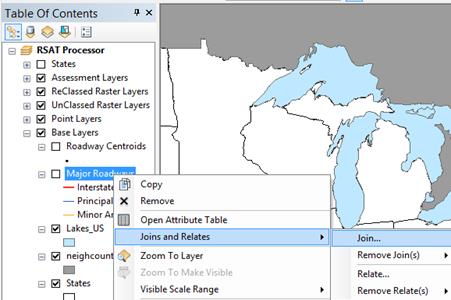
In the Join dialog box under the 'What do you want to join to this layer?' Select Join data from another layer based on spatial location. In item number one select the name of the file that was created in 'Extract Values to Points' procedure. In item number two select the second radio button to give each line the attributes (score) of the nearest point. Due to the fact that that the roadways centroids were created from the roadway line segments there will be a one-to-one association with no ambiguity. For item three, select a name and location for the output file.
The result of this step will be scored roadways for the continental US. They can be viewed or analyzed in ArcGIS to assess areas of at-risk travel due to the lack of available resources.
In order to make this data more accessible to a wider audience that does have working knowledge of ArcGIS or spatial data handling procedures, one additional step will be taken to convert the data to Google Earth format.
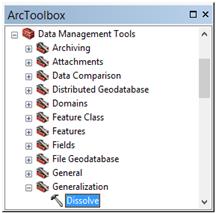
To convert the scored roadways layer to manageable size for viewing in Google Earth, navigate to: ArcToolbox > Data Management Tools > Generalization > Dissolve
In the dissolve dialog box select the scored roadway file as the input feature. Set an output file name and destination. Set the dissolve field to the raster value field that was created for this layer in step 5 (RASTERVA_1 or other). Check multipart features to allow ArcGIS to create a single feature for each roadway with a common value.
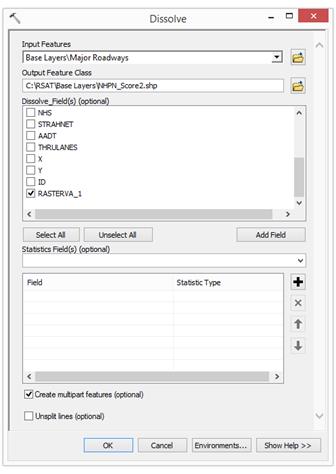
After clicking OK a file will be generated that groups all roadways of similar scores thus reducing the file from greater than 141,000 records to less than 20. This will ensure that the file can be viewed efficiently in Google Earth.
Next, each file that the user intends to view in Google Earth can be exported from ESRI format to a compressed Google Earth format (KMZ). The first set is to save each data set as a layer file. Right click on each layer to export and select 'Save as Layer File…'. Select a file name and destination.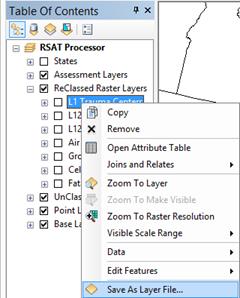
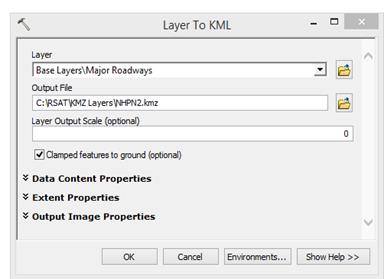
Next, navigate to: ArcToolbox > Conversion Tools > To KML > Layer to KML

In the Layer to KML dialog box select the layer to convert that was created in the previous step. Next select a file name and destination for the Google Earth KMZ file. Leave layer output scale to zero; check clamp feature to ground and leave the other extents set to the defaults.
Click ok and repeat the steps for save as layer and layer to KML for each set of data the user intends to view in Google Earth.
The processing of the data layers is now complete and the user can launch the RSAT Visualizer as described in the next section.
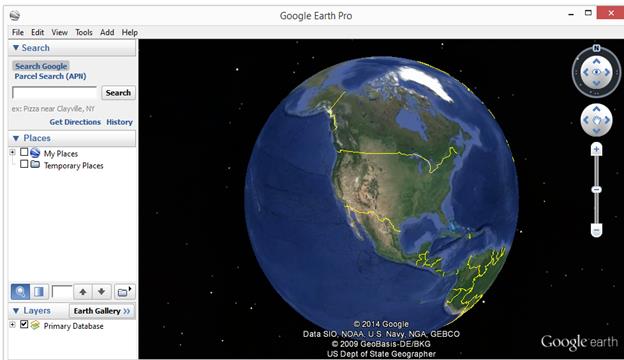
The RSAT Visualizer will allow users to explore the data layers included in the tool delivery as well as any new layers created by the analyst in ArcGIS. After downloading Google Earth from the link provided at the beginning of this document, follow the instructions provided by Google to install the software. Upon starting Google Earth you should be greeted with a similar screen as that below:
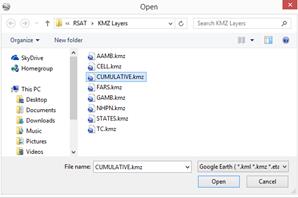
Upon using the RSAT data for the first time each layer will need to be opened in Google Earth and moved to the 'My Places' section for viewing at a later date. To open each of the KMZ layers included with the tool or additional layers created in ArcGIS open the File Menu and select Open. Navigate to the folder where the KMZ files are stored (the included RSAT layers are in RSAT>KMZ Layers). Repeat to open each layer intended to be viewed.
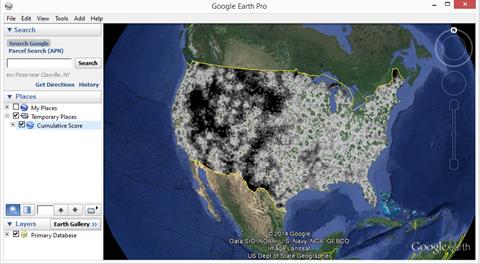
Google Earth will drape the image over the background globe resulting in the following:
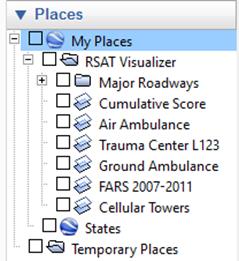
In order to have the images load upon opening of Google Earth in the future they need to be moved to 'My Places'. To move each layer drag and drop them from 'Temporary Places' to 'My Places'. After all layers have been added and moved it should look similar to the following:
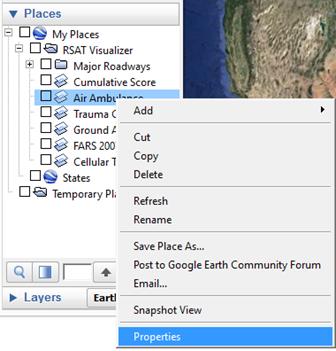
To change the transparency of raster files and style of markers, lines, or fills on vector files right-click on the layer and select Properties.
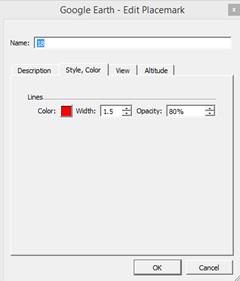
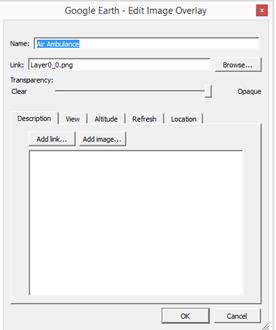
The Edit Image Overlay dialog box allows the user to adjust the transparency of the layer or adjust its spatial attributes (See Google Earth for Documentation). The Edit Placemark dialog box allows users to change the styles of markers, outlines and fills as well as adjust spatial attributes.
All of the layers should now be ready to view in the Google Earth. Additional Features and layers are also available in Google Earth to perform additional analysis such as overlaying routes, traffic, places, and pictures. For additional information on the features of Google Earth please access the following: https://support.google.com/earth/answer/176145?hl=en&ref_topic=4363013
1For users who wish to visualize the included data immediately skip ahead to RSAT Visualizer

