U.S. Department of Transportation
Federal Highway Administration
1200 New Jersey Avenue, SE
Washington, DC 20590
202-366-4000
In the future, FHWA envisions a safety planning process where transportation organizations are able to optimize the selection of roadway safety infrastructure improvements across a roadway system and use performance management practices to track progress and achieve safety performance targets. This report seeks to promote FHWA's Safety Focused Decision Making Framework as it takes a more holistic programmatic approach to traditional safety planning.
The Framework, depicted in Error! Reference source not found., is defined by five high-level activities with continuous feedback loops for data collection and analysis and project modifications to enhance safety impacts. The steps below would follow the broader planning process and assume that States and MPOs have already defined their Vision and Mission. The project identification described below would support development of and attainment of goals.
Figure 1: FHWA's Safety Focused Decision Making Framework
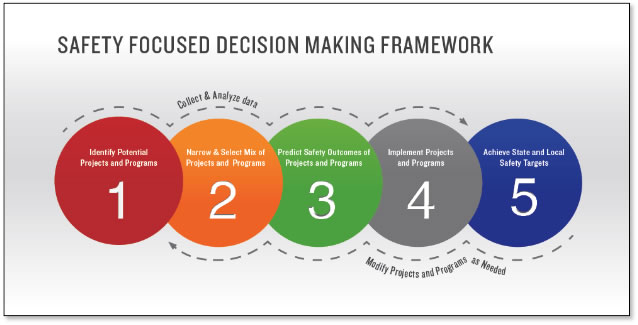
For the Safety Focused Decision Making Framework, States and MPOs will begin by identifying a list of potential projects, programs or strategies that will serve as the foundation of the larger safety program. Then, they will work to refine that list through a prioritization exercise designed to select the activities best suited to affect the greatest safety impact for the available funds within the given transportation environment. Following prioritization, the prediction of the safety outcomes will help provide the necessary justification for funding and implementation of the selected mix of projects, programs and behavioral strategies. Once approved and funded, states and MPOs will then work to implement the selected activities. As states and MPOs mature this process, their data collection and analysis and evaluation of program effectiveness will improve. Use of robust data sets combined with use of safety planning tools, processes and best practices allows transportation organizations to increase the accuracy with which they predict the impact of certain activities; identify the most effective approaches and will support their program evaluation frameworks, weeding out the least impactful projects and more effectively driving decision making.
Leveraging the new Safety Focused Decision Making Framework is essential to closing the current gaps as well as to achieve an improved safety planning environment. By improving the way states and MPOs conduct safety planning activities at a programmatic level, FHWA will be able to better promote the most effective new tools and practices to its various stakeholders and partners. Additionally, it will yield more robust data sets that enhance the predictive capabilities of safety analysis tools, given different parameters.
Selecting the right projects and programs to undertake at the appropriate times is a necessary component to improving transportation safety. Safety project selection methods vary depending on the organization, but commonly used practices include hot spot or spot analysis, road safety audits, systemic approach, and benefit/cost analysis. Adoption of specific practices generally depends on the organizational capabilities and available resources, including staff with analytical skill sets and access to the necessary sources of data. The challenge is leveraging the available data to formulate a mix of projects that lead to an effective safety program.
One notable practice is mandating performance measurement as a requirement for all program activities. Data-driven decision making and continuous review of performance is deeply ingrained in Washington State's Department of Transportation (WSDOT). Their project selection process stems in large part from state policies and governance structure, and supports the organization's emphasis on using data to drive safety program decisions. All program and project selections must be aligned to the Governor's SHSP goal of zero fatalities and serious injury collisions by 2030. This goal is also referred to as Washington's Target Zero Program. One difference between Washington State and many other state DOTs is that the Washington State Legislature specifically directs WSDOT to develop methodologies for selecting state roadway investment projects to address deficiencies on the state roadway system through Chapter 47.05 of the Revised Code of Washington (RCW). The code requires that the project selection methodologies be based on factual need and an evaluation of life cycle costs and benefits.
Based on this directive, WSDOT evaluates the full life cycle costs and benefits of all proposed projects in order to select projects that offer the greatest performance per dollar spent. Projects are evaluated within categories of funding so that potential safety projects are evaluated against other safety projects and capital improvement projects are evaluated against other capital improvement projects. WSDOT is currently designing and testing a Collision Assessment Tool (CAT) that automates much of the life cycle cost-benefit calculations for safety projects. When fully implemented, CAT will help WSDOT safety engineers and transportation planners more easily (1) calculate the expected crash frequency on outlined segments of roadway and intersections and (2) evaluate the economic effectiveness in cost/benefit ratio format of countermeasures.
Although WSDOT uses tools and calculations to support decision making, no decisions are made based on tools alone. Expert judgment is still an important component of the transportation planning and project selection process. WSDOT involves senior leaders and executives to help guide project selection and review performance of the state's transportation system. WSDOT's Highway Safety Executive Committee (HSEC) and its Highway Safety Issue Group (HSIG) are heavily involved in the strategic level project selection process. HSEC is a six-member executive policy team representing the major WSDOT Divisions and offices. HSEC is responsible for identifying roadway safety risks; program policy and procedures; project ranking and prioritization methods; risk and crash reduction countermeasure policies; budget targets, operations and design considerations; research and data priorities; and safety program and performance assessments.4 HSEC approves and implements all departmental policies and procedures for planning, program development, project development, and operations of the WSDOT highway safety program in support of the governor's transportation safety policy and in accordance with the WSDOT strategic plan.
HSEC relies on WSDOT's Highway Safety Issue Group (HSIG) to provide technical expertise and recommendations on the development of policy, plans, and programs for roadway safety. HSIG members include safety experts and advocates that represent headquarters offices, the regions, and FHWA.5 Specifically, HSEC has directed the WSDOT's Capital Program Management Office to complete an analysis of network safety performance every two years as the initial step in building the next biennium's capital budget. New locations that emerge from this analysis are sent to region offices for in-depth analysis to determine if there is a cost- effective set of solutions that can be proposed for programming.
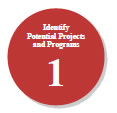
The relationship between the two safety groups and the overall project selection and review process is captured in Figure 2.6
Figure 2: WSDOT Highway Safety Decision Making Process
As illustrated in the figure, Washington State executives and engineers work together to provide guidance to regional offices in support of safety project selection. WSDOT's safety experts and engineers play an important role in identifying the locations and corridors on state roadways with the highest history of collisions and the greatest potential for improvement. Results of data analysis are incorporated in a strategic set of cost effective recommendations presented to HSEC. Recommendations are intended to address the engineering as well as enforcement and educational factors to reduce or prevent fatal and serious injury collisions. HSEC in turn uses these recommendations to develop policy direction and communicates guidance to regions. While not captured on the diagram shown in Figure 2, WSDOT discusses findings and recommendations with the public and solicits their feedback and support as part of the project selection process.
Although HSEC retains the ability to recommend un-programmed projects that were not included in the State Transportation Improvement Program (STIP), the group rarely exercises this option in practice. In lieu of an un-programmed project approach, WSDOT has instituted the creation of a minor capital safety category within the Traffic Operations budget to handle emerging safety situations with low cost interim solutions. If a larger scope of work is needed, WSDOT will consider it as part of developing the program for the next biennium. HSEC has also directed WSDOT's Capital Program Development and Management Office to recommend extra preliminary engineering efforts. This enables the department to more quickly identify new safety projects for implementation in the event that cost savings from other projects or additional funding comes available to fund those additional projects.
States and MPOs will almost always have a longer list of desired projects and strategies than money available to complete each of them. This necessitates a method of prioritizing activities to select those most important to complete in the short and longer term. The results of this prioritization are contained within the fiscally constrained STIP or TIP.
The Atlanta Regional Commission (ARC)7 has developed an approach to evaluating potential projects and placing projects into one of four tiers to allow for easy comparison. This is a notable practice that could be adopted by others. ARC follows a two-stage process for identifying
projects for inclusion in its RTP, contained within its long-range plan named PLAN 2040. Funding allocations are made for each of the program areas. ARC's project evaluation and prioritization process is then used to determine the priority of projects in line with available funding. During the first stage of the prioritization process, all potential projects are screened for alignment to the regional goals and visions. Projects might be discarded for reasons including not being on a regionally significant corridor; not addressing an immediate safety need; project type is not considered a priority under Georgia's Statewide Strategic Highway Safety Plan; project is already part of the Transportation Improvement Program (TIP); and significant engineering, environmental documentation, or acquisition is already underway.
Projects that pass the first stage of evaluation are then evaluated and scored based on performance measures and expected benefit-cost analysis. Performance measures are calculated to determine each project's impact in each one of five categories including:
Each project receives a score for each of the five categories. The maximum score that a project could receive in any category is 100, and scores for other projects are scaled between 0 and 90. Higher numbered scores are given to those projects expected to provide the greatest impact on congestion, safety, economic growth, or least impact on sensitive land use areas.
After assessing each project's projected performance, ARC monetizes impacts and externalities for each project and conducts benefit-cost calculations. Inputs to ARC's benefit-cost equation consist of the following:
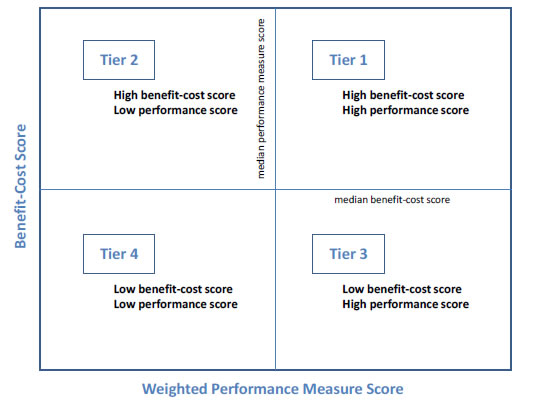
Figure 3: ARC's Plan 2040 Project Evaluation Tiers
Benefit calculations are weighted toward congestion and travel time improvements and do not include a safety component. ARC tracks trends in crashes and fatalities but does not set specific performance targets for safety metrics. ARC instead cAoppnesniddixeCr-s1s: Parfoejetcyt Eavsaluaaticoon mPropceodnureens t of project selection in the broad sense and the majority of programs funded by ARC include safety elements.
The second phase of ARC's project prioritization process involves placing projects into one of four tiers based on a combination of each project's performance measure score and the benefit- cost score. The four tiers are diagramed in Figure 3.8 Projects in Tier 1 scored above the median in both benefit-cost and performance evaluation while projects in Tier 4 scored below the median in both fields and are considered the least qualified projects. Projects in Tiers 2 and 3 scored mixed results – scoring above the median in one field and below in the other. In 2011, ARC funded all projects in Tier 1 and Tier 2. Remaining money was used to fund a few projects in Tier 3.
ARC is now conducting a data analysis effort that will culminate in customized profiles for member cities and counties. Each profile will provide information about crash rates by transit technologies as well as data findings and information related to the Georgia Department of Transportation emphasis areas. ARC intends to use these profiles to expand conversations with its local partners about ways to improve the evaluation and selection of safety projects. Over time, ARC envisions integrating CMFs and elements of the HSM into planning discussions with local members.
Safety planners have traditionally relied on a tool, or set of tools, supported by crash data to help them predict the impact of a particular safety improvement project or strategy. These tools were discussed at length in Section 1 of this report. The challenge for states and MPOs moving forward will be leveraging existing tools, given limited data sets, to begin predicting safety impacts across a suite of projects. That is, FHWA is encouraging organizations to take a more holistic approach to their planning processes and begin predicting outcomes at the programmatic level.
To effectively predict outcomes at the programmatic level, the outcomes for each individual project within the program must first be defined. One emerging method to accomplish this is conducting a detailed cost-effectiveness analysis for each potential project and then comparing the results to identify those with the largest pay-off in terms of lives saved and prevention of serious injuries. Elements of the analysis should include a score to quantify severity of each problem that a project would be designed to address, a score to quantify the effectiveness of an individual countermeasure given the parameters of the problem, and a cost score. Projects can then be grouped by these data points according to project type (the 4 Es). From there, they can be aggregated to form a broader understanding of how different combinations of projects may overlap or achieve additional improvements. It is important to note that simply adding up potential savings will not provide an accurate picture of the actual impact of a group of projects at the program level due to unintentional/unforeseen outcomes and overlaps. More research is needed to define a broadly accepted method for calculating the expected safety outcomes across multiple projects within a program portfolio.
As FHWA encourages states and MPOs to take a more holistic approach to safety planning and to begin predicting outcomes at the programmatic level, Missouri is a prime example of one state that has been successful in identifying and implementing system-wide improvements. Their Blueprint to Arrive Alive, which is the state's SHSP, identifies their "Targeted 10" strategies in education, enforcement, engineering, and public policy areas. These strategies were selected based on documented evidence supporting their lifesaving and injury reduction potential. Out of these 10 strategies, five are engineering countermeasures that are being implemented on a system-wide basis.
Missouri is improving safety by implementing proven countermeasures for roadways with particular characteristics to reduce the risk of future crashes. Rather than selecting a project for one location, they are selecting a countermeasure to apply at a more programmatic level across larger sections of roadway.
While additional research into this area is pursued, states and MPOs will have to be innovative with regards to their current processes for predicting programmatic safety outcomes. This may mean employing new tools, leveraging a combination of different tools, or sharing best practices through peer exchanges in addition to conducting advanced cost-effectiveness analyses. One example of progressive thinking is outlined in the National Cooperative Highway Research Program's NCHRP 17-46 report. This "Comprehensive Framework for Safety Investment Decisions" was designed to develop an analysis framework for all 4 E safety investment decisions transferable across federal, state, and local governments. This framework relies on multivariable cost-effectiveness analysis, considering both engineering and behavioral projects along a set of prioritization tiers.
Implementation is a set of actions that accomplish goals and/or objectives. While implementing the projects that have been selected as part of the safety improvement program may seem straightforward, it is important to remember that there are several steps that need to be completed during this stage of the process. Upon project approval, it is necessary to develop a detailed implementation plan that explicitly defines timelines, budget, and roles and responsibilities for accomplishing the stated outcomes. The implementation plan organizes, integrates, and documents the necessary activities that will be carried out to support completion of a project and/or program.
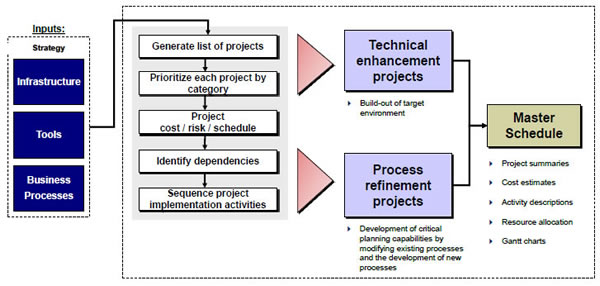
The implementation plan is the blueprint for communicating the activities that are required to affect the desired change. A common reference is essential for a group of individuals to work together toward a common result. Successful completion of activities requires communication about the what, when, where, and how. An organized approach requires formulation of a step-by- step process for delivering the desired outcome for a set amount of resources, plus contingencies. Figure 4 depicts an illustrative methodology to develop an implementation plan.
Figure 4: Methodology to Develop an Implementation Plan
The organization should track the goals, objectives, and performance measures developed in the pre-implementation planning process. These become the guidelines for organizing and managing the project. This is where collecting robust data pays off. The use of strong data helps improve the predicative capabilities of the tools, leading to the realization of more accurate safety outcome estimates. Each of the key planning decisions and performance measures should be linked to one or more activities and tracked until the project is complete. This serves as the means by which outcomes can be evaluated throughout the project/program lifecycle. During implementation, it is important to conduct performance data and evaluate your projects and program on an ongoing basis. This helps mitigate risks and improves efficacy of particular projects that are repeated across similar environments.
Ideally, each program and its supporting activities, has a set of performance targets and desired outcomes established as part of the earlier planning process. Once programs are underway, states and MPOs with strong performance management frameworks track progress toward achieving their goals and intended safety outcomes through the use of reporting tools such as performance dashboards.
Dashboarding is a common method used to inform internal or external stakeholders about progress to date and supports accountability. At a minimum, a dashboard should show performance targets and the current level of performance against that target. There are a variety of ways to display dashboard information, including charts and tables, up and down arrows, and red/green/yellow indicators of progress. Figure 5 provides an example of the North Carolina Department of Transportation (NCDOT) Executive Dashboard used to track progress against strategic goals. Each goal may be supported by one or more performance measures.
Figure 5: NCDOT Executive Dashboard
| Goal | # | Performance Measure | SFY11 Result |
SFY12 Target |
SFY YTD Result (as of 12/31/11) |
Trend |
|---|---|---|---|---|---|---|
| Make our transportation network safer | 1.1 | Statewide network crash rate | 2331 | 235 or less | 240 | |
| 1.2 | Statewide network fatality rate | 1.251 | 1.64 | 1.24 | ||
| 1.3 | Percentage of surveyed North Carolina drivers using a safety belt | 89.5%2 | 90.0% or greater | 1.24 | ||
| Make our transportation network move people and goods more efficiently. | 2.1 | Average statewide accident clearnace time | 66 min. | 70 min. or less | 63 min. | |
| 2.2 | Travel time index for surveyed interstates5 | 1.02 | 71.04. or less | 1025 | ||
| 2.3 | Percentage of planned ferry runs completed as scheduled | 98% | 95.0% or greater | 98.7% | ||
| 2.4 | Percentage of planned passenger trains arriving on schedule4 | New Measure |
80.0% or greater | 60% | ||
| 2.5 | Percentage increase in public transit ridership4 | New Measure |
5% or greater | 1.7%7 | N/A4 |
Reporting on key metrics aligned to goals enables organizational and program leaders to see trends over time, make decisions based on performance, and evaluate the impact of various performance drivers, and enables more control of the success of their actions. Simple, easy-to- access dashboards are helpful in creating openness between an organization and its constituents. Building acceptance of data driven decisions and linking performance to results is often easier to accept when an organization publicizes early success in achieving goals.

States and MPOs face increasing pressure to demonstrate that the outcomes of their roadway improvement programs meet or exceed citizen and legislative expectations. As a result, many states have instituted, or are in the process of
implementing, new project planning and safety prediction tools and practices that enhance traditional data collection, analysis, and reporting capabilities. These tools and practices support data-driven decision making within a performance management framework, something that is becoming increasingly important in today's transportation environment.
The two keys to achieving the desired future state of transportation safety planning lay within the establishment and acceptance of performance management frameworks across state DOTs and MPOs, and the identification and collection of robust data sets that are used as inputs to the various safety planning tools. Combined, these two elements will enhance the predictive capability of countermeasures, improving countermeasure selection and decision making throughout the planning process, which will ultimately reduce the number of serious injuries and fatalities on our nation's roadways.
An enhanced performance management framework is the cornerstone of the desired future safety planning environment. Performance management focuses an organization on achieving results critical to its mission, vision, and goals. By emphasizing the performance management framework as a method to guide decision making, state DOTs and MPOs can measure and refine their actions en route to accomplishing its strategic planning goals.
Within the roadway safety industry, performance management can be defined as the practice of translating specific goals and objectives into roadway safety investment programs and projects that result in fewer deaths and injuries on the nation's roadways. Working within a performance management framework helps ensure that funds are allocated to the most effective projects that support the organization's mission and yield desired benefits to the surrounding community. In the context of transportation planning, government organizations strive to balance benefits and costs across diverse strategic priorities such as environmental protection, economic development, and increased public safety and mobility.
Performance management also supports improved accountability. Use of performance measures provides managers with a tool to hold employees, project teams, or departments accountable for completing tasks on time, within budget, and meeting all expectations of quality. A regular review of performance also helps organizations proactively identify potential problems, which provides time to address problems before excessive amounts of time or money are dedicated to an unsuccessful venture. The establishment of effective performance management frameworks is in line with the MAP-21 requirements, ensuring resources are being allocated to the most effective safety related tools, processes, and practices.
By virtue of their role as public institutions, state DOTs and MPOs have an obligation to citizens and taxpayers to demonstrate good stewardship of resources and attempt to maximize the value of outputs. Use of performance-based planning and reporting performance on a regular basis enables state DOTs and MPOs to demonstrate performance to their stakeholders.
Crash modification factors (CMF) and safety performance functions (SPF) are used to estimate safety gains based on crash type, crash severity, and roadway type. CMFs are multiplicative factors that can be applied to crash data to predict the expected number of crashes after implementing a specific countermeasure at a specific site. SPFs are equations that relate site characteristics of a road segment or intersection (e.g., traffic volume, lane width, shoulder width) to the number of predicted crashes at that site. The Highway Safety Manual (HSM) provides a framework on ways that state DOTs and MPOs might use SPFs and CMFs to enhance safety as part of the transportation planning process. As state DOTs and MPOs incorporate the HSM in their project selection process, many are beginning to calculate state specific SPFs. Sharing effective CMFs based on similar SPFs between and across states and MPOs will continue to help foster an improved safety culture.
Normalizing data across states and MPOs is a major challenge facing transportation safety planners. Vehicle crash numbers and roadway fatality rates are commonly used measures of roadway safety. Using the fatality rate as a performance measure instead of a count of fatalities improves the ability to make comparisons across locations with differing travel patterns and driver populations. However, performance measures such as fatalities, injuries, and property damage are almost impossible to correlate to specific actions taken or projects implemented. Roadway fatalities, injuries, and property damage are impacted by a large number of factors including, but not limited to, roadway conditions, environmental or weather conditions, local law enforcement programs, and driver behavior.
In order to most effectively prioritize projects and programs while facing increased budgetary scrutiny, robust data sets must be made available to help inform decision making. Collecting metrics that do not strongly align to an organization's ability to exert direct control can reduce the efficacy of the metric to helping track performance. Some states have begun exploring options to implement additional performance measures that relate to roadway safety but may be more directly attributable to organizational capabilities. Others are considering adding new data fields to the crash reports completed at the scene to learn more about other contributing factors.
Organizations use data analysis during the planning phase to evaluate the need for projects and programs and during the performance management phase to evaluate the success of implemented projects and programs. It is important to note that data needs should be considered on an ongoing basis to ensure the organization is collecting and maintaining the right types of information. Information sharing contributes to the spread of practical tools and practices, enhances the usefulness of available data (e.g., a state sharing crash data with a locality), and offers opportunities to provide constructive critiques regarding practices in place.
Ultimately, performance metrics are often interrelated. Performance results in one target area may result in residual gains in other areas (e.g., reduced congestion's impact on improved safety outcomes). Proving causal links between specific projects and results is challenging in the transportation environment. It is difficult to find instances where transportation organizations have been able to specifically link individual projects to results as results may be impacted by many factors outside an organizations span of control. For example, changes in roadway fatality rates may be impacted by factors including engineering countermeasures, drivers' behavior, and/or economic conditions and demographic changes, among others. Although additional research on these relationships may be needed, states and MPOs can help advance performance-based planning more broadly by sharing new or revised performance measures, data collection techniques, and performance results.
Communication and collaboration are critical to developing and maintaining a safety culture in transportation organizations. Without communication and collaboration, dissemination of best practices is limited. Creating partnerships enhances acceptance, improves performance and diminishes the learning curve. Without partnerships, each individual organization must instead rely on internal innovation and investments to advance progress. Communication may exist in many forms including face-to-face interactions, peer exchanges, virtual meetings or teleconferences, or written forms. Commonly used methods of communication and collaboration to enhance organizational processes include cross-disciplinary or inter-organizational committee and board meetings, technical assistance documents or newsletters, and instructor-led or online training.
4WSDOT, Highway Safety Executive Committee (HSEC) Charter (Washington, January 2012).
5WSDOT, Highway Safety Issues Group (HSIG) Charter (Washington, September 2010).
6WSDOT, State Highway Decision Making Process (Washington, September 2009).
7ARC is the regional planning and intergovernmental coordination agency for 10-counties (Cherokee, Clayton, Cobb, DeKalb, Douglas, Fayette, Fulton, Gwinnett, Henry, and Rockdale) and the City of Atlanta.
8ARC Regional Commission Plan 2040, Regional Transportation Plan, Appendix C-1 Project Evaluation
Procedures

