U.S. Department of Transportation
Federal Highway Administration
1200 New Jersey Avenue, SE
Washington, DC 20590
202-366-4000
Publication Number: FHWA-SA-13-034
The Federal Highway Administration (FHWA) envisions a safety planning decision making environment where transportation organizations take a holistic programmatic approach and optimize the selection of roadway safety infrastructure improvements across a roadway system using performance management practices to track progress and achieve safety performance targets.
Measuring the impact of specific roadway safety countermeasures has historically been a challenge. This challenge is exponentially increased when attempting to measure the impact of a suite of countermeasures in a region or corridor. Expansion of predictive modeling and analysis actively supports the evaluation and updating of Strategic Highway Safety Plans (SHSP) that establish statewide goals, objectives, and key emphasis areas and integrates the four Es – engineering, education, enforcement, and emergency response. A number of nationally available safety analysis tools can be utilized to support roadway safety performance planning. The majority of these tools have been directly supported by FHWA, whether through research, funding, development, training, dissemination, or promotion. Although these tools serve different purposes, each provides transportation planners and engineers with data and information that can be used to enhance safety considerations during the transportation planning process.
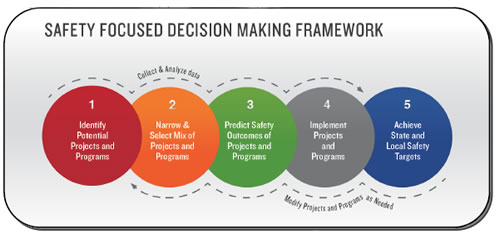
The Framework is defined by five high-level activities with continuous feedback loops for data collection and analysis and project modifications to enhance safety impacts. States and MPOs begin by identifying a list of potential projects, programs or strategies that will serve as the foundation of the larger safety program. Then, they refine that list through prioritization exercises designed to select the activities expected to affect the greatest safety impact using available funds within the given transportation environment. Following prioritization, the prediction of the safety outcomes helps provide the necessary justification for funding and implementation of the selected mix of projects, programs and behavioral strategies. Once approved and funded, states and MPOs will then work to implement the selected activities. Please note that this Framework is one component of parallel, related planning activities, and will have some overlap with the TSP, HSIP, and LRT processes.
"The cornerstone of MAP-21's Federal highway program transformation is the transition to a performance and outcome-based program, which will provide a means to more efficient investment of Federal transportation funds by focusing on national transportation goals, increasing the accountability and transparency of the Federal highway programs, and helping States and MPOs make targeted investments through performance-based planning and Programming."
Victor M. Mendez,
FHWA Administrator
FHWA is dedicated to promoting a performance-based management approach, as described in the Safety Focused Decision Making Framework above. This Framework helps translate measureable goals and objectives into highway safety investment strategies, priorities, and actions at the programmatic level. To ensure maximum effectiveness, this Framework relies on consistent monitoring, reporting, evaluation, and improvement to achieve the desired safety performance across the entire roadway system. It also supports the key tenets of MAP-21, described by FHWA Administrator Mendez in the box to the right.
A number of nationally available safety analysis tools exist to support roadway safety performance planning. In the context of this guide, tools include technical assistance materials, computer-based spreadsheets and models, or geographic information systems. The majority of these tools have been directly supported by FHWA, whether through research, funding, development, training, dissemination, or other activities.
The table below presents a listing of the tools used most frequently by states and MPOs as part of their safety planning process(es). The table also provides a synopsis of each tool's primary purpose and denotes where, within the Safety Focused Decision Making Framework, each tools is most useful. Although these tools serve different purposes, each provides data and information that can be used to enhance safety considerations during the transportation planning process. Please keep in mind that this table and the following case studies are not designed to promote the use of one tool over another.
| Tool | Primary Purpose | 1 Identify Potential Projects and Programs |
2 Narrow & Select Mix of Projects and Programs |
3 Predict Safety Outcomes of Projects and Programs |
4 Implement Projects and Programs |
5 Achieve State and Local Safety Targets |
|---|---|---|---|---|---|---|
| Crash Modification Factors (CMF) Clearinghouse |
This web-based repository that provides information on all documented CMFs and Crash Reduction Factors (CRFs) in a central location to help transportation professionals properly estimate the crash reduction of selected countermeasures when applied to projects. | |||||
| Geographic Information System (GIS) Tools software links safety event data such as crashes and geographic data such as roads and roadway features to allow for advanced spatial analysis and mapping. | ||||||
| Highway Safety Manual (HSM) |
The Highway Safety Manual (HSM) provides a framework for safety that aids practitioners in performing data analysis, selecting countermeasures, prioritizing projects, comparing alternatives, and quantifying and predicting the safety performance of roadway elements during the planning, design, construction, and operation phases of project development. | |||||
| Safety Analyst |
SafetyAnalyst is a set of computerized analytical tools to identify safety improvement needs and supports use of cost-effectiveness analysis to develop a system-wide program of site-specific improvement projects. | |||||
| Systemic Safety Project Selection Tool |
The Systemic Safety Project Selection Tool involves widely implemented improvements based on high-risk roadway features correlated with specific severe crash types. It helps agencies broaden their traffic safety efforts and consider risk as well as crash history when identifying where to make low-cost safety improvements. |
![]() Tool not typically applicable to step
Tool not typically applicable to step
![]() Tool somewhat applicable to step
Tool somewhat applicable to step
![]() Tool highly applicable to step
Tool highly applicable to step

Identifying the right projects and programs at the appropriate times is a necessary component to improving transportation safety. Safety project identification methods vary, but the application of commonly used practices generally depends on organizational capabilities and available resources, including staff with analytical skill sets and access to the necessary sources of data. A common challenge is leveraging the available data to formulate a mix of projects that lead to an effective safety program.
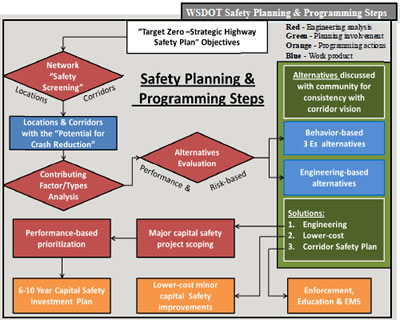
One notable practice is mandating performance measurement for all program activities. Data-driven decision making and continuous review of performance is deeply ingrained in Washington State's Department of Transportation (WSDOT). Their project selection process stems in large part from state policies and governance structure, and supports the organization's emphasis on using data to drive safety program decisions. All program and project selections must be aligned to the Governor's SHSP goal of zero fatalities and serious injury collisions by 2030. This goal is also referred to as Washington's Target Zero Program. One difference between Washington State and many other state DOTs is that the Washington State Legislature specifically directs WSDOT to develop methodologies for selecting state roadway investment projects to address deficiencies on the state roadway system. Based on this directive, WSDOT evaluates the full life cycle costs and benefits of all proposed projects in order to select projects that offer the greatest performance per dollar spent. Projects are evaluated within categories of funding so that potential safety projects are evaluated against other safety projects and capital improvement projects are evaluated against other capital improvement projects.
Four of the commonly used tools can be applied to this step in the process, including GIS, HSM, SafetyAnalyst, and the Systemic Safety Project Selection Tool. While each of these tools approaches this step in a unique way, they all work to provide safety professionals the ability to identify potential projects and programs using a formalized, data-driven, repeat-able process. For instance, GIS data can be used at the state and local level by leveraging the geo-coded information in the identification of hot-spot locations where safety improvement projects could have a large/immediate impact. Many States are currently developing GIS tools and programs. Some commonly reported challenges with GIS data include establishing data sharing standards within/between states and MPOs, consistent data formatting, data accuracy, and emphasizing GIS uses beyond its mapping capabilities. An example of a state that has been able to overcome some of these challenges is Utah with UPlan. UPlan is a web-based GIS decision-support mapping and informational tool. UPlan allows all stakeholders access to the same maps and data.

States and MPOs typically have a longer list of desired projects and strategies than money available to complete each of them. This necessitates a method of prioritizing projects/programs to select those with most benefit and greatest impact to complete in the short and longer term.
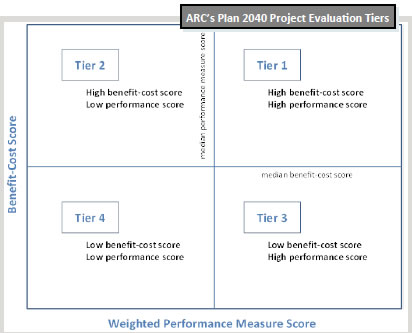
The Atlanta Regional Commission (ARC) evaluates potential projects and places projects into one of four tiers to allow for comparison. ARC follows a two-stage process for identifying projects for inclusion in its Regional Transportation Plan (RTP), contained within its long-range plan named PLAN 2040. Funding allocations are made for each of the program areas. ARC's project evaluation and prioritization process is then used to determine the priority of projects in line with available funding. During the first stage of prioritization, all potential projects are screened for alignment to the regional goals and visions. Projects might be discarded for reasons including not being on a regionally significant corridor; not addressing an immediate safety need; project type is not considered a priority under Georgia's Statewide Strategic Highway Safety Plan (SHSP); project is already part of the Transportation Improvement Program (TIP); and significant engineering, environmental documentation, or acquisition is already underway.
Projects that pass the first stage of evaluation are then evaluated and scored based on performance measures and expected benefit-cost analysis. Performance measures are calculated to determine each project's impact in each of the five categories including mobility, connections, safety, economic growth, and environment/community impact. Each project receives a score for each of the five categories. The maximum score that a project could receive in any category is 100. Higher numbered scores are given to those projects expected to provide the greatest impact on congestion, safety, economic growth, or least impact on sensitive land use areas. After assessing each project's projected performance, ARC monetizes impacts and externalities for each project and conducts benefit-cost calculations.
In line with this step, FHWA has recently released a new Systemic Safety Project Selection Tool. The Systemic Safety Project Selection Tool involves widely implemented improvements based on high-risk roadway features correlated with specific severe crash types. The Tool provides a comprehensive method for safety planning and implementation that supplements and compliments traditional site analysis. It is designed to help states and MPOs broaden their traffic safety efforts and consider risk as well as crash history when identifying where to make low-cost safety improvements (i.e., examining crash data to identify fatal/serious injury crash locations with similar roadway characteristics that can be treated proactively with effective, low cost countermeasure on a system-wide basis). Focused on enabling safety professionals to narrow and select projects, guidance includes a step-by-step process for conducting systemic safety planning, analytical techniques for determining a reasonable balance between the implementation of spot safety improvements and systemic safety improvements, and a mechanism for quantifying the benefits of safety improvements implemented through the Systemic Safety Project Selection Tool.

Safety professionals have traditionally relied on a tool, or set of tools, supported by crash data to help predict the impact of a particular safety improvement project or strategy. The challenge for states and MPOs moving forward will be leveraging existing tools, given limited data sets, to begin predicting safety impacts across a suite of projects.

FHWA encourages states and MPOs to take a holistic approach to safety planning and to begin predicting outcomes at the programmatic level. In order to effectively predict outcomes at the programmatic level, individual outcomes for each project within the program must first be defined. Missouri is an example of one state that has successfully identified and implemented such system-wide improvements. Their "Blueprint to Save More Lives," which is the state's SHSP, identifies their "Necessary Nine" strategies in the areas of education, enforcement, engineering, and public policy. These strategies were selected based on documented evidence supporting their lifesaving and injury reduction potential. Out of these nine strategies, five are engineering countermeasures that are being implemented on a system-wide (programmatic) basis. Missouri is improving safety by implementing proven countermeasures for roadways with particular characteristics to reduce the risk of future crashes. Rather than selecting a project for one location, they are selecting a countermeasure to apply at the programmatic level across larger sections of roadway.
The Crash Modification Factors (CMF) Clearinghouse provides transportation professionals with a web-based repository of CMFs and associated documents/training materials to support the proper application of CMFs. It highlights those factors that have considerable supporting research regarding their successful implementation and demonstrated effectiveness (or lack thereof). For this reason, it is a highly effective tool when it comes to predicting safety outcomes of projects and programs.
CMFs and safety performance functions (SPF) are used to estimate safety gains based on crash type, crash severity, and roadway type. CMFs are multiplicative factors that can be applied to crash data to predict the expected number of crashes after implementing a specific countermeasure at a specific site. SPFs are equations that relate site characteristics of a road segment or intersection (e.g., traffic volume, lane width, shoulder width) to the number of predicted crashes at that site. The Highway Safety Manual (HSM) provides a framework on ways that state DOTs and MPOs might use SPFs and CMFs to enhance safety as part of the transportation planning process. As state DOTs and MPOs incorporate the HSM in their project selection process, many are beginning to calculate state specific SPFs. Sharing effective CMFs and SPFs based on similarities between and across states and MPOs will continue to help foster an improved safety culture at the programmatic level.
The CMF Clearinghouse does, however, have it's limitations with regards to its predictive capability of a cadre of CMFs. This would be the case in the instance of attempting to predict the larger programmatic impact of several concurrently implemented countermeasures. In fact, the CMF Clearinghouse website explicitly states that there is limited research documenting the combined effects of multiple countermeasures and that, unless the CMFs act independently, multiplying may overestimate the effect of combining them.

There are several steps that need to be completed during the project implementation phase of the safety improvement process. Upon project approval, it is necessary determine how implementation will occur, including timelines, budget, performance measures, and roles and responsibilities for accomplishing the stated outcomes. This defined implementation approach organizes, integrates, and documents the necessary activities that will be carried out to support completion of a project and/or program, and is an essential element of transportation planning activities.
Effective implementation plans always includes discrete performance measures by which the overall impact of a project or program can be gauged. These become the guidelines for organizing and managing the project. Each of the key planning decisions and performance measures should be linked to one or more activities and tracked until the project is complete. This serves as the means by which outcomes can be evaluated throughout the project/program lifecycle. During implementation, it is important to collect performance data and evaluate projects and program on an ongoing basis. This helps mitigate risks and improves efficacy of particular projects that are repeated across similar environments.
When creating performance measures in transportation planning, FHWA's "A Primer on Safety Performance Measures for the Transportation Planning Process" can serve as a valuable resource. This document provides information about nationally available data sources, and guides users through the process of identifying, validating, refining, and incorporating performance measures into transportation planning. The Primer draws from current literature, professional experience, and notable state DOT and MPO practices. Key elements of the Primer include: a definition of performance measures; a step-by-step description and flowchart showing how safety performance measures can be identified and integrated into the transportation planning process; characteristics of effective performance measures; a checklist to assess an organization's current status with respect to the use of safety performance measures in the transportation planning and decision-making process; a list of references; and case studies of noteworthy practice. In addition to the Primer, use of a logic model can help states and MPOs identify performance measures that relate to strategic objectives and the broader program management scheme.
The Highway Safety Manual (HSM) provides a framework for safety that aids practitioners in selecting countermeasures, prioritizing projects, comparing alternatives, and quantifying and predicting the safety performance of roadway elements during the planning, design, construction, and operation phases. The HSM is interconnected with several other tools discussed in this guide, and can be used to identify which safety features, when implemented, will be the most impactful. Data outputs of the HSM that are developed throughout the safety planning process can be used to establish can be a source of credible safety performance measures.
As DOTs and MPOs incorporate the HSM in their project selection process, many are beginning to calculate state specific SPFs. For example, North Carolina Department of Transportation (NCDOT) partnered with the University of North Carolina Highway Safety Research Center to develop SPFs for different types of roadways in North Carolina. SPFs were estimated for nine crash types for 16 roadway types using statewide data from North Carolina. Researchers also created Excel files that NCDOT can use to calibrate the SPFs in the future as a means to support implementation of the HSM prediction methodology.

Ideally, each program and its supporting activities, has a set of performance targets and desired outcomes established as part of the earlier planning process. Once programs are underway, states and MPOs with strong performance management frameworks track progress toward achieving their goals and intended safety outcomes through the use of reporting tools such as performance dashboards.
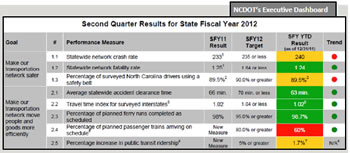
Dashboards are used to inform internal or external stakeholders about progress to date and support accountability. At a minimum, a dashboard should show performance targets and the current level of performance against that target. There are a variety of ways to display performance data including charts and tables, up and down arrows, and red/green/yellow indicators of progress. The figure above provides an example of the NCDOT's Executive Dashboard used to track progress against strategic goals. Reporting on key metrics aligned to goals enables leaders to see trends over time, make decisions based on performance, evaluate the impact of various performance drivers, and control the success of their actions. Simple, easy-to-access dashboards create openness between an organization and its constituents. Building acceptance of data driven decisions and linking performance to results is often easier to accept when an organization publicizes early success in achieving goals.
Analyzing the impact of a safety project or program is not always as easy as it may seem. To do this effectively, safety professionals rely on some of the analysis tools described in this guide. In the world of transportation analysis tools, SafetyAnalyst offers advanced analysis capabilities and can be used by highway agencies to improve their programming of site-specific highway safety improvements. More specifically, SafetyAnalyst provides a set of software tools used by state and local highway agencies for the highway safety management process documented in Part B of the AASHTO's Highway Safety Manual. It applies the Empirical Bayes (EB)1 approach and can be used by highway agencies to improve their programming of site-specific highway safety improvements.
Ohio's Department of Transportation (ODOT) is perhaps the most advanced of all states in its use of SafetyAnalyst. ODOT has incorporated the tool into the state's regular transportation planning processes and uses its Network Screening Tool to analyze high priority locations with the greatest potential for safety improvement.
To date, SafetyAnalyst has not been fully implemented by any state. A number of other states are in the early stages of adopting or modifying the tool to suit their needs, including Florida, Missouri, and Washington. Some states have reported the data requirements, including the data formatting requirements, difficult to comply with, which has limited their use of the tool.
1More information on the EB approach can be found at http://www.safetyanalyst.org/screening.htm

