U.S. Department of Transportation
Federal Highway Administration
1200 New Jersey Avenue, SE
Washington, DC 20590
202-366-4000
NOTEWORTHY PRACTICE
FHWA-SA-19-012
Best for printing: [PDF, 566 MB]
To view PDF files, you can use the Acrobat® Reader®.
A major focus of the New Jersey Department of Transportation's (NJDOT) data driven interactive tool 'Safety Voyager' is to provide a quick and visual perspective of crash data in New Jersey.
NJDOT's Bureau of Transportation Data and Safety (BTDS) collects all New Jersey Police Crash Investigation Report forms (NJTR-1) statewide from State and local law enforcement agencies. BTDS receives an average of 320,000 crash reports per year to process, scan, verify, and store in a database. With an abundance of available data, State and local government agencies need a quick and easy visual perspective tool for their data-driven crash analysis and safety programs.
NJDOT has developed several data-driven safety programs to identify locations in need of improvements based on crash data from NJTR-1 reports. Beyond safety programs established by NJDOT, the data captured in NJTR-1 reports are used for the development of grant applications, resource allocation, and statistical analysis. Over 20 agencies, including the Division of Highway Traffic Safety, Motor Vehicles Commission research institutes, and State and local police use the data.
In 2016, NJDOT developed and deployed the first phase of a new user-friendly crash data analysis tool called Safety Voyager.1 Safety Voyager is a web-based application that allows NJDOT to visualize crash data, traffic count data, and exploratory data analysis in a map-based interface.
A web-based cloud platform hosts this application. By providing both two- and three-dimensional graphical displays, Safety Voyager can quickly show a comparative view of crashes within a defined area, municipality, or county as determined by users. In addition, various filters are available to fulfill detailed user-defined queries.
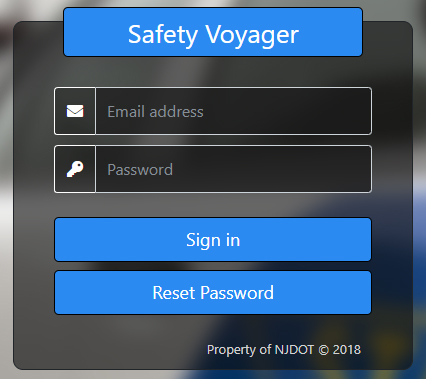
Safety Voyager Login Page.
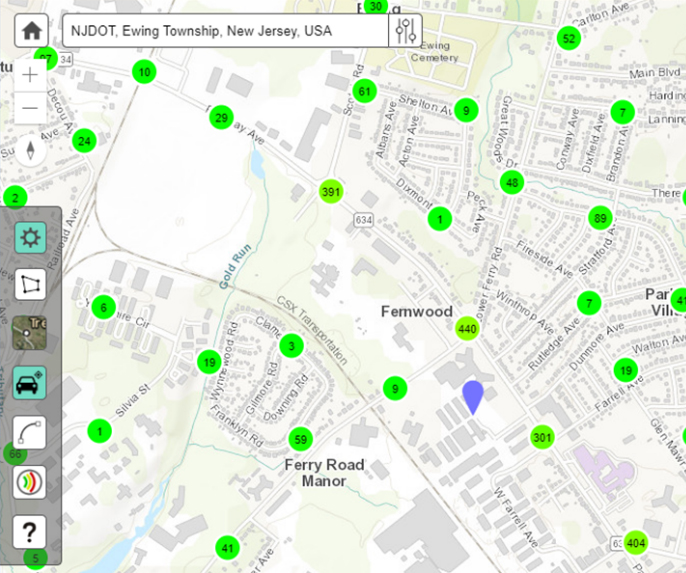
Safety Voyager Interface.
Features of Safety Voyager include:
The Crash Cluster Selection Tool isolates the selected crashes in the Detailed Crash Information window and highlights the crashes on the map that are linked to an NJTR-1 report.

Crash Cluster Selection Tool and Crash Reports.
Users can access NJTR-1 crash reports directly from the Crash Map application. This tool redacts personal identifying information to protect an individual's privacy. Currently, over 200,000 NJTR-1 reports are linked to crash data, mostly from recent crash events (2017 and 2018). Available redacted reports show up as a link in the Detailed Crash Information window where available. Users can download these reports as a PDF with just one click.
The latest updates for Safety Voyager focus on pedestrian- and bicycle-related crashes. The tool contains dashboard and heat maps for visualization and a better understanding of the problem.
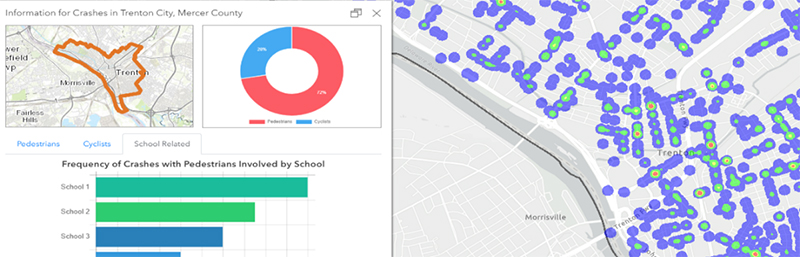
Dashboard and Heat Maps.
Safety Voyager can assist with safety planning. For example, it is an integral part of all safety programs and planning efforts at the North Jersey Transportation Planning Authority (NJTPA). Crash data is analyzed at the municipal and county levels by NJTPA staff as part of safety planning. Crash trends at the municipal level are used to select locations for the Street-Smart Campaign. Road Safety Audits, which are led by the NJDOT in collaboration with the NJTPA, begin with the analysis of crash data using Safety Voyager. It is also used to: analyze crashes at intersections and corridors as the basis for eligible locations for Highway Safety Improvement Program (HSIP) funding through NJTPA's Local Safety and High-Risk Rural Roads Programs; complete Highway Safety Manual and Benefit Cost analyses which is a prerequisite of HSIP funding, and; to complete three-year post construction performance evaluations of projects that have been constructed with HSIP funds, as part of NJDOT's Annual Safety Report.
The NJDOT routinely updates Safety Voyager as new crash information becomes available. The software improvements and enhancements are being done on a regular basis and this process incorporates new features based on the feedback received from the users. Newer tutorial blogs (for example, crash map tutorial, emphasis areas tutorial) are also uploaded on regular basis to improve usability.
Chris Zajac, PMP, Section Chief, Bureau of Transportation Data & Support, Division of Multimodal Services, New Jersey Department of Transportation, chris.zajac@dot.nj.gov, 609-963-1893.
1 New Jersey Department of Transportation. Safety Voyager. https://www.state.nj.us/transportation/refdata/accident/crashdatasearch.shtm.

