U.S. Department of Transportation
Federal Highway Administration
1200 New Jersey Avenue, SE
Washington, DC 20590
202-366-4000
| < Previous | Table of Contents | Next > |
Unit 1 of the Highway Safety Improvement Program (HSIP) Manual lays the foundation for understanding road safety and HSIP. The unit explores the costs of motor vehicle crashes to our society and provides the building blocks for understanding road safety as a discipline. The background, history, purpose, and contents of the Highway Safety Improvement Program are described. The unit also introduces the HSIP legislative requirements and guidance documents, the HSIP’s relationship to other safety plans, and the relationship between the HSIP and the project development process within a department of transportation (DOT), including transportation planning, design, construction, maintenance, and operations.
The purpose of the HSIP Manual is to provide an overview of the HSIP and present state and local agencies with tools and resources to implement the HSIP. The manual provides information related to planning, implementation, and evaluation of state and local HSIPs and projects.
The manual’s first unit provides a foundation for understanding the HSIP. Basic concepts in road safety; the history of the HSIP and current legislation and guidelines; addressing road safety within all phases of the project development process; setting safety goals, objectives, and performance measures; and identifying available resources and technologies that support the HSIP process, provide the context to study the various components of the HSIP detailed in the remainder of the manual.
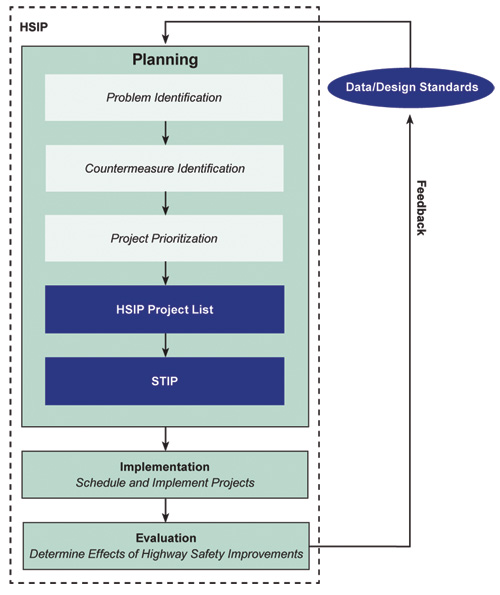
Figure 1.1 illustrates the various components of the HSIP process: planning, implementation and evaluation. The planning component consists of processes for problem identification, countermeasure identification, and project prioritization. Once projects are identified and funding secured, HSIP projects are designed and constructed as part of the implementation component. Finally, HSIP projects and programs are evaluated to determine the effectiveness of highway safety improvements.
While the HSIP is a Federally funded, state-administered program, the HSIP components shown in Figure 1.1 are applicable to road safety management processes at all levels of government.
Figure 1.1 Highway Safety Improvement Program Components
The remaining sections of the HSIP Manual address these components, as follows:
Unit 2: Problem Identification – Examines the processes for collecting and managing crash and other data needed for identifying highway safety problems.
Unit 3: Countermeasure Identification – Describes how to identify the factors or variables which contribute to crashes, and countermeasures for preventing those crashes and mitigating crash severity.
Unit 4: Project Prioritization – Addresses the application of project prioritization processes to identified locations with safety improvement potential. It also demonstrates how to calculate the benefit/cost ratio for projects using Crash Modification Factors (CMF) and other information.
Unit 5: Implementation – Addresses funding sources, allocation issues and solutions states have implemented to address funding challenges. Project programming and the development of evaluation plans is also discussed.
Unit 6: Evaluation – Provides information for conducting project evaluations and developing CMFs. It addresses program evaluation and the importance of inputting evaluation results back into the HSIP and Strategic Highway Safety Plan (SHSP) planning processes to aid future decision-making.
The following section defines road safety and discusses the use of actual numbers versus rates to measure road safety. These basic concepts of road safety provide a foundation for the overall Highway Safety Improvement Program.
Although the United States and other industrialized nations have made substantial progress over the past 30 years, the United States has experienced more than 40,000 motor vehicle-related deaths, and more than two million injuries annually between 1993 and 2006. These deaths are the leading cause of unintentional injury deaths in the United States for ages 1 year through 34 years (CDC WISQARS web site). Motor vehicle crashes place millions of people at risk for death or injury, disproportionately strike the young, and are the leading cause of lost years of productive life.
In addition to the resulting injuries and lives lost, crashes also result in significant economic consequences. In 2000, the National Highway Traffic Safety Administration (NHTSA) estimated traffic crashes in the United States accounted for over $230 billion in economic losses (Blincoe et al., 2002).
Two intertwined issues that transportation officials must deal with are safety and congestion. For example, a heavily congested highway may present little risk of high-speed crashes; however, to avoid congestion drivers often seek alternative routes, such as local roads which present much higher risks to drivers. Likewise, poor incident management can often cause unnecessary delay and congestion on our roads. The 2008 AAA study, Crashes versus Congestion: What’s the Cost to Society? sheds light on the relationship between congestion and safety by examining the relative economic impact. It begins with the Urban Mobility Report published each year by the Texas Transportation Institute (TTI).
The authors for AAA calculated the cost of crashes for the same urban areas included in the TTI report. The AAA study findings suggest congestion costs are not nearly as great as the costs and consequences of motor vehicle crashes.
Figure 1.2 shows in the urban areas studied the cost of fatal and injury traffic crashes is more than two and one-half times the cost of congestion – $164.2 billion for traffic crashes and $67.6 billion for congestion. The study concludes that improving safety may also improve congestion because, while it varies from community to community, 40 to 50 percent of all nonrecurring congestion may be associated with traffic incidents.
Figure 1.2 Per Person Cost of Crashes versus Congestion
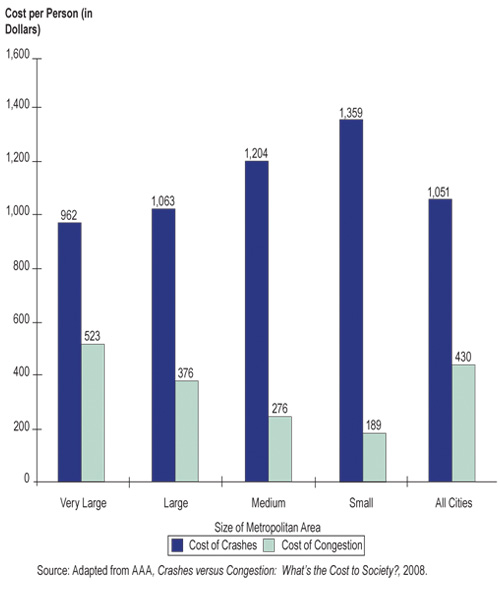
Both congestion and safety pose a substantial cost to the public, with safety estimated as over two and half times more than the cost associated with congestion. Designers and planners need to recognize these costs and define solutions that do not inadvertently adversely impact the other.
Road safety is typically defined in terms of the injuries and fatalities that occur on the roadway system. Therefore, definitions of road safety are often based on crash outcomes such as “…the number of accidents (crashes) (Many safety professionals and some in the media believe we should consistently use the term “crash” which implies these events are preventable as opposed to “accident” which implies the incidents are unintentional.), or accident consequences, by kind and severity, expected to occur on the entity during a specific period” (Hauer, 1997).
The science of safety has evolved over the past several years and is focusing more on data and analysis, rather than solely adhering to standards. For example, it was commonly assumed when road safety improvements met the standards contained in the Manual of Uniform Traffic Control Devices (MUTCD) and the American Association of State Highway Transportation Officials (AASHTO) – A Policy on Geometric Design of Highway and Streets (also known as the “Green Book”) they were considered safe. However, most of those standards have not been evaluated specifically for their impact on safety. Crashes may occur on a roadway designed to meet standards, and this does not necessarily mean the roadway is unsafe.
Science-based road safety management is referred to as data-driven or evidence-based. This approach to road safety emphasizes estimates of the effect on safety (data and analysis), rather than adherence to standards based on personal experience, beliefs, and intuition. The safety metrics (e.g., fatalities and serious injuries) of a roadway are compared to roadways with similar characteristics to evaluate its safety performance. The goal of the evidence-based approach is to understand and quantify the expected consequences and outcomes of our actions (e.g., changes in the expected number of crashes/injuries/fatalities); the resulting calculations become the experience or evidence on which future decisions are made.
Road safety is usually measured in terms of fatalities and injuries involving motor vehicles and roadway users (i.e., pedestrians and bicycles) on the road system. Outcome measures should be used whenever possible to quantify safety. Some competing metrics for measuring safety, as well as the pros and cons of each are outlined below:
Number of Near-Misses (Although these incidents are near-collisions, the incidents are commonly referred to as “near-misses.”) –
Near-misses are conflicts which occur between road users but do not result in a crash. The frequency of near-misses is sometimes used as a rough proxy for safety. The advantage of this metric is it allows for analysis of a large number of events, since near-misses are much more frequent than crashes. On the other hand, collecting near-miss data is labor-intensive, and usually is collected only at select locations. Moreover, near-misses do not reflect fatality and injury outcomes.Evidence of Unreported Crashes – Many fixed object collisions with property damage only are not reported to the police. These crashes can be identified by physical evidence at the site (e.g., car parts in grass near curves, utility poles, trees, or median barriers; damaged sign posts, mailboxes, or fences) and through maintenance records. Repeat evidence of unreported crashes could be used to identify existing safety problems and sites for potential safety enhancement. Similar to near-misses, observation of vehicle debris associated with unreported crashes does not reflect fatality and injury outcomes.
Safety Belts Use – This measure includes the percent of motor vehicle drivers and passengers wearing safety belts in general, by time of day, and/or for those involved in crashes. Safety belt use is highly correlated with the likelihood of surviving a crash, and is a general indicator of one important dimension of safety. However, it does not capture many other influences on safety such as engineering countermeasures, vehicle safety improvements, and so forth.
Number of Driving Under the Influence (DUI) Arrests – Because impaired driving is a factor in many fatal crashes, the number of DUI arrests is sometimes used as an early indicator of safety, since a greater number of DUI arrests should result in fewer traffic crashes. However, this is an output measure and used primarily to track level of effort rather than safety outcomes.
Safety can be measured over time by tracking the raw number of fatalities, injuries, or crashes. It can also be measured by calculating injury, fatality, or crash rates, (e.g., fatalities per million miles of travel, per 100,000 population, per number of licensed drivers, etc.), which are normalized for exposure to crash risk. For example, crash rates can control for general increases in incidents at locations where people drive more often and travel more miles.
Important tradeoffs exist when selecting whether to use rates or numbers. Numbers have the advantage of conveying the magnitude of the crash problem, and the fact that every fatality or injury is important. Numbers also are better understood by the public.
Crash rates are better for identifying crash risk, but can be misleading. The assumption behind crash rates is that the number of collisions at a site is directly proportional to the amount of exposure. In other words, as vehicle, pedestrian, or bicycle volumes increase, the number of collisions increases proportionally. However, research has consistently shown the relationship between collisions and volumes to be nonlinear. As vehicle, pedestrian, or bicycle volumes increase, the number of crashes may increase, but in a nonlinear fashion.
Safety Performance Functions (SPFs) can be used to better portray the expected safety of a site. SPFs estimate the average crash frequency for a specific site type as a function of annual average daily traffic (AADT). SPFs are described in more detail in Unit 2.
An understanding of road safety builds the foundation for the HSIP. The background and history of the HSIP are summarized in the following section.
While safety has long been a consideration in transportation project development, the role and significance of safety in transportation policy has evolved over time. One of the first major efforts at the Federal level to reduce the number and severity of highway-related crashes was the 1966 Highway Safety Act (23 U.S. Code (U.S.C.) 402). Passed by Congress on September 9, 1966, the Act required states to develop and maintain a highway safety program in accordance with uniform standards established by the Secretary of Transportation. The primary purpose of this legislation was to provide for a coordinated national highway safety program through financial assistance to the states to accelerate highway traffic safety programs. The Act established 18 standards with responsibility for implementing these standards divided between the FHWA and the NHTSA. These standards were later replaced by priority program areas in the 1973 Act.
The Highway Safety Act of 1973 (Title II of Public Law No. 93‑87) established categorical funding for the following five safety improvement program areas:
These five programs were eventually consolidated by the Surface Transportation Assistance Act of 1978 (Public Law No. 95‑599) into the Railway-Highway Grade Crossing and Hazard Elimination Programs.
The Railway-Highway Grade Crossing Program was intended to reduce the number and severity of train collisions with vehicles and pedestrians at public highway-rail grade crossings and established Federal funding for projects aimed at improving rail-highway crossing safety. Typical projects eligible for this program include (but are not limited to):
The Hazard Elimination Program was intended to reduce the number and severity of fatalities and serious injuries resulting from crashes on all public roads and provide funding for projects to mitigate or eliminate hazardous sections, locations, or elements on any public road. Typical projects include, but are not limited to:
The evolution of highway safety continued with passage of the Intermodal Surface Transportation Efficiency Act (ISTEA) of 1991. ISTEA required states to develop and implement a series of management systems, including a safety management system (SMS). SMS was envisioned to be a systematic process designed to assist a broad-based coalition of safety stakeholders in selecting effective strategies to improve the efficiency and safety of the transportation system. A comprehensive crash database was to serve as the basis for these decisions, and safety performance measures were to be defined and used to monitor safety progress over time. SMS resulted in the improvement of crash databases in many states. Only a few states maintained or expanded their collaborative interagency efforts when the requirement was made optional in 1995.
In 1998, the Transportation Equity Act for the 21st Century (TEA‑21) provided more focus by including “safety and security” as a transportation planning priority. Prior to TEA‑21, safety may have been incorporated into the vision or goals of a state or metropolitan transportation planning organization (MPO) long-range transportation plan, but specific strategies to increase safety were seldom included in statewide and metropolitan planning processes or documents. More than two dozen states participated in safety conscious planning forums which, in most cases, started a dialogue between transportation planners and safety stakeholders.
TEA‑21 also provided guidance on a wide range of planning, policy and safety issues affecting bicycling and walking. Bicyclists and pedestrians were to be given due consideration in state and MPO long-range transportation plans. Bicycle and pedestrian projects were to be considered, where appropriate, in conjunction with all new construction and reconstruction of transportation facilities (except where bicycle and pedestrian use is not permitted). Additionally, transportation plans and projects were to provide consideration for safety and contiguous routes for bicyclists and pedestrians.
In 2005, the Safe, Accountable, Flexible, Efficient Transportation Equity Act – A Legacy for Users (SAFETEA‑LU) established the HSIP as a core Federal-aid program under 23 U.S.C. 148. SAFETEA-LU nearly doubled the funds for infrastructure safety, allowed increased flexibility in program funding, and required a focus on results. In addition, SAFETEA‑LU elevated the highway safety program even further by separating safety and security into individual planning factors.
The specific purpose of the HSIP is to achieve a significant reduction in traffic fatalities and serious injuries on public roads. This is to be accomplished through the development and implementation of Strategic Highway Safety Plans (SHSP). SHSPs are intended to drive states’ HSIP investment decisions. In addition to the Railway-Highway Grade Crossing Program (23 U.S.C. 130), SAFETEA‑LU also established the High-Risk Rural Roads Program (HRRRP). Figure 1.3 diagrams the relationship among the various HSIP programs as presented in the Code of Federal Regulations, Title 23, Part 924 (23 CFR 924).
Figure 1.3 Relationships of HSIP Programs
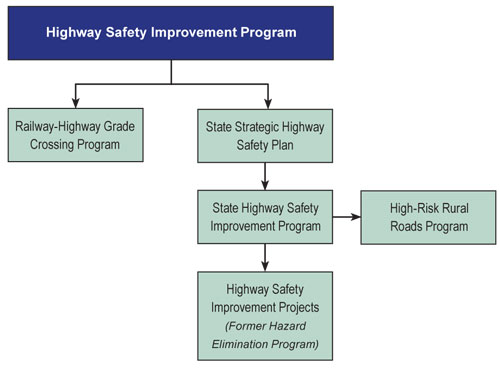
Details on each of the programs, the relationship among them, and the new reporting requirements established under SAFETEA‑LU are provided below.
The state HSIP should be consistent with the SHSP emphasis areas and strategies. Requirements for an HSIP are defined in 23 CFR 924. While states may develop their HSIPs to best serve their needs, it must include the following components:
The remainder of the HSIP Manual addresses the various processes associated with HSIP planning, implementation and evaluation efforts.
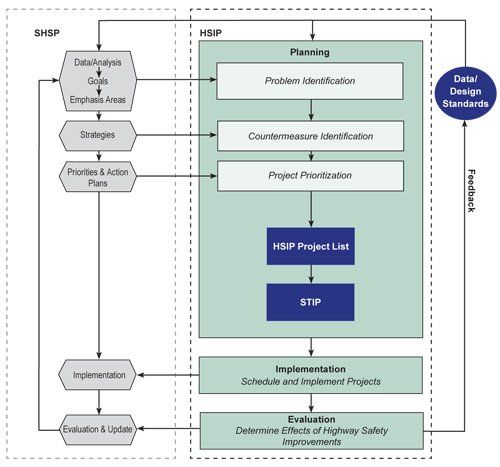
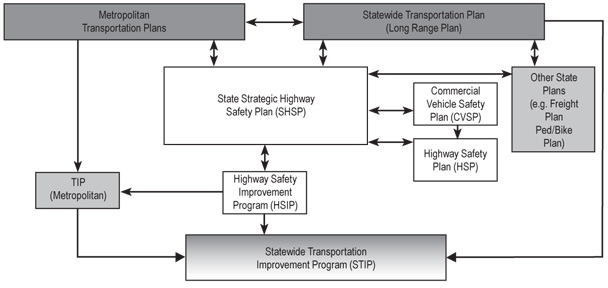
Figure 1.4 illustrates the relationship between the HSIP and the SHSP.
The SHSP influences decisions made during each step of the state HSIP process. SHSP emphasis areas influence problem identification in the HSIP. The SHSP action plans, which detail the strategies the state will implement to address its motor vehicle-related fatalities and injuries, link directly to the HSIP countermeasure identification process. Projects prioritized during HSIP planning align with the SHSP priorities and action plans. Many of the infrastructure-related elements of the SHSP can be implemented via the state’s HSIP. Evaluation of highway safety improvement projects informs tracking and updating of the SHSP. The results of HSIP evaluations feed back into both the SHSP and the HSIP planning processes.
1.4 Relationships between the SHSP and HSIP
The High-Risk Rural Roads Program (HRRRP) provides set aside funds for construction and operational improvements on high-risk rural roads. High risk rural roads are defined as roadways with crash rates for fatalities and incapacitating injuries exceeding the statewide average on rural major or minor collectors, or rural local roads, or roadways likely to have increases in traffic volume which are likely to create a crash rate above the statewide average for the respective roadway functional classes. Implementation of the HRRRP requires comprehensive crash data for all public roads.
SAFETEA‑LU continued the Railway-Highway Grade Crossing Program (RHGCP) essentially intact, with the primary changes involving program funding. The program reduces the number of fatalities and injuries at public railway-highway grade crossings through the elimination of hazards and/or the installation/upgrade of protective devices at crossings. Each state is required to conduct and systematically maintain a survey of all highways to identify those railroad crossings which may require separation, relocation, or protective devices, and establish and implement a schedule of projects for this purpose. At a minimum, this schedule is to provide standard signing for all railway-highway crossings.
Reporting guidance for the HSIP, RHGCP and the 5% reports are provided on the FHWA Office of Safety web site. Direct links to the guidance documents can be found in the References appendix.
In addition to the funding in 23 U.S.C. 148, SAFETEA‑LU increased funds for highway safety grants (23 U.S.C. 402) and several other behavior-oriented grant programs through the NHTSA; established new programs, including traffic records systems improvements (23 U.S.C. 408) and Safe Routes to School; and continued to emphasize truck and transit safety through the Federal Motor Carrier Safety Administration (FMCSA) and the Federal Transit Administration (FTA), respectively.
States and local agencies are working to coordinate the various transportation and safety planning documents to ensure a systematic (collaborative) approach to addressing highway safety. Achieving this goal requires a fundamental change in the transportation culture which entails reaching out to other safety planning entities and working with all phases of the transportation project development process, including planning, design, construction, operations, and maintenance. While this manual is focused on the HSIP, there are many ways to incorporate safety into an agency’s overall project development processes.
In a January 7, 2005 memorandum, the FHWA Associate Administrator for Safety said reaching the national safety goal requires safety consideration:
“… in every aspect of our business, from planning and programming, environmental analysis, project design, construction, to maintenance and operations. We must use data-driven decision-making and assure that safety is a key input in any decision made in the project development process.”
Figure 1.5 Coordinated Transportation Safety Planning
Aligning safety plans provides a more unified process which can reduce administrative burden, ensure common data and analysis methods, and align scarce resources to more effectively produce safety improvements.
In addition to considering safety in identifying strategies and projects, safety should be considered in the preliminary design phase of all highway improvement projects as project options are being evaluated and environmental analysis is underway. Table 1.1 identifies potential safety tasks in the preliminary design process.
Table 1.1 Potential Safety Tasks in the Preliminary Design Process
Step |
Potential Safety-Related Task |
|---|---|
Preliminary Design Conference |
Document safety needs and identify atypical conditions, complex elements, and high-cost components. |
Data Collection/Preliminary Design Preparation |
Diagnose safety data to identify crash patterns and refine project scope, if necessary. |
Preliminary Schematic |
Perform preliminary level of safety analysis for “key” design elements. |
Geometric Schematic |
Perform detailed level of safety analysis for “key” design elements. |
Value Engineering |
Compare cost of specific elements and overall roadway with safety and operational benefits. |
Geometric Schematic Approval |
Document safety of design choices (use results for design exception request, if necessary). |
Source: Adapted from Bonneson et.al, 2005.
“Key” design elements are those associated with the 13 controlling criteria which dictate the need for a design exception or have a known impact on safety. The 13 controlling criteria include: design speed, lane width, shoulder width, horizontal alignment, vertical alignment, grades, stopping sight distance, cross slope, superelevation, and horizontal clearance; and for bridges: lane and shoulder width, structural capacity, and vertical clearance.
The following recommendations are applicable to the design phase:
For example, a state proposes a design exception for a horizontal curve because of excessive right-of-way costs. The safety solutions considered for the design exception include strategies to mitigate potential safety effects (e.g., raised pavement markers, high-performance pavement markings, paved shoulders, milled rumble strips, flattened fore slopes, larger and brighter warning signs and chevrons, and remediation of fixed objects) and/or adding high type skid resistance pavement overlay.
In addition, the Interactive Highway Safety Design Model (IHSDM) is a suite of software analysis tools for evaluating safety and operational effects of geometric design decisions on highways. IHSDM evaluates existing and proposed alternative highway geometric designs and provides quantitative information on their expected safety and operational performance. Decision-makers can use the IHSDM quantitative information to help make, justify, and defend geometric design decisions throughout the highway design process.
Safety should be a key factor in any decision made during construction and maintenance. Agencies can use the following strategies to incorporate safety into the construction and maintenance phases:
One state DOT incorporates safety projects into its daily business through a policy to include low-cost safety improvements into all resurfacing projects using other highway funds.
Agencies are increasingly finding ways to incorporate safety into their traffic operations. To include safety in traffic operations an agency can:
In some states, various state and local representatives collaborate regularly to keeps safety in focus as other activities progress. Networking opportunities raise visibility and awareness of safety issues, educate state and local employees about safety issues and programs, and provide reinforcement as to how their jobs are related to safety.
HSIP program managers and state safety engineers each play a critical role and must work together to integrate safety into the project development process. Transportation professionals may not be familiar with safety data location and availability; safety data analysis and forecasting techniques; organizational and collaboration structures; or safety stakeholders and networks. Safety engineers should communicate with transportation professionals to ensure they are aware of the expertise and experience available to them both within and outside their own agencies.
Safety goals, objectives, and performance measures provide details on desired outcomes and measures of performance for HSIPs. Goals and objectives should be clear, concise, and quantifiable.
A goal is a general statement of a desired state or ideal function of a transportation system. Strategic Highway Safety Plans identify state transportation safety goals and provide a comprehensive framework for reducing highway fatalities and serious injuries on all public roads. The goals are generally based on number, proportion, or rate of crashes, fatalities, and/or serious injuries.
Examples of state safety goals include the following:
An objective is a concrete step toward achieving a goal, stated in measurable terms. Objectives may have specific performance targets which set out in clear, numerical terms a desired or required degree of achievement. Examples of objectives include:
Performance measures communicate the priorities, results, and value to society of various transportation safety programs and activities. Clearly defining goals and objectives is critical for identifying the different types of performance measures to incorporate into the planning process.
Performance measures are used for several different purposes. They are used to connect goals to actions, allocate resources, and to monitor and evaluate progress. Most importantly, performance measures determine the effectiveness of safety policies and countermeasures and how changes in the system may affect performance.
Output performance measures identify the progress in utilizing resources, such as the total number of projects, total funding, and related output measures (e.g., the number of traffic signals installed, the number of intersections with improved pavement markings, etc.). Outcome performance measures are focused on the intended results of the program. General statistics (e.g., the number of crashes and crash rates), trend analysis, and benefit/cost analysis are used to measure performance outcomes.
Safety performance measures should be:
When incorporating safety into system performance measures, a number of issues should be considered. Performance measures must be sensitive enough to assess changes in safety performance after strategies are implemented. Agencies also should be capable of collecting or accessing timely and accurate data relevant to the performance measures. Finally, the safety performance measures should be linked to evaluation criteria for assessing the relative benefits of one project or strategy over another.
Following are examples of performance measures used for various safety improvements:
The following example demonstrates how goals, objectives, and performance measures are used. A state selects a goal to reduce the number of motor vehicle fatalities by 20 percent by 2015. To reach this goal, one objective the state will aggressively pursue is to reduce fatal rural intersection crashes by 15 percent by 2012. As a result, the state designs a five-year program to increase visibility of roadway signs, signals, and markings. To assess progress and evaluate success of the rural intersection program the performance measures will include:
As technology and safety research continue to advance, so will the available resources to support HSIP implementation. This section identifies the tools available to support the HSIP process.
The Highway Safety Manual (HSM) provides practitioners with the best factual information and tools to facilitate roadway design and operational decisions based on explicit consideration of the safety consequences. The HSM serves as a resource for information related to the fundamentals of road safety, road safety management processes, predictive methods, and CMFs. The road safety management process outlined in the HSM aligns very closely with the HSIP process. Related to the HSIP, the HSM guides safety practitioners in several applications, including: identifying sites with potential for safety improvement, identification of contributing factors and potential countermeasures; economic appraisals and prioritization of projects; and evaluation of implemented improvements.
SafetyAnalyst provides a set of software tools used by state and local highway agencies for highway safety management. SafetyAnalyst incorporates state-of-the-art safety management approaches into computerized analytical tools for guiding the decision-making process to identify safety improvement needs and develop a systemwide program of site-specific improvement projects. SafetyAnalyst includes modules for identifying locations for potential safety improvement, diagnosis and countermeasure selection, economic appraisal and priority ranking, and evaluation of implemented improvements.
Unit 1 serves as a foundation for the remainder of the HSIP manual. The cost of motor vehicle crashes to our society and the building blocks of road safety were discussed to provide a basic understanding of the transportation safety discipline. The relationship between the HSIP and other programs, and integrating safety into the planning, design, construction, operations, and maintenance processes, is critical to maximizing resources and the potential to impact motor vehicle crashes.
One challenge in reducing crashes and injuries is clearly understanding the crash problem(s). Unit 2 begins the HSIP planning process by addressing the importance of quality data, as well as data collection and problem identification processes.
| < Previous | Table of Contents | Next > |

