U.S. Department of Transportation
Federal Highway Administration
1200 New Jersey Avenue, SE
Washington, DC 20590
202-366-4000
| < Previous | Table of Contents | Next > |
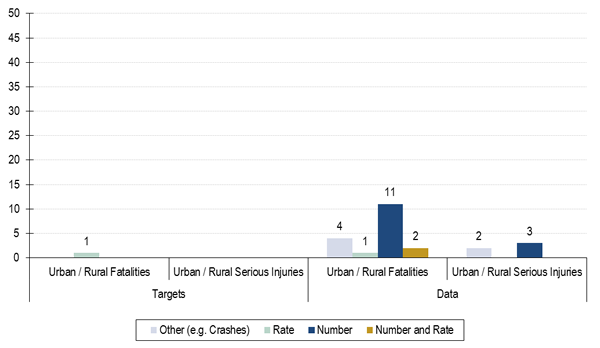
In this section, because States do not currently track safety data by urbanized and nonurbanized area geographies, the terms urban and rural are used. Review of the most recent SHSPs, HSPs (FY 2014) and HSIP Annual Reports (FY 2013) in all 50 States revealed only one State (Georgia) sets urban or rural targets in its SHSP( Figure 4.1, left). A number of States include urban and rural fatality, serious injury, or crash data in their SHSPs to track overall trends (Figure 4.1, right). Of those, some track the extent to which crashes within an SHSP emphasis area are urban or rural.
4.1 Existence of Urban and Rural Targets and Crash Data Analysis in Strategic Highway Safety Plans
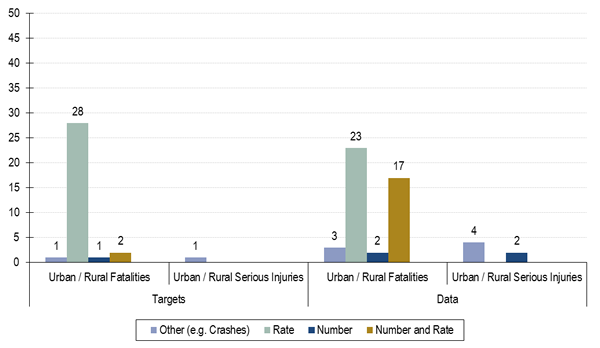
States more commonly include safety targets for urban and rural areas in HSPs than in other State safety documents. This can be attributed to the 2008 Traffic Safety Performance Measures for States and Federal Agencies document which notes, “States should report both rural and urban fatalities/VMT as well as total fatalities/VMT.” More than half of HSPs include urban fatality targets (Figure 4.2 left), but only one includes an urban serious injury target. Nearly all HSPs track rates and/or numbers of urban and rural fatalities, but only a few States include urban and rural serious injury data (Figure 4.2, right).
Figure 4.2 Existence of Urban and Rural Targets and Crash Data Analysis in Highway Safety Plans
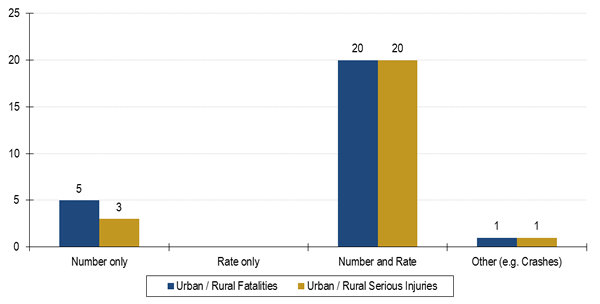
As there is no current requirement, no States report urban or rural safety targets in HSIP Annual Reports. Some HSIP reports include data on urban and rural crashes, as shown in Figure 4.3. Moving forward, it is expected States will begin to report safety targets in these documents, as proposed in the Safety PM NPRM.
Figure 4.3 Existence of Urban and Rural Crash Data Analysis in Highway Safety Improvement Program Annual Reports
The research team analyzed FARS data using GIS to calculate the proportion of fatalities in urbanized and nonurbanized areas according to the FHWA adjusted urbanized area geography using the most recent boundary data available for all States (2000). Table 4.1 summarizes the annual average number and percent of statewide fatalities located in urbanized and nonurbanized areas over a five-year period (2007-2011). In those cases where the sum of urbanized and nonurbanized area fatalities is less than the total, some fatalities were not able to be geolocated (e.g., location data were incorrect or missing). As noted previously, the FHWA adjusted urbanized13 area boundary includes only areas with population over 50,000. There is wide variation across States in the percentage of fatalities that occur in urbanized areas, ranging from six percent for North Dakota to 84 percent in Massachusetts, which is a reflection of the extent to which the land area is urbanized in a State. On a national level, 41 percent of fatalities occur in urbanized areas and 58 percent in nonurbanized areas.
Table 4.1 Annual Average Fatalities in Urbanized and Nonurbanized Areas 2007-2011
| State | Total Annual Average Fatalities | Annual Average Nonlocatable Fatalities | FHWA 2000 Urbanized Area Fatalities | Percent Urbanized Area Fatalities | FHWA 2000 Nonurbanized Area Fatalities | Percent Nonurbanized Fatalities |
|---|---|---|---|---|---|---|
| Alabama | 936 | 1 | 292 | 31% | 643 | 69% |
| Alaska | 67 | 0 | 20 | 29% | 47 | 70% |
| Arizona | 870 | 35 | 382 | 44% | 453 | 56% |
| Arkansas | 593 | 1 | 107 | 18% | 485 | 82% |
| California | 3,206 | 2 | 1,929 | 60% | 1,275 | 40% |
| Colorado | 493 | 0 | 196 | 40% | 297 | 60% |
| Connecticut | 272 | 4 | 203 | 74% | 65 | 25% |
| Delaware | 111 | 0 | 45 | 40% | 66 | 60% |
| Florida | 2,719 | 76 | 1,724 | 64% | 919 | 37% |
| Georgia | 1,355 | 59 | 501 | 37% | 795 | 63% |
| Hawaii | 113 | 4 | 40 | 36% | 69 | 64% |
| Idaho | 217 | 0 | 28 | 13% | 190 | 87% |
| Illinois | 1,009 | 0 | 517 | 51% | 493 | 49% |
| Indiana | 779 | 11 | 244 | 31% | 524 | 69% |
| Iowa | 396 | 1 | 70 | 18% | 325 | 82% |
| Kansas | 401 | 1 | 81 | 20% | 319 | 80% |
| Kentucky | 792 | 1 | 139 | 18% | 652 | 82% |
| Louisiana | 826 | 2 | 268 | 32% | 556 | 68% |
| Maine | 159 | 1 | 20 | 13% | 138 | 87% |
| Maryland | 546 | 5 | 330 | 60% | 211 | 40% |
| Massachusetts | 364 | 9 | 307 | 84% | 48 | 16% |
| Michigan | 954 | 0 | 435 | 46% | 519 | 54% |
| Minnesota | 433 | 0 | 111 | 26% | 322 | 74% |
| Mississippi | 727 | 0 | 96 | 13% | 631 | 87% |
| Missouri | 887 | 1 | 262 | 30% | 624 | 70% |
| Montana | 225 | 0 | 19 | 9% | 206 | 91% |
| Nebraska | 212 | 0 | 31 | 15% | 181 | 85% |
| Nevada | 289 | 1 | 160 | 55% | 128 | 44% |
| New Hampshire | 119 | 0 | 34 | 28% | 85 | 72% |
| New Jersey | 616 | 7 | 453 | 74% | 156 | 26% |
| New Mexico | 368 | 0 | 77 | 21% | 292 | 79% |
| New York | 1,199 | 110 | 727 | 61% | 362 | 39% |
| North Carolina | 1,381 | 75 | 394 | 29% | 912 | 71% |
| North Dakota | 122 | 1 | 7 | 6% | 114 | 94% |
| Ohio | 1,113 | 1 | 465 | 42% | 647 | 58% |
| Oklahoma | 723 | 14 | 155 | 21% | 554 | 79% |
| Oregon | 379 | 1 | 86 | 23% | 292 | 77% |
| Pennsylvania | 1,365 | 3 | 552 | 41% | 810 | 60% |
| Rhode Island | 70 | 0 | 55 | 79% | 15 | 21% |
| South Carolina | 906 | 1 | 240 | 27% | 665 | 73% |
| South Dakota | 130 | 0 | 9 | 7% | 121 | 93% |
| Tennessee | 1,044 | 1 | 364 | 35% | 679 | 65% |
| Texas | 3,215 | 46 | 1,378 | 43% | 1791 | 57% |
| Utah | 262 | 0 | 115 | 44% | 147 | 56% |
| Vermont | 68 | 1 | 6 | 10% | 61 | 91% |
| Virginia | 823 | 46 | 304 | 37% | 473 | 63% |
| Washington | 499 | 3 | 206 | 41% | 290 | 59% |
| West Virginia | 364 | 1 | 54 | 15% | 309 | 85% |
| Wisconsin | 615 | 0 | 150 | 24% | 466 | 76% |
| Wyoming | 146 | 1 | 12 | 9% | 133 | 91% |
| TOTAL | 35,476 | 2 | 14,402 | 41% | 21,074 | 59% |
Source: Cambridge Systematics, Inc.
To calculate fatality rates for adjusted urbanized areas, it was necessary to obtain VMT data from FHWA. Currently, VMT data are provided for urbanized areas on the FHWA Highway Statistics website, but data are provided in the aggregate for urbanized areas spanning multiple States. Therefore, FHWA provided calculations for urbanized area VMT by State for use in this report. Each State must calculate VMT for its annual submission to the Highway Performance Monitoring System (HPMS) maintained by FHWA and should be in possession of its urbanized area VMT.
Table 4.2 shows average annual fatality rates using 2007-2011 FARS data and 2009-2011 VMT data. Ideally, a five-year average of VMT data would be used with five-year average fatalities, but for this study only select years of urbanized area VMT data by State were available. In every State, the nonurbanized fatality rate was higher than the urbanized fatality rate and statewide fatality rate. However, based on the research cited in Section 1, a large proportion of rural crashes are expected to be within five to 10 miles of the urban area boundary. Statewide fatality rates range from 0.70 in Massachusetts to 2.03 in Montana. Urbanized area fatality rates are between 0.42 for Minnesota and 1.49 in Nevada, and nonurbanized fatality rates range from 1.08 in Minnesota to 2.95 in Nevada.
Table 4.2 FHWA 2000 Adjusted Urbanized Area Fatality Rates
| State | Statewide Fatality Rate | Urbanized Area Fatality Rate | Nonurbanized Area Fatality Rate |
|---|---|---|---|
| Alabama | 1.48 | 1.15 | 1.69 |
| Alaska | 1.46 | 1.22 | 1.59 |
| Arizona | 1.45 | 1.00 | 2.27 |
| Arkansas | 1.79 | 0.98 | 2.18 |
| California | 1.01 | 0.78 | 1.83 |
| Colorado | 1.06 | 0.70 | 1.61 |
| Connecticut | 0.89 | 0.79 | 1.41 |
| Delaware | 1.28 | 0.90 | 1.79 |
| Florida | 1.40 | 1.14 | 2.31 |
| Georgia | 1.30 | 0.83 | 1.93 |
| Hawaii | 1.20 | 0.80 | 1.65 |
| Idaho | 1.41 | 0.54 | 1.84 |
| Illinois | 0.99 | 0.74 | 1.56 |
| Indiana | 1.08 | 0.65 | 1.54 |
| Iowa | 1.29 | 0.77 | 1.51 |
| Kansas | 1.34 | 0.67 | 1.80 |
| Kentucky | 1.68 | 0.93 | 2.04 |
| Louisiana | 1.83 | 1.25 | 2.35 |
| Maine | 1.12 | 0.69 | 1.23 |
| Maryland | 1.00 | 0.84 | 1.37 |
| Massachusetts | 0.70 | 0.65 | 1.12 |
| Michigan | 1.01 | 0.76 | 1.42 |
| Minnesota | 0.77 | 0.42 | 1.08 |
| Mississippi | 1.88 | 0.98 | 2.19 |
| Missouri | 1.33 | 0.81 | 1.81 |
| Montana | 2.03 | 1.30 | 2.14 |
| Nebraska | 1.12 | 0.49 | 1.43 |
| Nevada | 1.91 | 1.49 | 2.95 |
| New Hampshire | 0.92 | 0.61 | 1.16 |
| New Jersey | 0.88 | 0.73 | 2.17 |
| New Mexico | 1.47 | 1.01 | 1.67 |
| New York | 0.95 | 0.83 | 1.24 |
| North Carolina | 1.34 | 0.76 | 1.92 |
| North Dakota | 1.45 | 0.47 | 1.68 |
| Ohio | 1.00 | 0.69 | 1.46 |
| Oklahoma | 1.53 | 0.79 | 2.05 |
| Oregon | 1.15 | 0.58 | 1.61 |
| Pennsylvania | 1.39 | 0.99 | 1.89 |
| Rhode Island | 0.87 | 0.79 | 1.39 |
| South Carolina | 1.87 | 1.18 | 2.38 |
| South Dakota | 1.46 | 0.53 | 1.67 |
| Tennessee | 1.53 | 1.07 | 1.99 |
| Texas | 1.41 | 0.94 | 2.27 |
| Utah | 1.05 | 0.72 | 1.62 |
| Vermont | 1.26 | 0.82 | 1.34 |
| Virginia | 1.03 | 0.64 | 1.60 |
| Washington | 0.90 | 0.56 | 1.54 |
| West Virginia | 1.91 | 1.00 | 2.27 |
| Wisconsin | 1.06 | 0.63 | 1.37 |
| Wyoming | 1.58 | 1.19 | 1.63 |
| TOTAL | 1.23 | 0.84 | 1.80 |
Source: Fatality Rate based on annual average 2007-2011 FARS and 2009-2011 VMT provided by FHWA.
When comparing two States using fatality rates, one State may appear to be safer than another based on a comparison of their statewide fatality rates; however, the other State could look safer based on a comparison of urbanized and nonurbanized fatality rates. This phenomenon is known as Simpson’s Paradox. Simpson’s Paradox represents the statistical phenomenon of stratifying aggregate data into two or more groups, and finding that analysis of the smaller groups results in opposing conclusions. It illustrates how the safety profile of a State is affected by the proportion of urbanized and nonurbanized VMT in the calculation.
Table 4.3 shows California has a lower statewide fatality rate than South Dakota; therefore, California roads appear safer. However, the fatality rates for urbanized and nonurbanized areas are both lower in South Dakota than in California. This phenomenon is referred to as Simpson’s Paradox.
Table 4.3 Simpson's Paradox Illustration
| State | Percent Urbanized Area VMT | Percent Nonurbanized Area VMT | Statewide Fatality Rate | Urbanized Area Fatality Rate | Nonurbanized Area Fatality Rate |
|---|---|---|---|---|---|
| California | 78% | 22% | 1.01 | 0.78 | 1.83 |
| South Dakota | 19% | 81% | 1.46 | 0.53 | 1.67 |
Source: Fatality Rate based on annual average 2007-2011 FARS and 2009 VMT provided by FHWA.
A national dataset does not exist with comprehensive, high quality injury crash data like the FARS database for fatal crashes. To conduct GIS analysis of crash locations and determine the proportion of urbanized and nonurbanized serious injury crashes, locations of all serious injury crashes on all public roads are needed for at least one if not multiple three- to five-year periods. To analyze the proportion of urbanized versus nonurbanized serious injuries, the study team contacted crash records managers in all 50 States to request data on serious injuries maintained in State crash records systems.
Through discussions with States and review of the data provided, the study team obtained usable data by 20 States, which is presented in Table 4.4. For each State five years of data were used, but not all time periods were consistent, as noted in the columns to the right. The percentage of serious injuries in urbanized areas is higher than for fatalities. Crashes in urbanized areas are different from those in nonurbanized areas (e.g., there are more bicycle, pedestrian, and intersection crashes in urbanized areas). Generally speeds tend to be slower in urbanized areas so crashes are likely to be less severe, resulting in a higher proportion of serious injuries in urbanized areas compared to fatalities. In addition, crashes in urbanized areas are generally closer to trauma centers, and prompt treatment is known to reduce overall injury severity.
Table 4.4 Serious Injury Numbers for Select States
| State | Percent Urbanized | Percent Nonurbanized | Number of Serious Injuries | Number of Urbanized Serious Injuries | Number of Nonurbanized Serious Injuries | Start Year | End Year |
|---|---|---|---|---|---|---|---|
| Alaska | 51.6% | 48.4% | 435 | 225 | 211 | 2006 | 2010 |
| Arizona | 67.1% | 32.9% | 5,020 | 3,367 | 1,652 | 2008 | 2012 |
| Colorado | 49.2% | 50.8% | 4,128 | 2,033 | 2,096 | 2008 | 2012 |
| Iowa | 30.7% | 69.3% | 1,694 | 520 | 1,175 | 2008 | 2012 |
| Illinois | 66.5% | 33.5% | 9,704 | 6,456 | 3,248 | 2008 | 2012 |
| Louisiana | 43.2% | 56.8% | 1,424 | 616 | 808 | 2008 | 2012 |
| Maine | 27.7% | 72.3% | 636 | 176 | 460 | 2008 | 2012 |
| Michigan | 50.6% | 49.4% | 6,116 | 3,093 | 3,022 | 2008 | 2012 |
| Minnesota | 22.3% | 77.7% | 1,268 | 283 | 984 | 2008 | 2012 |
| Missouri | 39.3% | 60.7% | 6,143 | 2,416 | 3,727 | 2008 | 2012 |
| Montana | 13.4% | 86.6% | 1,094 | 147 | 947 | 2008 | 2012 |
| Nebraska | 33.8% | 66.2% | 1,721 | 582 | 1,139 | 2007 | 2011 |
| New Jersey | 64.1% | 35.9% | 1,532 | 982 | 550 | 2008 | 2012 |
| New York | 68.9% | 31.1% | 12,932 | 8,912 | 4,019 | 2008 | 2012 |
| Ohio | 52.1% | 47.9% | 9,720 | 5,061 | 4,659 | 2008 | 2012 |
| Oklahoma | 39.4% | 60.6% | 3,663 | 1,445 | 2,218 | 2008 | 2012 |
| Oregon | 43.3% | 56.7% | 1,537 | 666 | 871 | 2008 | 2012 |
| Pennsylvania | 46.5% | 53.5% | 2,871 | 1,335 | 1,537 | 2008 | 2012 |
| South Dakota | 21.7% | 78.3% | 837 | 182 | 655 | 2008 | 2012 |
| Texas | 50.7% | 49.3% | 15,459 | 7,839 | 7,621 | 2009 | 2013 |
Source: Cambridge Systematics and State crash databases.
Table 4.5 presents serious injury rates, which are significantly higher than fatality rates given the numbers of serious injury crashes are higher than fatal crashes. The table presents annual average data for a five-year period, but not all time periods are consistent as noted by the columns indicating the years included in the analysis.
Table 4.5 Serious Injury Rates for Selected States
| State | Annual Average Number of Serious Injuries | Statewide Serious Injury Rate | Urbanized Area Serious Injury Rate | Nonurbanized Serious Injury Rate | Start Year | End Year |
|---|---|---|---|---|---|---|
| Alaska | 435 | 9.4 | 13.7 | 7.1 | 2006 | 2010 |
| Arizona | 5,020 | 8.4 | 8.8 | 7.7 | 2008 | 2012 |
| Colorado | 4,128 | 8.9 | 7.2 | 11.4 | 2008 | 2012 |
| Iowa | 1,694 | 5.5 | 5.7 | 5.5 | 2008 | 2012 |
| Illinois | 9,704 | 9.5 | 9.2 | 10.3 | 2008 | 2012 |
| Louisiana | 1,424 | 3.2 | 2.9 | 3.4 | 2008 | 2012 |
| Maine | 636 | 4.5 | 6.1 | 4.1 | 2008 | 2012 |
| Michigan | 6,116 | 6.5 | 5.4 | 8.3 | 2008 | 2012 |
| Minnesota | 1,268 | 2.3 | 1.1 | 3.3 | 2008 | 2012 |
| Missouri | 6,143 | 9.2 | 7.4 | 10.8 | 2008 | 2012 |
| Montana | 1,094 | 9.9 | 10.0 | 9.8 | 2008 | 2012 |
| Nebraska | 1,721 | 9.1 | 9.2 | 9.0 | 2007 | 2011 |
| New Jersey | 1,532 | 2.2 | 1.6 | 7.3 | 2008 | 2012 |
| New York | 12,932 | 10.3 | 10.1 | 10.6 | 2008 | 2012 |
| Ohio | 9,720 | 8.7 | 7.5 | 10.5 | 2008 | 2012 |
| Oklahoma | 3,663 | 7.7 | 7.3 | 8.0 | 2008 | 2012 |
| Oregon | 1,537 | 4.7 | 4.5 | 4.8 | 2008 | 2012 |
| Pennsylvania | 2,871 | 2.9 | 2.4 | 3.6 | 2008 | 2012 |
| South Dakota | 837 | 9.4 | 10.8 | 9.1 | 2008 | 2012 |
| Texas | 15,459 | 6.8 | 5.3 | 9.4 | 2009 | 2013 |
Source: Cambridge Systematics, State crash databases, VMT data for 2009-2011 provided by FHWA.
13When the term FHWA adjusted urban boundary is used in other contexts, this includes areas with population above 5,000.
| < Previous | Table of Contents | Next > |

