U.S. Department of Transportation
Federal Highway Administration
1200 New Jersey Avenue, SE
Washington, DC 20590
202-366-4000
![]()
| < Previous | Table of Content | Next > |
The eight steps of an RSA are shown in Figure 1, and are discussed below with reference to the case studies.
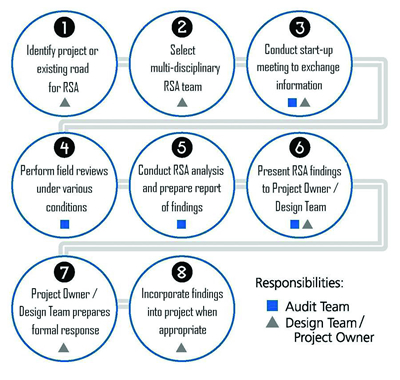
FIGURE 1 RSA PROCESS
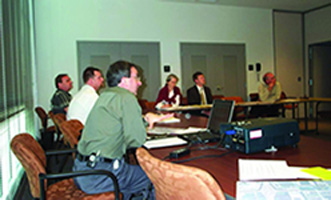
RSA projects and the RSA team (Steps 1 and 2) were pre-selected in this FHWA case studies project. All meetings and site visits for the RSAs in the case studies project were conducted over two to four days, depending on the size and complexity of the project. The RSAs typically began with a start-up meeting (Step 3) attended by the Project Owner (hereafter referred to as the Owner), the Design Team, and the RSA team:
The multidisciplinary RSA team then described the RSA process. This included an overview of the RSA process with examples of safety issues that are typically encountered and mitigation measures to address them.
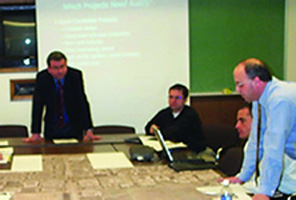 Illinois DOT |
 Standing Rock Sioux Reservation |
| FIGURE 2 START-UP MEETING |
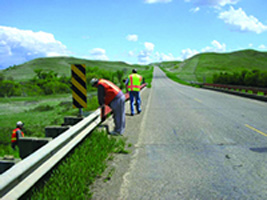
FIGURE 3 FIELD REVIEW |
Following the start-up meeting and a preliminary review of the design or site documentation provided by the Owner and Design Team, the RSA team conducted a field review (Step 4). The purpose of the field review was to observe the ambient conditions in which the proposed design would operate (for design-stage RSAs), or to observe geometric and operating conditions (for RSAs of existing roads). The RSA team observed road user characteristics (such as typical speeds and traffic mix), surrounding land uses (including traffic and pedestrian generators), and link points to the adjacent transportation network. Field reviews were conducted by the RSA team under a variety of environmental conditions (such as daytime and night-time) and operational conditions (such as peak and non-peak times).
The team conducted the RSA analysis (Step 5) in a setting in which all team members reviewed available background information (such as design criteria, project/justification reports, traffic volumes, and any relevant collision data) and drawings. The RSA analysis methodology involved a systematic review of design drawings, examining features such as road geometry, sight distances, clear zones, drainage, signing, lighting, and barriers. Human factors issues were also considered by the RSA team, including road and intersection “readability”, sign location and sequencing, older-driver limitations, and driver perception of geometric features constructed to minimum standards. On the basis of this review of drawings, reports, and information obtained during the field review, the RSA team identified and prioritized safety issues, project features that could contribute to a higher frequency and/or severity of crashes. For each safety issue, the RSA team generated a list of possible ways to mitigate the crash potential.
At the end of the analysis session, the Owner, Design Team, and RSA team reconvened for a preliminary findings meeting (Step 6). Presenting the preliminary findings verbally in a meeting gave the Owner and Design Team the opportunity to ask questions and seek clarification on the RSA findings, and also provided a useful forum for the Owner and Design Team to suggest additional or alternative mitigation measures in conjunction with the RSA team. The discussion provided practical information that was subsequently used to write the RSA report.
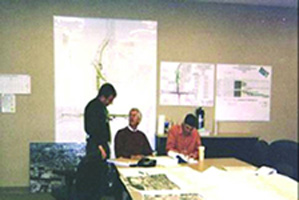 Illinois DOT |
 Standing Rock Sioux Reservation |
| FIGURE 4 RSA ANALYSIS SESSION |
FIGURE 5 PRELIMINARY FINDINGS MEETING |
In the weeks following the on-site portion of the RSA, the RSA team wrote and issued the RSA report (also part of Step 6) to the Owner and Design Team documenting the results of the RSA. The main contents of the RSA report were a prioritized listing and description of the safety issues identified (illustrated using photographs taken during the site visit), with suggestions for improvements.
The Owner and Design Team were then encouraged to write a brief response letter (Step 7) containing a point-by-point response to each of the safety issues identified in the RSA report. The response letter identifies the action(s) to be taken, or explains why no action would be taken. The formal response letter is an important “closure” document for the RSA. As a final step, the Owner and Design Team use the RSA findings to identify and implement safety improvements as and when policy, manpower, and funding permit (Step 8).
For design-stage RSAs, a prioritization framework was applied in both the RSA analysis and presentation of findings. The likely frequency and severity of crashes associated with each safety issue were qualitatively estimated, based on team members’ experience and expectations. Expected crash frequency (Table 2) was qualitatively estimated on the basis of expected exposure (how many road users would likely be exposed to the identified safety issue?) and probability (how likely was it that a collision would result from the identified issue?). Expected crash severity (Table 3) was qualitatively estimated on the basis of factors such as anticipated speeds, expected collision types, and the likelihood that vulnerable road users would be exposed. These two risk elements (frequency and severity) were then combined to obtain a qualitative risk assessment on the basis of the matrix shown in Table 4. Consequently, each safety issue was prioritized on the basis of a ranking between A (lowest risk and lowest priority) and F (highest risk and highest priority). It should be stressed that this prioritization method was qualitative, based on the expectations and judgment of the RSA team members, and was employed to help the Owner and Design Team prioritize the multiple issues identified in the RSA.
For each safety issue identified, possible mitigation measures were suggested. The suggestions focused on measures that could be cost-effectively implemented at the current design stage.
| ESTIMATED | EXPECTED CRASH FREQUENCY (per RSA item) |
FREQUENCY RATING | |
|---|---|---|---|
| EXPOSURE | PROBABILITY | ||
| high | high | 10 or more crashes per year | Frequent |
| medium | high | ||
| high | medium | 1 to 9 crashes per year | Occasional |
| medium | medium | ||
| low | high | ||
| high | low | less than 1 crash per year, but more than 1 crash every 5 years | Infrequent |
| low | medium | ||
| medium | low | less than 1 crash every 5 years | Rare |
| low | low | ||
| TYPICAL CRASHES EXPECTED (per RSA item) |
EXPECTED CRASH SEVERITY | SEVERITY RATING |
|---|---|---|
| crashes involving high speeds or heavy vehicles, pedestrians, or bicycles | probable fatality or incapacitating injury | Extreme |
| crashes involving medium to high speed; head-on, crossing, or off-road crashes |
moderate to severe injury | High |
| crashes involving medium to low speeds; left-turn and right-turn crashes |
minor to moderate injury | Moderate |
| crashes involving low to medium speeds; rear-end or sideswipe crashes |
property damage only or minor injury | Low |
| FREQUENCY RATING | SEVERITY RATING | |||
|---|---|---|---|---|
| Low | Moderate | High | Extreme | |
| Frequent | C | D | E | F |
| Occasional | B | C | D | E |
| Infrequent | A | B | C | D |
| Rare | A | A | B | C |
| Crash Risk Ratings: | A: lowest risk level | C: moderate-low risk level | E: high risk level |
|---|---|---|---|
| B: low risk level | D: moderate-high risk level | F: highest risk level |
| < Previous | Table of Content | Next > |

