U.S. Department of Transportation
Federal Highway Administration
1200 New Jersey Avenue, SE
Washington, DC 20590
202-366-4000
The first step in any problem-solving process is identifying and understanding the problem to solve; systemic safety analysis is no different. The Federal Highway Administration’s (FHWA) Systemic Safety Project Selection Tool1 describes the systemic safety analysis process beginning with Identifying Focus Crash Types and Risk Factors. This first step lays an important foundation for all subsequent steps in the systemic safety analysis process and involves three tasks:
Systemic Safety Analysis does not require robust data or complex analysis methods to be effective. Nearly all transportation professionals have access to the information and data they need to pursue systemic safety analysis and make appropriate systemic-based decisions. The first steps of Systemic Safety Analysis primarily use fatal and serious injury crash data, to which many agencies have access.
Below are tips and strategies for using resources your agency already has to perform systemic safety analysis. A scenario implementing each task is woven throughout to help illustrate the concepts.
An agency would like to make the biggest safety impact
possible with the available (but limited) resources. From the
State’s SHSP, the agency knows that roadway departure
crashes account for 52 percent of all fatalities within the
State. The agency decides to use its resources to reduce as
many roadway departure fatalities as possible.

TARGET CRASH TYPE:
Roadway departure crashes.
A target crash type represents the greatest number (or proportion/percentage) and type of severe crashes across the system being analyzed (i.e., has the greatest potential to reduce fatalities and serious injuries). Local safety data is often an agency’s first choice when identifying target crash types. Since the Systemic Safety Analysis focuses on preventing fatal and serious injury crashes, the following additional resources may be also helpful.
Strategic Highway Safety Plan (SHSP): The SHSP promotes emphasis areas for a State or regional safety program. Emphasis areas are typically identified through a data-driven process.
Fatality Analysis Reporting System (FARS): Agencies can use the National Highway Traffic Safety Administration’s (NHTSA) Fatality Analysis Reporting System (FARS) database to identify common fatal crash types on a national, State, or local level.
Proportion of F&SI Crashes
= Number of F&SI Crashes on Facility
Number of F&SI Crashes on System
Proportion of Total Crashes
= Number of Total Crashes on Facility
Number of Total Crashes on System
The goal of establishing a focus facility type is to break the target crash type (e.g., roadway departure) into smaller groupings that have similar roadway characteristics. Many agencies narrow focus groups by using crash data to develop a “crash tree” diagram that breaks down crashes into progressively more detailed categories.
For this process, the level of data analysis can vary based on availability of reliable crash data. An agency may only have access to fatal crash data; if so, the staff would follow a process similar to the Task 2 Scenario.
If more reliable crash data are available, an agency may consider both fatal and serious injury (F&SI) crashes as well as total crashes. During this analysis, the agency would calculate each facility’s proportion of F&SI crashes and the proportion of total crash type.
By comparing the facility’s proportion of F&SI crashes to the proportion of total crashes, the agency can identify overrepresented facility types. This step allows the agency to select a facility type that is experiencing higher than expected F&SI crashes.
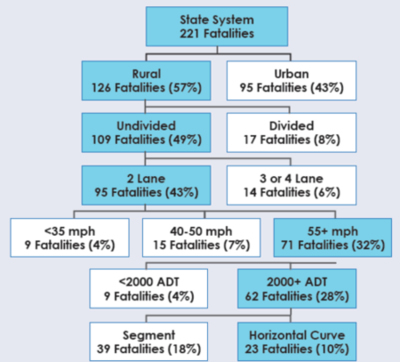
Note: Percentages in parentheses represent the proportion of total roadway departure fatalities on the State System (Total: 221 Fatalities).
SCENARIO: TASK 2
The agency does not have reliable total crash data, so it uses State roadway departure fatality data to identify a focus facility. The crash tree diagram below outlines the process, with the blue-shaded boxes showing the iterative focus facility type.
The agency finds that two-lane, undivided, rural roadways with speed limits above 55 mph exhibit the largest proportion of crashes. The agency further compares crashes occurring on horizontal curves to those occurring on segments and finds that, per centerline mile, a much greater number of crashes occur on horizontal curves.
----------------------------------------------------------

FOCUS FACILITY TYPE:
Two-lane rural curves with posted speeds
>55 mph, and with an Average Daily Traffic
(ADT) of 2,000 or greater.
The final step is to identify and evaluate roadway factors. Roadway factors represent the roadway and traffic characteristics present at locations experiencing higher than expected frequencies of the target crash type on the focus facility type.
The agency does not have access to a roadway inventory system, nor the staff available to collect data for every location in the facility type category. As such, the agency selected roadway factors the staff could identify using Google Earth. It also selected roadway factors it believed it could address.
Once agency staff had assembled the list of roadway factors, they used the HSM and the CMF Clearinghouse to develop threshold selection criteria for each. Each selection criteria is predicted by these resources to increase crashes by 10 percent or more over the ideal base condition.
| Roadway Factors | Baseline | Selection Criteria |
|---|---|---|
| Lane width | 12 ft | 10 ft or less |
| Shoulder width | 6 ft | 4 ft or less |
| Roadside hazard rating | Rating of 3 | Rating of 1 or 1.5 |
| Side-slope | 1V:7H | 1V:4H slope or greater |
| Advisory speed | 55 mph | Less than 35 mph |
The agency found that:
Next, the agency followed the remaining steps outlined in the Systemic Safety Project Selection Tool, prioritized candidate locations based on number of roadway factors and potential for improvement, and selected countermeasures.
Identifying roadway factors can largely be based on engineering judgment and experience or documented resources. Listed are several sources agencies might use to identify common roadway factors associated with the focus crash type and focus facility type.
FHWA’s Potential Risk Factors List.2 FHWA provides a list of potential risk factors for curves, segments, and intersections. The list is classified into three categories: Roadway & Intersection Features, Traffic Volume, and Other Features.
Highway Safety Manual (HSM).3 Each chapter in Parts C and D of the HSM focuses on a facility type and organizes Crash Modification Factors (CMF) by roadway characteristic (e.g., lane width, shoulder width, roadside hazard rating). These roadway characteristics can be used as part of a systemic safety analysis.
Field Visits to Several Sites. Visiting several locations within the focus facility type will help identify common roadway characteristics that may be present at other locations within the same facility type.
Transportation Personnel. Talking with pavement and maintenance staff can identify otherwise unknown roadway factors. EMS providers and law enforcement may also have an opinion of roadway factors that contribute to crashes on the focus facility type.
Note: Roadway factors do not need to be directly addressable. Most agencies select countermeasures that help mitigate the potential for future crashes rather than eliminate them. For example, if a horizontal curve has narrow lanes, a small radius, and no shoulders or clear zone, then an appropriate countermeasure may be enhanced roadside delineation. Directly addressing a roadway factor (e.g. widening the road or straightening out a curve) is probably not cost effective.
Some agencies have very robust data collection procedures while others rely on estimates. An agency does not necessarily need a robust dataset to identify locations that can benefit from a safety improvement. Below are several methods agencies use to collect data for roadway factor evaluation.
Roadway and intersection inventories can provide most of the data needed to identify roadway factors and prioritize locations based on the number and severity of roadway factors present.
Online aerial imagery (e.g., Google Earth, Bing maps) allows practitioners to view many roadway data attributes from their desk and estimate the number of roadway factors present at a given location. For example:
Similar to Google Earth, photo logs captured and retained by many agencies can be used to estimate many roadway data attributes including lane width, shoulder width, segment length, roadside hazard rating, and curve density.
Crash data can indicate areas where fatality and serious injury crashes continue to occur. An agency can investigate these locations and identify roadway factors present. The agency uses these roadway factors to identify other locations with similar characteristics, indicating a similar potential for future fatality and serious injury crashes.
For each roadway factor, practitioners can select a threshold value at which the factor contributes to significantly higher than expected frequencies of the target crash type. Thresholds can be selected in several different ways.
HSM and CMF Clearinghouse. Practitioners can use the HSM and the CMF Clearinghouse4 to estimate the degree to which each roadway factor contributes to increases in target crash frequencies within the facility type. For example, the base condition for lane width in the HSM is 12 ft. Incremental decreases in lane width below 12 ft. causes incremental increases in predicted crashes. An agency can either:
Qualitative Assessment. Based on experience and engineering judgment, an agency may choose to quantify levels of roadway factors as Low, Medium, or High, especially where exact data may be missing. Using the same example, a lane having a width of 11 ft. to 11.5 ft. may be classified as Low, 10.5 ft. to 11 ft. as Medium, and below 10 ft. as having High potential for future crashes.
Crash Data. An agency can use crash data to determine the threshold values for roadway factors. For example, an agency may compare fatality and serious injury crashes on roads with 9.5 ft., 10 ft., 10.5 ft., and 11 ft. lane widths and find that a significant decrease in safety occurs on roads with lane widths of 10 ft. or less. The agency would then use lane widths of 10 ft. or less as the threshold value for their lane width roadway factor.
Once a focus crash type, a facility type, and roadway factors are identified, the next steps are to:
Detailed guidance on each of these steps is provided in FHWA’s Systemic Safety Project Selection Tool.5 For more information on training and technical assistance on the systemic approach to safety, visit https:// safety.fhwa.dot.gov/systemic/.
1 Federal Highway Administration. Systemic Safety Project Selection Tool. FHWA-SA-13-019. 2013. Washington, D.C. Accessible at: https://safety.fhwa.dot.gov/systemic/fhwasa13019/sspst.pdf.
2 Federal Highway Administration (FHWA). Potential Risk Factors. Washington, D.C. Accessible at: https://safety.fhwa.dot.gov/systemic/pdf/FHWA_SystemicApproach_PotentialRiskFactors.pdf.
3 American Association of State Highway and Transportation Officials (AASHTO). Highway Safety Manual. 2010.
4 Federal Highway Administration (FHWA). CMF Clearinghouse User Guide. Washington, D.C. Accessible at: http://www.cmfclearinghouse.org/userguide.cfm.
5 Federal Highway Administration (FHWA). Systemic Safety Project Selection Tool. FHWA-SA-13-019. 2013. Washington, D.C. Accessible at: https://safety.fhwa.dot.gov/systemic/fhwasa13019/sspst.pdf.
For additional
information,
please contact:
Jerry Roche
FHWA Office of Safety
515.233.7323
Jerry.Roche@dot.gov
John McFadden
FHWA Resource Center
410.962.0982
John.McFadden@dot.gov
Every Day Counts (EDC), a State-based initiative of FHWA's Center for Accelerating Innovation, works with State, local and private sector partners to encourage the adoption of proven technologies and innovations aimed at shortening and enhancing project delivery.

