U.S. Department of Transportation
Federal Highway Administration
1200 New Jersey Avenue, SE
Washington, DC 20590
202-366-4000
FHWA Course on Bicycle and Pedestrian Transportation
Slideshow for Instructors' Use
Slideshow Script: Bicycle Planning and Design
- PowerPoint Word Slide (title): Planning and Designing Bicycle Facilities
- PowerPoint Word Slide: Why should we accommodate bicycles?
- Bicycles are legally considered to be vehicles, with the right to use
the transportation system.
- One in ten U.S. households does not own an automobile
- There are 9 million bike trips in the U.S. everyday
References: Uniform Vehicle Code, 1995 National Personal Transportation
Survey (NPTS), 1990 US Census
- PowerPoint Word Slide:
More reasons:
- 48.8% of all trips are shorter than 3 miles - a 15 minute bike ride
- 40% of U.S. adults say they would commute by bike if safe facilities
available
- 1/3 of population do not drive an automobile
Explanation:
A sizeable number of US citizens do not drive because they are too young,
or are adults who for whatever reason do not choose to drive (perhaps
due to a disability or by choice), or are elderly citizens who are no
longer able to drive.
References: 1995 NPTS, 1995 poll by Rodale Press, 1990 US Census
- PowerPoint Word Slide:
And still more reasons:
- Better environment: reductions in air pollution and traffic congestion
- Better health: 60% of Americans lead completely sedentary lifestyles,
40% clinically overweight
- Better safety: over 750 bicyclists killed and 59,000 injured per year
(1996 figures) in motor vehicle related crashes.
Reference: 1998 American Medical Association Report
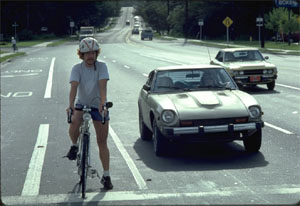
- Photo Slide: Street filled with cars
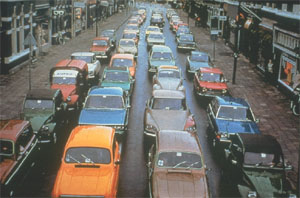
Explanation:
Economics of urban space: the next series of slides were taken some years
ago in Copenhagen to illustrate the value of bicycling within the urban transportation
network, particularly in terms of the amount of space needed for bicycling.
A street filled with 4 lanes of single-occupant automobiles is crowded, as
this picture shows.
- Photo Slide: Street filled with people seated
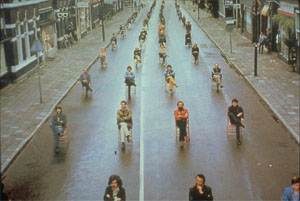
Explanation:
Here's the amount of space that each person would occupy if they were riding
bikes (and spread out like cars).
- Photo Slide: Bicyclists on the side of the street
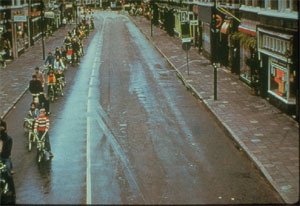
Explanation:
And here's the amount of space that the same number of bicyclists use when
riding in a normal formation on the right-hand side of the road.
- PowerPoint Word Slide: Federal Goals for Bicycling
Set by USDOT in National Bicycling and Walking Study (1994):
- Double the percentage of total trips made by bicycling and walking
(from 7.9 to 15.8%)
- Simultaneously reduce by 10% the number of bicyclists and pedestrians
killed or injured in traffic crashes
- PowerPoint Word Slide: Federal Legislation
- ISTEA – Intermodal Surface Transportation Efficiency Act (1991)
- TEA 21 – Transportation Equity Act of the Twenty-First Century
Explanation:
Bicycle and pedestrian facilities are eligible for funding through the
Enhancements program, which (in both ISTEA and TEA-21) sets aside 10%
of federal Surface Transportation funds for ten categories of "enhancements "
which also include scenic byways, historical transportation facilities,
etc.
Reference: FHWA-PD 98-049: A Summary: Bicycle and Pedestrian Provisions
of the Federal-Aid Program
- PowerPoint Word Slide: Spending on Bike/Ped Facilities: Pre-ISTEA and During
ISTEA
- Pre-ISTEA: $4 million/year nationwide
- During ISTEA: $160 million/year nationwide
Reference: Rails-to-Trails Conservancy
- PowerPoint Word Slide: Bicycling in Other Countries
- Japan: 15% of workers commute by bicycle
- Netherlands: 20% – 50% of all trips are by bicycle
- Germany: 10 – 45% of all trips are by bicycle
- China: Beijing – 48% by bicycle
Tianjin – 77% by bicycle
- United States: <1% of all trips
References: FHWA-PL-95-006: FHWA Study for Pedestrians
and Bicycle Safety in England, Germany, and the Netherlands, FHWA – PD-94-023: The National Bicycling and Walking Study, 1995 National
Personal Transportation Survey
- PowerPoint Word Slide: Developing a Local Bicycle Master Plan
- Public outreach
- Policy planning (intergovernmental coordination)
- Plan for physical improvements
- Plan for new programs to support bicycling
Explanation:
Obviously, one of the reasons we don't see many people bicycling in the United
States is because our roadway system is not very compatible with bicycling.
Many local communities throughout the country have developed Bicycle Master
Plans that identify how (and where) improvements are needed. Public outreach
is always a very important part of local bicycle plans - and it is important
to get a wide variety of people involved: parents who are concerned about
the safety of their children who ride bikes, casual adult riders, bicycle
club members, advanced riders, bicycle commuters, bike patrol officers, children
bicyclists, and others.
Policy planning is an important part of a bicycle master plan - policy plans
identify ways to improve conditions for bicycling and walking by modifying
existing policies and operating procedures. Examples would include a policy
to provide bike lanes on all new roadway construction, or new ordinances that
require developers to install bike parking near entrances of retail and office
buildings.
Planning for physical improvements is obviously an integral feature of a local
bicycle master plan - since funding is always limited, it is necessary to
decide where to make improvements first. This usually involves deciding which
corridors have the highest potential bicycle travel demand but have poor conditions.
Local plans often include a number of additional programs that support bicycling,
such as education programs for motorists, education programs for all ages
of bicyclists (usually emphasizing in-school training for younger children),
encouragement programs such as employer incentives to encourage bicycle commuting,
bike-to-work day activities, and an enforcement program for bicycle laws that
is coordinated through the local police department.
- PowerPoint Word Slide (title): Measuring Bicycle Compatibility of Roadways
Explanation:
Many communities are turning to more scientific methods to measure the bicycle
compatibility of their roadway system. These methods can be very helpful in
making decisions about which roads should be improved first.
- PowerPoint Word Slide:
Bicyclists' Perception of Comfort: Common Variables
- Proximity of Bicyclist to Motor Vehicles
- Volume and Speed of Traffic
- Volume of Heavy Vehicles
- Pavement Condition
- Curb Cuts and/or On-Street Parking
Explanation:
There are several common variables that have been proven to affect a bicyclist's
perception of comfort when riding along any given roadway. The first factor
– proximity of the bicyclists to motor vehicles – has been shown to have the
most significant effect on a bicyclist's perception of comfort.
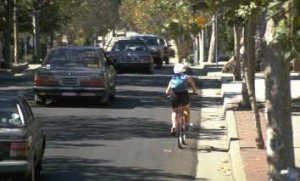
- Photo Slide: Bicyclist riding in bike lane
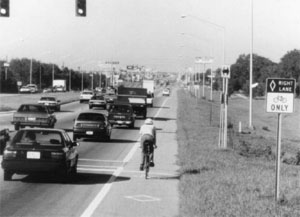
Explanation:
Studies have shown that when bicyclists have an adequate amount of separation
from moving traffic – such as this bicyclist has in this bike lane – their
comfort level increases.
- Photo Slide: Bicyclist squeezed in travel lane
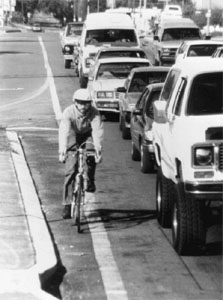
Explanation:
But when space is tighter and the bicyclist is forced to operate in close
proximity to motor vehicle traffic, their comfort level decreases dramatically.
- Photo Slide: Bicyclist riding alone
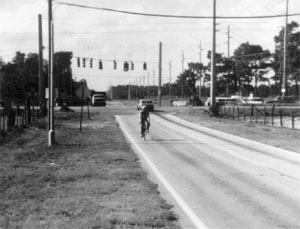
Explanation:
Volume of traffic also has an effect on a bicyclist's comfort level - as you
can see in this photo, bicyclists prefer lower volumes of traffic...
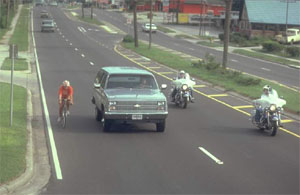
- Photo Slide: Bicyclist riding with motor vehicles
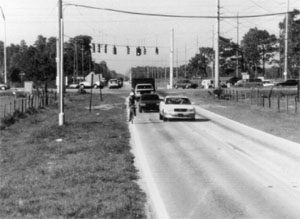
Explanation:
But when volumes increase, obviously, bicycling conditions deteriorate, particularly
when the road is narrow and doesn't have shoulders or bike lanes.
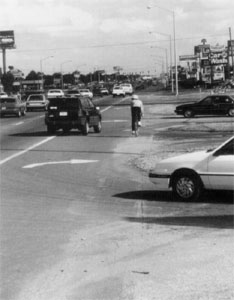
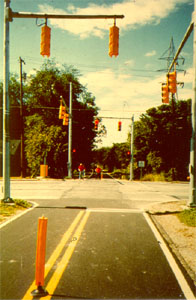
- Photo Slide: Traffic moving through intersection
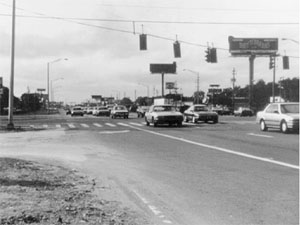
Explanation:
Speed also has a profound effect on bicyclists – at lower speeds, bicyclists
feel more comfortable...
- Photo Slide: Traffic moving faster
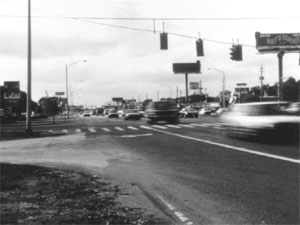
Explanation:
But as speeds increase, bicyclists' perception of safety drops. The faster
the traffic is moving, the worse it gets for bicyclists.
- Photo Slide: Bicyclist with a truck
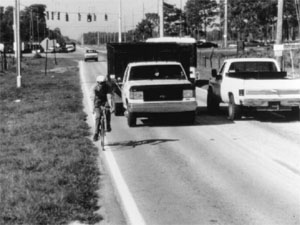
Explanation:
Volume of heavy vehicles has also been shown to have an effect of bicyclists,
due to the "blast effect " – when a truck passes a bicyclist, it creates a
strong wind sheer that can affect the rider's balance.
- Photo Slide: Pavement surfaces
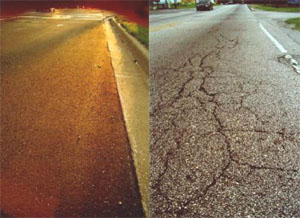
Explanation:
The quality of the pavement surface also has an effect on bicyclists. If the
pavement is cracked and uneven, or has potholes, it draws the attention of
the bicyclist downward, and creates more discomfort because the bicyclist
has to worry about avoiding surface hazards. Remember that a bicycle is a
vehicle that lacks a suspension system like an automobile – surface bumps
and potholes cause a serious crash if a bicyclist hits one unexpectedly.
- Photo Slide: Road with residential driveways
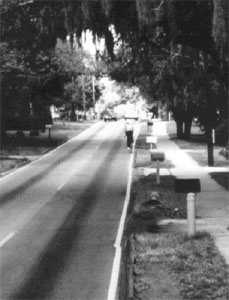
Explanation:
Curb cuts and on-street parking also have an effect on bicyclists. While residential
driveways do not cause significant discomfort...
- Photo Slide: Road with commercial driveways
Explanation:
Commercial driveways reduce the quality of the bicycling environment – mostly
due to higher volumes of turning traffic, and merging traffic, as you can
see in this picture. On-street parking also increase the level of "side friction "
- drivers pulling into and out of spaces, drivers opening doors and unloading
- these all have an effect on a bicyclist's perception of the quality of the
riding environment.
So, to summarize this discussion, why do we measure these things? Because
this is a way to quantify where and why conditions are poor (or alternatively,
good) for bicycling. Some people feel that bicycle facilities aren't warranted
because they don't see bicyclists out on the road today – well, if bicyclists
don't feel comfortable riding on the existing urban roadways, then it's doubtful
they will ever begin riding – unless conditions are improved.
- PowerPoint Word Slide: Bicycle Level of Service/Compatibility Models
Bicycle Compatibility Index
- Developed by FHWA, used throughout the US
- Available through FHWA's Turner-Fairbank Highway Research Center (www.tfhrc.gov)
Bicycle Level of Service Model
- Developed in Florida, used throughout the US
- Available through Florida DOT
Explanation:
There are two models available nationally that take the variables I've described
into account, and rank roadways according to their compatibility for bicycling.
These models have been tested and are both accepted by the engineering profession
as providing a fairly accurate measure of bicycle conditions.
- PowerPoint Word Slide (title): Types of Bicyclists
- Photo Slide: Advanced bicyclist
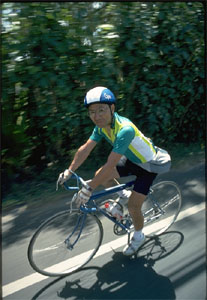
Explanation:
There are different types of bicyclists with various skill levels. In general,
they fall into several categories. This is a "Type A " advanced bicyclist.
These are people who ride regularly – confident, strong riders. They are generally
accustomed to riding in traffic, but many will still avoid the worst roadways.
They are interested in direct routes (for utilitarian riders) and/or scenic
routes (recreational riders).
- Photo Slide: Basic bicyclist
Explanation:
There is a very large group (the majority) of bicyclists who aren't as confident
in their bicycling skills, but still enjoy riding. Traffic conditions are
quite daunting to this group, however they also represent an enormous potential
for reducing auto trips if bicycling conditions were better. These are referred
to as "Type B " bicyclists.
Type B bicyclists may also ride for utilitarian purposes. This group also
includes many low income Americans who ride for purely economic reasons –
they can't afford an automobile.
- Photo Slide: Child bicyclist
Explanation:
Child bicyclists or "Type C " cyclists are the last group. Their riding is
initially monitored by parents. They may have all the confidence of Type A
riders, but lack coordination and judgment when it comes to traffic conditions.
- PowerPoint Word Slide: Designing Bicycle Facilities: Policies and Standards
- Federal/National
- U.S. Access Board – Americans with Disabilities Act Accessibility
Guidelines (in the case of shared use paths)
- FHWA – Manual on Uniform Traffic Control Devices (MUTCD)
- AASHTO – Guide for the Development of Bicycle Facilities
- State and local manuals
- Example: Oregon DOT Bicycle and Pedestrian Plan
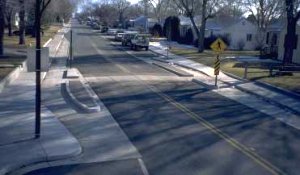
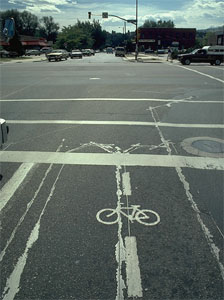
- PowerPoint Word Slide (title): Types of Bicycle Facilities
- Photo Slide: Shared Roadway
Explanation:
Since the bicycle is considered a vehicle with the legal right to use most
roadways (except limited access freeways in some states), all roadways are
shared roadways.
- Photo Slide: Poor Bicycling Conditions on Roadway
Explanation:
Unfortunately, most roads in urban and suburban areas are not good for bicycling.
Heavy traffic, high speeds, narrow lanes and vast intersections with multiple
turn lanes make bicycling very difficult in urban and suburban areas. Bicyclists
are left with very little space in which to safely operate.
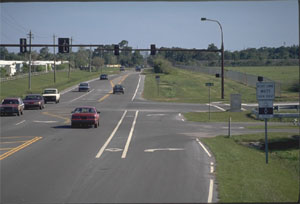
- Photo Slide: Wide outside lane
Explanation:
By adding just a few feet of width, roadways can accommodate bicyclists effectively.
This photo shows a wide outside lane – 14' in width instead of the normal
12'. Both the bicyclist and motorist can occupy the same lane. The downside
is that motorists tend to travel faster in a wide lane, and this makes bicyclists
more uncomfortable. You have to be careful when you design this type of facility
– outside lanes that are too wide (i.e. 15' or 16') can result in two cars
operating in one lane.
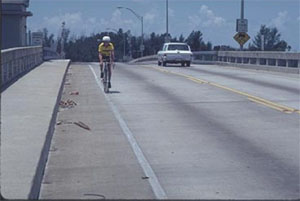
- Photo Slide: Paved shoulder
Explanation:
By striping additional space on the edge of the road to create a shoulder
you can improve a bicyclist's sense of comfort. A four-foot to ten-foot wide
shoulder is preferred (given the traffic volumes and speed of traffic along
the corridor in question), however according to the AASHTO Guide for the
Development of Bicycle Facilities, any additional width is better than
none at all.
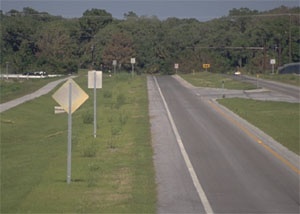
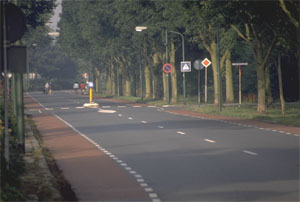
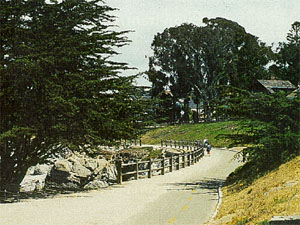
- Photo Slide: Bike route
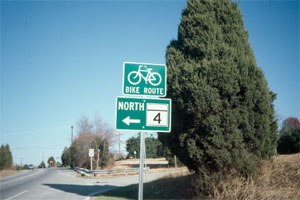
Explanation:
In some cases, the road is already in good condition – quiet, with low speeds
and traffic volumes.
Bike routes can be designated on shared roadways if they are part of a network
of facilities. Bike routes are described in the AASHTO Guide for the Development
of Bicycle Facilities as being "signed shared roadways. " The Guide states
that the "signing of shared roadways should indicate to bicyclists that particular
advantages exist to using these routes compared with alternative routes. This
means that responsible agencies have take actions to assure that these routes
are suitable as shared routes and will be maintained in a manner consistent
with the needs of bicyclists. " In other words, bike route signs should not
be placed on roadways with hazardous conditions or sudden, unexpected obstacles
such as narrow bridges or unsafe drain grates.
Green bike route signs are also often used in rural areas for bicycle touring
routes.
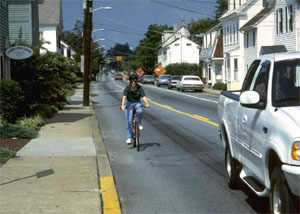
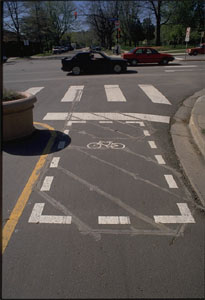
- Photo Slide:
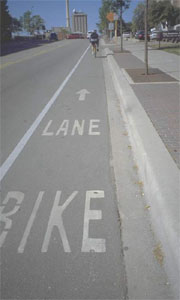
Explanation:
Bike lanes are typically 5' in width (4' minimum if there is no curb) with
marking and signs (standardized by MUTCD) that define the space as a bike
lane. They should always be on both sides of the street, and travel in the
same direction as the adjacent travel lane.
- Photo Slide: Re-striping photo
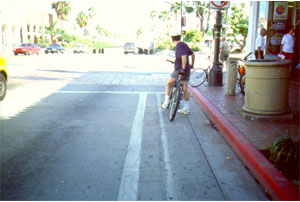
Explanation:
Bike lanes can be created at a lower cost by re-striping roadways either during
normal repaving projects, or by removing and replacing markings. This photo
shows a bike lane that was developed this way in Santa Barbara, CA – you can
barely see the old stripe in this photograph – it's just to the left of the
bicyclist. When the road was re-striped, the motor vehicle lanes were reduced
in width to allow additional space for bike lanes on the sides – you can see
the new stripe in the photograph.
- Graphic Slide: Before and after re-striping (also an example of a "Road
Diet ")
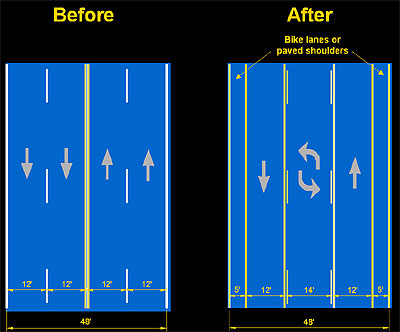
Explanation:
Re-striping roadways with bike lanes basically redistributes roadway space,
either by narrowing lanes or reducing the number of lanes (on roads with excess
capacity), in order to achieve more room on the sides for bike lanes. In this
example, a four lane roadway has been re-striped with two through lanes with
a center left turn lane, and 5' wide paved shoulders on both sides. It is
important to analyze the effects of re-distributing roadway space on both
bicycle level of service and motor vehicle level of service.
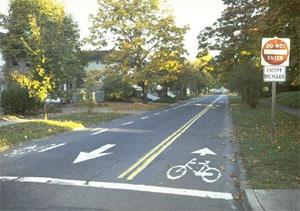
- Photo Slide: Bike lane photo with arrow
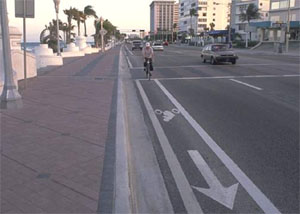
Explanation:
Bike lanes should include an arrow to indicate direction of travel, since
wrong-way riding is a problem (particularly in college towns).
- Photo Slide: Bike lane at right turn lane
Explanation:
At exclusive right turn lanes (either at intersections or driveways), bike
lanes must transition to the left-hand side of the turn lane. Currently, there
is no single recommended method of marking this transition.
- Photo Slide: Bike lane ends sign
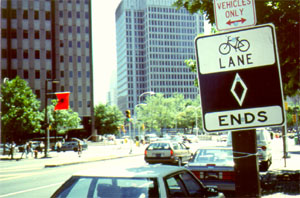
Explanation:
Must take care in locations where bike lanes end – do not leave bicyclist
in a dangerous or difficult traffic situation. (Photo taken on Ben Franklin
Parkway in Philadelphia)
- Photo Slide: Bike lane ending/transition
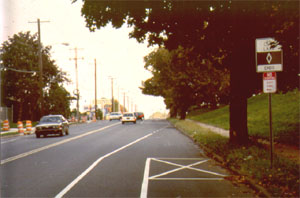
Explanation:
Provide advance warning that the bike lane will end ahead, use appropriate
pavement markings to signal the end of the lane. If necessary, end lanes in
a location where the bicyclist would have the option to turn onto a side street,
if traffic conditions ahead are particularly bad.
This example has good and bad points. This bike lane is in Philadelphia. A
sign a couple hundred feet back warns that the end of the lane is near, and
there are good sight lines in this location so motorists can see merging bicyclists
ahead. The merge location is shown with a dashed line. It could be made better
by making the merge area less abrupt by starting the dash further back to
encourage bicyclists to merge earlier. It would also be beneficial to place
a wide curb cut at this location to enable less experienced bicyclists to
get off the road here, if necessary.
- Photo Slide: Bike lane needing maintenance
Explanation:
Maintenance for bike lanes is important – a bike lane that has gathered rocks,
trash and debris can't be used. This is a common problem and a source of great
criticism for local governments who haven't provided adequate maintenance.
Motor vehicle lanes are swept automatically by vehicular movement – in some
cases, that debris ends up in the bike lane.
- Photo Slide: Contra-flow lane
Explanation:
Innovative solutions that are not currently in the MUTCD but are currently
being explored in Europe and the US: contra-flow lanes on one-way streets
can sometimes be warranted, particularly if they provide a route for bicyclists
that is shorter or avoids a difficult traffic situation. There should always
be a double yellow line between the bike lane and the motor vehicle lanes,
and signing should be used to make it clear that bicycles – and not automobiles
– are allowed in this direction. Care should be taken to ensure that contra-flow
lanes do not have confusing pavement markings or other traffic control devices.
- Photo Slide: Blue bike lanes
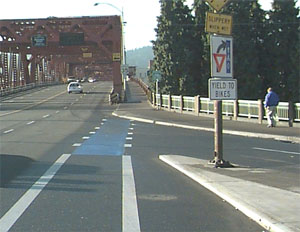
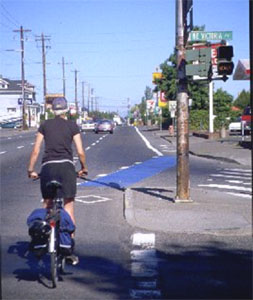
Explanation:
Another innovative solution that is not currently in the MUTCD: blue bike
lanes have been used in Europe and in parts of the United States to draw attention
to bike lanes and to discourage motorists from encroaching upon them. Motorists
may be unaware that it is illegal to drive and park in bicycle lanes. Even
more critical, they are unaware of the need to yield to cyclists when crossing
a bicycle lane to turn right or get into a right-turn only lane. The result
of this is a relatively high level of conflicts in these areas — both in terms
of crashes and "near misses."
In the U.S., a number of communities have experimented with colored bike lanes.
These photographs were taken in Portland, Oregon, as part of a two-year study
the City of Portland (with assistance from FHWA) conducted on blue bike lanes
in locations that had weaving problems between bikes and cars. The study found
that motorists appeared to yield more frequently to bicyclists after the blue
bike lanes were installed, and more motorists tended to stop or slow down
when approaching the conflict areas. Bicyclists, however, were found to decrease
head turning and hand signaling, although they were more likely to use the
recommended path across the conflict area. Overall, the number of conflicts
decreased with the use of blue bike lanes in these areas.
- Photo Slide: Red bike lane
Explanation:
In Germany, the Netherlands, Sweden and Denmark, red is more commonly used
for colored bike lanes. Experiments in the United States have included non-skid
paint, and asphalt imbued with thermoplastic material for color. The latter
method is generally accepted as being more durable (paint wears off), although
imbued asphalt is considerably more expensive. Whichever method is used, it
must be a non-skid surface under wet conditions.
- Photo Slide: Traffic calming
Explanation:
Like pedestrians, bicyclists can benefit greatly from traffic calming. Traffic
calming devices should be designed with the bicyclist in mind, however. This
photo shows a speed hump with a cut-through for bicyclists.
- PowerPoint Word Slide (title): Other Barriers and Roadway Hazards Affecting
Bicyclists
- Photo Slide: Unsafe grate
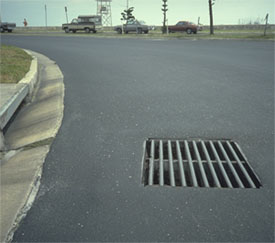
Explanation:
Drain grates parallel to travel can catch a bicycle wheel and cause a major
crash.
- Photo Slide: Safe grate
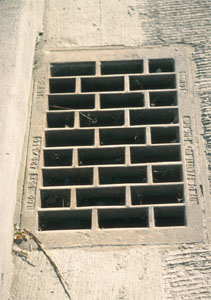
Explanation:
Grate openings should be perpendicular to travel. Some cities have instituted
programs to locate and replace all unsafe grates.
- Photo Slide: Bicyclist waiting at an intersection
Explanation:
At actuated signals, loop detectors in the pavement are designed to react
to the presence of a motor vehicle – and are often not sensitive enough to
detect the smalldisturbance in the inductance field created by a bicycle.
So unless an automobile pulls up, a bicyclist may not be able to get a green
light.
- Photo Slide: Loop marking
Explanation:
One solution is to find the spot along the loop wire that is most sensitive
(i.e. the location a bicycle should stand in order to trip the signal). A
special marking should be placed on that spot so that bicyclists can find
it. Unfortunately, this doesn't always work. Many of the newer metal loops
are not tuned sensitively enough to detect a bicycle, or the detectors may
not be working.
- Photo Slide: Loop marking in a bike lane
Explanation:
The Traffic Detector Handbook (published by the Institute of Transportation
Engineers) recommends a quadrupole loop detector for bike lanes. It should
be placed directly in the bike lane to insure that bicycles can trip the signal.
- Photo Slide: Railroad crossing
Explanation:
Railroad and light rail crossings create rough, uneven conditions. Bicycles
are much more susceptible to these surface irregularities because they have
no suspension. A rough railroad crossing can not only cause permanent damage
to a bicycle, it can cause the bicyclist to lose control and crash. This photo
shows an improved crossing – smoother for both motorists and bicyclists. Railroad
crossings that are at an acute angle can be particularly bad, since a bicycle
tire can get caught between the edge of the rail and the edge of the pavement.
- Photo Slide: Metal bridge deck
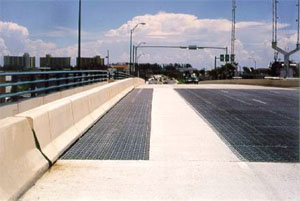
Explanation:
Metal bridge decks can be very slippery when wet. The best solution is to
avoid using a metal deck in a location that will be used by bicyclists. If
a temporary solution is needed, a concrete filler can be used on the right
hand side of the lane to reduce sliding.
- Photo Slide: Recessed manhole cover and grate
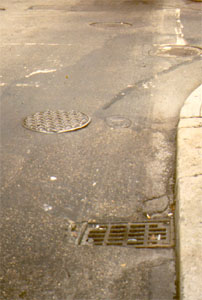
Explanation:
Surface irregularities can often be worse in CBD's and urban downtown areas
where the streets have been repaved and patched many times. Manhole covers
and inlet grates should always be raised during repaving projects, rather
than leaving them at their former height. Notice that in this photo the manhole
covers were raised, but the inlet grates were not.
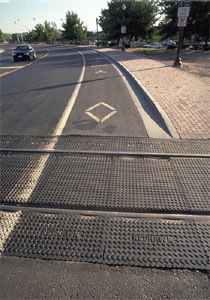
- Photo Slide: Rumble strips
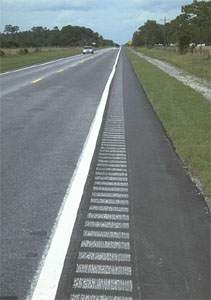
Explanation:
Designers should be aware that rumble strips on shoulders can result in operational
problems and safety hazards for bicyclists. The benefits of rumble strips
should be carefully weighed against the problems they cause for bicyclists.
The AASHTO Guide for the Development of Bicycle Facilities recommends
that, if rumble strips are absolutely necessary, a minimum of 4 feet of pavement
width to the right of the rumble strip should be provided for bicyclists.
In this photo, the total width of the shoulder is only about 5 or 6 feet,
and about a third of that space is taken up by the rumble strip. Therefore,
this is not a good example since the shoulder does not provide 4 feet of width
for the bicyclist.
- Photo Slide: Narrow roadway underpass
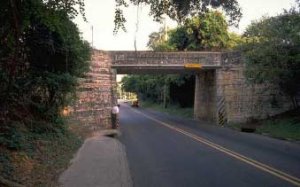
Explanation:
Pinch points like this one are obviously difficult for bicyclists and pedestrians.
Narrow bridges cause the same problems.
- Photo Slide: Roadway underpass with adjacent bicycle underpass
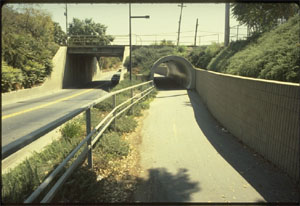
Explanation:
Here's one solution.
- Photo Slide: Bridge with separated bicycle area
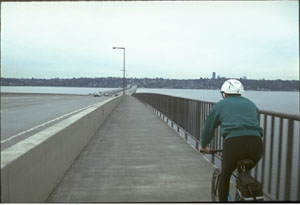
Explanation:
Here's a solution for bicycle access over a bridge. This is US Interstate
5 in Seattle, Washington, one of their "floating bridges". When
it was rebuilt, they provided bicycle and pedestrian access.
- PowerPoint Word Slide (title): Shared Use Path Design
(also termed Multi-Use Trails and Bike Paths)
Reference for this part of slideshow: AASHTO Guide for the Development
of Bicycle Facilities
- Photo Slide: Baltimore and Annapolis Trail
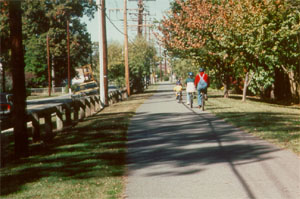
Explanation:
Multi-use trails are popular among bicyclists for both recreation and transportation
use. These are some great examples of trails in urban areas that are used
for transportation:
- Burke-Gilman Trail, Seattle, Wash.
- Baltimore and Annapolis Trail, MD
- Schuylkill River Greenway, Philadelphia, PA
- Rock Creek Park, Washington, DC
- University Parks Trail, Toledo, Ohio
(and many more)
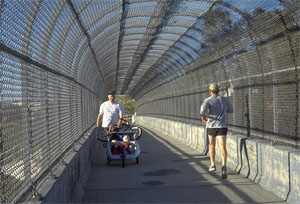
- Graphic Slide: Cross section of a shared use path
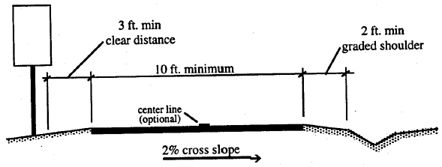
Explanation:
Shared use path design is covered extensively by the AASHTO Guide for the
Development of Bicycle Facilities. The standards cover everything from
horizontal and vertical curvature to trail/roadway intersections to trail
bridge structures. A few basics: paths should be a minimum of 10' wide to
accommodate two-way bicycle travel (some urban areas are installing 12' and
14' wide trails due to heavy use). Shared use paths should have a 2' minimum
level shoulder (with no vertical obstructions).
- Photo Slide: Railing next to a shared use path – Monterrey, CA
Explanation:
There should be a minimum of 5' between the edge of the shared use path and
a steep slope. Otherwise, a safety rail is needed (minimum height: 42 ")
- Photo Slide: Crowded path
Explanation:
Shared use paths have become so popular in urban areas that they are often
crowded, leading to conflicts (and sometimes injuries).
- Photo Slide: Shared use path with painted lane lines
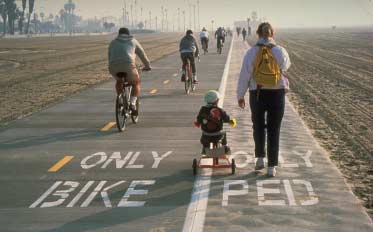
Explanation:
One solution is to develop separate lanes of travel.
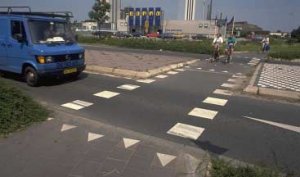
- Photo Slide: (from collection) – Shared use path/roadway intersection at
the Washington and Old Dominion Trail in Washington, DC
Explanation:
Shared use path/roadway intersections should be carefully designed to increase
the safety of trail uses. Often, these intersections occur at midblock locations,
where motorists are not expecting pedestrians and bicyclists to cross. There
are several methods that can improve safety:
- Photo Slide: (from collection) – Path user-actuated signal
Explanation:
This is a shared use path/roadway intersection on the West Orange Trail near
Orlando, FL. The light stays green until a trail user hits the signal button.
Decisions about whether this type of signal is warranted are usually made
after an engineering analysis that considers anticipated trail volumes, available
"gap " time for pedestrians to cross, and other factors such as visibility
and traffic speed. Warning signing and crosswalk markings are important features
of the crossing as well.
- Photo Slide: Trail bridge
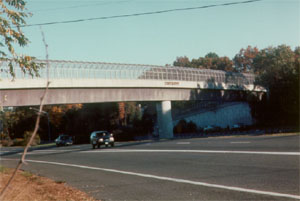
Explanation:
Grade-separated crossings (overpasses and underpasses) are expensive solutions,
but sometimes necessary due to severe traffic conditions that would make an
at-grade crossing dangerous or impossible. This bridge carries the East Coast
Greenway across Rt. 100 (a limited access freeway) in Maryland.
- Photo Slide: Traffic calming
Explanation:
Another solution is traffic calming. Traffic calming prior to, and at the
site of the crossing can help to reduce speeds and alert motorists of the
trail crossing. A speed table combined with median refuge island can be a
very effective approach.
- PowerPoint Word Slide (title): Other Programs and Facilities that Benefit
Bicyclists
- Photo Slide: Bike on bus rack
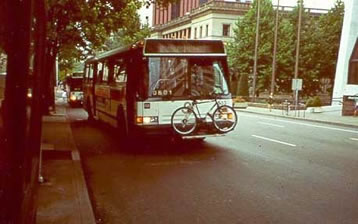
Explanation:
Bike on transit programs can greatly expand the service area for transit programs.
Many cities and towns in the U.S. are instituting these programs, and have
been very successful. Racks are usually installed on the fronts of buses,
and hold two bikes. Bike-on-Rail programs have also become popular (transit
agencies allow riders to bring their bikes aboard, sometimes providing special
cars with extra storage space. In some cities, this service is limited to
non-peak hours.
- Photo Slide: Bike to Work Day, Philadelphia, 1998
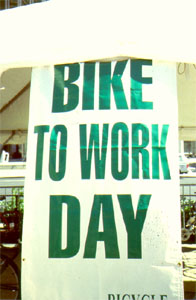
Explanation:
Bike-to-Work Day is an annual event held in the spring in the U.S. Most major
cities host an event or a week of events (Denver hosts a Bike-to-Work month).
There are a variety of commuter incentive programs that have been used across
the country to encourage bicycle commuting, including cash incentives, premium
bike parking facilities (sometimes inside the building), shower facilities,
flexible working hours, "free ride home" programs in the event of
an emergency, and bike maintenance on-site.
- Photo Slide: Bike rack
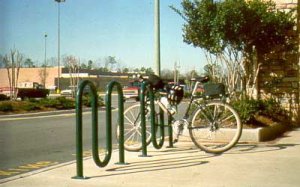
Explanation:
Most cities lack adequate bike parking. This can be a disincentive to bicycling
– both because of the inconvenience and because bicycles that aren't locked
to a sturdy structure may very likely be stolen. Bike racks should be simple
in design, and should support the frame of the bike (not just the wheel).
This is a slightly modified version of the popular U-rack.
- Photo Slide: Bike locker
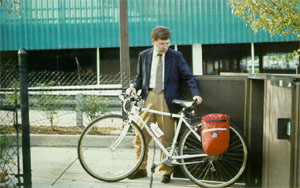
Explanation:
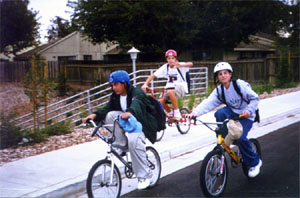
- Photo Slide: Kids learning bike skills
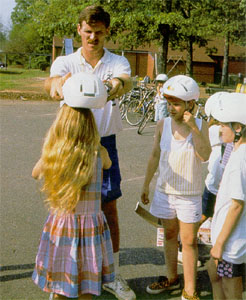
Explanation:
Return to top
Page last modified on February 1, 2013

