U.S. Department of Transportation
Federal Highway Administration
1200 New Jersey Avenue, SE
Washington, DC 20590
202-366-4000
| < Previous | Table of Content | Next > |
Communities throughout the United States have begun to recognize both the potential for bicycle and pedestrian travel and the barriers that must be overcome. In order to address these issues, many communities have begun to develop master plans for bicycle and pedestrian mobility, often as part of the local Comprehensive Plan or Transportation Improvement Program, or through other regional planning efforts.
The renewed effort to plan for bicycle and pedestrian mobility was given a tremendous boost by the Intermodal Surface Transportation Efficiency Act (ISTEA) in 1991, and was reaffirmed in 1998 by the Transportation Equity Act for the 21st Century (TEA-21). This new era of transportation legislation brought an array of planning requirements to States and Metropolitan Planning Organizations (MPOs). This lesson provides an overview of ISTEA and TEA-21 planning issues, and presents a variety of model master planning processes that can be used at various levels of government.
ISTEA requires preparation of non-motorized elements within State and metropolitan transportation plans.
In addition, each State and each MPO is required to incorporate appropriate provisions for bicycling and walking into the State Transportation Improvement Program (STIP) and Transportation Improvement Programs (TIP).
In addition, each State is required to establish a Bicycle and Pedestrian Coordinator position in its State department of transportation. ISTEA offers substantial incentives for taking bicycling and walking seriously as alternative transportation modes. There is a wide variety of ISTEA funding programs with potential application to bicycling and walking.
State plans vary considerably in detail and planning approach.
Information is available on Federal, State, and, in some areas, local levels to assist in preparation of bicycle and pedestrian transportation plans.
Technical guidance from FHWA/FTA.
The Federal Highway Administration and Federal Transit Administration
have issued Technical Guidance for Bicycle and Pedestrian Planning at the
State and MPO levels in order to meet Federal requirements.
In brief, the Technical Guide includes the following key points relevant to State and metropolitan area transportation planning for bicycles and pedestrians.
Bicycle and pedestrian elements of transportation plans should include:
(1) Vision and goal statements and performance criteria.
(2) Assessment of current conditions and needs.
(3) Identification of activities required to meet the vision and goals.
(4) Implementation of the bicycle and pedestrian elements in statewide
and MPO transportation plans and transportation improvement programs.
(5) Evaluation of progress, using performance measures developed in (1).
(6) Public involvement as required by TEA-21 and the FHWA/FTA planning
regulations.
(7) Transportation conformity requirements for air quality, where necessary.
State and metropolitan area planning guidelines.
State and MPO transportation planning guidelines vary considerably in
terms of format, level of detail, and planning approach. In some States, the
plans are prepared by staff and, in others, with primary input from consultants.
Some States have developed detailed guidelines for preparation of bicycle
and pedestrian plans and programs, while others provide little guidance in
this area. Some have initiated a rigorous process of working with local and
regional entities to make sure that the STIP is responsive to community needs,
while others take a more hands-off approach.
Some communities combine the elements ofon-road bikeways,
trails,
and sidewalks into a single plan.
Preparing regional plans.
The ISTEA planning process has the potential to be a major stimulus to
intermodal cooperation and work among diverse local entities and disciplines.
Working together to set priorities and select projects on a metropolitan basis
can help bring communi ties within the region closer together as common objectives
are defined and mutually agreeable selection criteria are established.
Regional planning process issues.
Issues that typically arise during the regional planning process include:
Interpreting the meaning of an "eligible" project under the various ISTEA programs.
Cities and town with good bicycle and pedestrian plans can have a far greater impact on the regional and State-level planning processes. It is advantageous for the local entity to format its plan to meet State and regional guidelines so it can easily be folded into STIP, TIP, and specific bicycle/pedestrian plans.
It is beneficial if neighboring communities can work together to coordinate recommendations and create linkages. Implementation of local programs and facility construction can have far greater use if they extend beyond the city limits to adjoining communities.
Recommended Action Plan for State and Local GovernmentsAction Item 1: Organize a bicyclist/pedestrian program Action Item 2: Plan and contruct needed facilities Action Item 3: Promote bicycling and walking Action Item 4: Educate bicyclists, pedestrians, and the public Action Item 5: Enforce laws and regulations Many entities need to organize their roles and objectives as part of the local planning effort. |
In order to do well in the "ISTEA Derby," the local entity must demonstrate a commitment to providing matching funds and meeting required deadlines, and should come equipped with specifics of projects, cost-estimates, and other information to add to the regional planning process. The city that does its homework has the best chance of securing the funds.
Pedestrian planning strategy.
Planning for pedestrians should begin with a thorough understanding of existing
local conditions. Therefore, it is advisable to start a pedestrian program
by developing a project checklist to help identify possible problems, existing
environmental constraints, and/or program features.
Next, proceed to implement improvements through the use of interactive and responsive programs. For the most part, such programs can be managed as part of an agency's routine function.
For example, if the project checklist suggests installing accessible curb ramps at intersections, find out what curb-cut standard (if any) the street department currently uses. If a poor or sub-optimal design is being used, there are several steps that can be followed to improve safety for pedestrians. These include:
Another approach that can help determine where to start is to see what America's most progressive "pedestrian-friendly" communities are doing. Pedestrian activities in these communities typically include:
Some projects are modest in scope, while others can be major undertakings. While each of these projects and programs may be part of a larger comprehensive planning effort, each can be implemented singly. Also, implementation can be accomplished in phases and in sequences that best reflect local realities.
Many communities are making traffic calming a top priority.For example, if it would be easy to install key pedestrian signals, but far more difficult to retrofit sidewalks on a bridge across a major river, the former should be done immediately and the latter as funding and political support materialize. If the zoning ordinance is currently being revised, adding pedestrian considerations like mixed-use zoning or reduced commercial frontage requirements might be considered. Thus, it is both possible and desirable to pick and choose those projects and programs from the list that have local appeal and are doable. Such an approach makes it possible to get things going almost immediately and to start making a real difference in the community, often at minimal expense.
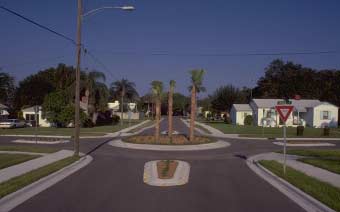
Of course, some projects are expensive. For instance, if there is a need for a grade-separated pedestrian crossing of a freeway, such a project can easily cost upwards of $300,000 to $500,000. Planning for such an expenditure can take several years and may involve grant applications or implementation through the Transportation Improvement Program (TIP) process and the use of any one of several categories of Federal funds. Meanwhile, many small, but important, changes can be made as the community works its way toward pedestrianfriendliness. Many local programs have found that small initial successes build momentum, allowing more ambitious work to follow. In one western community, for instance, installation of several "test" traffic circles on residential streets – a project that took several days of work and less than $5000 to accomplish – helped build support for an on-going program installing such circles all over town.
Walkways:
Typical concerns: Sidewalks are often broken, missing, or not continuous.
Possible Solutions: Require sidewalk installation or replacement as a
condition of development.
Intersections:
Typical concerns: 14 percent of fatal crashes in urban areas occur in
the central business district (CBD). Two-thirds of CBD injuries occur
at intersections.
Possible solutions: Create guidelines for intersection design to make pedestrians as visible as possible and their actions as predictable as possible.
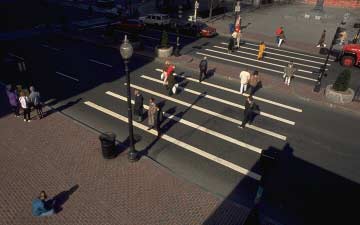
Crosswalks:
Typical concerns: Pedestrians "dart out" or cross vehicular
roadways at random locations.
Possible solutions: Create a program to install crosswalks, bulbouts
(flared curbs), and refuge islands to encourage pedestrians to cross streets
and roads at predictable, as well as convenient, locations. Bulbouts and
refuge islands also reduce exposure time for pedestrians at crossings
and increase green time for vehicles.
Curb ramps:
Typical concerns: Wheelchair users can't cross street or must use a nearby
driveway.
Possible solutions: Create an annual curb ramp program to install ramps
where requested.

Pedestrian signals that are consistent in their design and actuation
are important.
Creative intersection design can greatly increase motorists' awareness
of pedestrian safety.
Curb bulbs and curb radii:
Typical concerns: Wide streets are more difficult to cross than narrow
ones and expose pedestrians to traffic dangers for a longer period of
time.
Possible solutions: Use curb bulbs to narrow streets at important crossings
and include the specifications in standard designs.
Signal timing and push buttons:
Typical concerns: Pedestrian signals are often inconsistent in their
timing and actuation methods.
Possible solutions: Follow a consistent policy of push-button installation
and signal timing whenever traffic signals are installed or modified.
Pedestrian half-signals:
Typical concerns: Where residential streets meet arterial streets
at unsignalized intersections, pedestrians may have great difficulty crossing.
Possible solutions: Install pedestrian half-signals near schools, hospitals,
social service offices, and senior citizen centers.
Signing and marking:
Typical concerns: When pedestrian signing and marking is used in the
wrong location, in the wrong manner, or for the wrong purpose, it can
lead to a false sense of security for pedestrians.
Possible solutions: Evaluate high-risk locations and install consistent
pedestrian crossing controls.
Pedestrian amenities:
Typical concerns: Streetscape is devoid of amenities and street furniture
that facilitate and encourage walking.
Possible solutions: Develop and install a system of amenities and street
furniture, taking care not to limit sight distance or restrict the width
of normal pedestrian paths.
Reconfiguring arterial streets:
Typical concerns: High arterial street speeds are often associated
with high risks of pedestrian fatalities.
Possible solutions: Change the channelization to provide median refuges
and slow traffic down.
Bridges:
Typical concerns: Without adequate sidewalks, pedestrians may have to
walk in the roadway or avoid a walking trip all together.
Possible solutions: Make sure sidewalks are included in all major renovation
projects.
Traffic calming:
Typical concerns: Too often, through traffic diverts to residential streets
in order to avoid arterial street congestion.
Possible solutions: Install a set number of traffic circles per year in
response to neighborhood requests.
Maintenance:
Typical concerns: Badly maintained sidewalks or those cluttered with
portable signs and newspaper stands can lead to pedestrian injuries.
Possible solutions: Enact clear and fair laws governing the use of sidewalks
for private purposes. Establish and implement an ongoing maintenance program.
Remove all hazards. If a hazard cannot be removed, erect barriers or clear
warning signs.
Possible solutions: Develop an interest in a series of neighborhood and
regional walking maps.
Walking events:
Typical concerns: Just getting started is often the biggest barrier to
increased pedestrian activity.
Possible solutions: Facilitate the organization and promotion of special
walking events to celebrate foot travel and encourage novices to give
walking a try.
3.4 Local Bicycle Planning
Transportation planning is a process for making decisions about the development
of transportation facilities. This includes providing accurate information about
the effects that proposed transportation projects will have on the community
and projected users. Bicycle planning is no exception. However, because much
of the information necessary to reach sound decisions about providing for safe,
efficient bicycle use is already available as a by-product of the normal operation
of the road system, the bicycle planning process is a specific application of
the overall transportation planning process.
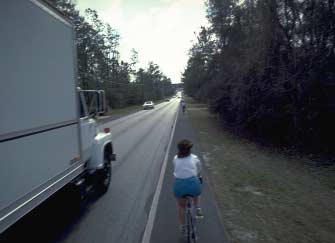
This is especially true in the case of Group A bicyclists-the more experienced
and proficient bicyclists that comprise about 5 percent of bicycle users in
the United States. These bicyclists are able to operate on the roadway in most
traffic conditions and favor the directness and right-of-way preference given
to roads with a high functional classification.
The planning process used to develop or improve roadways for motorists is equally valid for this type of bicyclist.
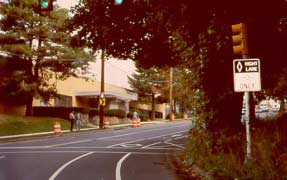 Group B (basic) bicyclists value designated bike facilities such as bike lanes. |
There are, however, some important design features to be taken into account to best accommodate Group A bicyclists, and for this reason, planners and engineers should refer to the American Association of State Highway and Transportation Officials (AASHTO) Guide for the Development of Bicycle Facilities (1999) during the planning process for streets and highways. Group A riders should be anticipated and provided for on all roadways where bicycles are not excluded by statute or regulation, regardless of functional classification.
The situation is very different for Group B/C bicyclists (bicyclists of average
skill and experience, and children). While these bicyclists value many of the
same roadway features as Group A bicyclists (i.e., accessibility and directness),
they also value other characteristics such as designated bicycle facilities
and lower traffic volumes.
Group B/C bicyclists typically prefer to ride on neighborhood streets and/or
designated bicycle facilities. The location of these facilities is best determined
through a planning process that seeks to determine where designated facilities
are needed and the type of bicycle facilities that should be provided to accommodate
and encourage Group B/C bicyclists.
Developing a Bicycle Network Plan
The following discussion details a planning process intended to identify a network
of routes where special bicycle facility treatments should be employed to meet
the needs of Group B/C bicyclists.
Many model planning processes could be used to select routes and design facility
treatments to accommodate Group B/C bicyclists. Chapter 1 of the AASHTO Guide
contains several suggestions for establishing a bicycle planning program. The
following process is but one example It consists of six steps:
Establish Performance Criteria for the Bicycle Network
Performance criteria define the important qualitative and quantitative variables to be considered in determining the desirability and effectiveness of a bicycle facility network. These can include:
Inventory Existing System
Both the existing roadway system and any existing bicycle facilities should
be inventoried and evaluated. The condition, location, and level of use of existing
bicycle facilities should be recorded to determine if they warrant incorporation
into the proposed new network or if they should be removed.
If existing bicycle facilities are to be used as the nucleus of a new or expanded
network, the inventory should note which improvements to the existing portions
of the network may be required to bring the entire new network up to uniform
design and operations standards.
A simple inventory of the roadway system could be based on a map of the annual average daily traffic (AADT) counts on each road segment within a community or region. A more complex inventory could include factors such as the number of traffic lanes, the width of the outside lane, the posted speed limit or actual average operating speed, the pavement condition, and certain geometric and other factors (e.g., the frequency of commercial driveways, grades, and railroad crossings).
Identify Bicycle Travel Corridors
Predicting bicycle travel corridors for a community is not the same as identifying
the routes that bicyclists currently use. Instead, travel corridors can be thought
of as "desirable lines" connecting neighborhoods that generate bicycling
trips with other zones that attract a significant number of bicycling trips.
For motor vehicle traffic, most peak morning trips are made between residential neighborhoods and employment centers. In the evening peak hours, the opposite is true. In the evening or on weekends, the pattern of trip generation is much more dispersed as people travel to shopping centers, parks, and the homes of friends or relatives.
Estimating these trip flows for an entire city can be a complex, time-consuming effort requiring significant amounts of raw data and sophisticated computer models. Fortunately, transportation planning for bicycles is much simpler. Unlike traditional transportation planning that attempts to predict travel demands between future zones on as-yet unbuilt streets and highways, bicycle planning attempts to provide for bicycle use based on existing land uses, assuming that the present impediments to bicycle use are removed. These desire lines are, in fact, well represented by the traffic flow on the existing system of streets and highways.
The underlying assumption is that people on bikes want to go to the same places as do people in cars (within the constraints imposed by distance), and the existing system of streets and highways reflects the existing travel demands of the community. Furthermore, most adults have a mental map of their community based on their experience as motor vehicle operators. Thus, they tend to orient themselves by the location of major streets and highways.
Again, it is important to note that the resulting map may not be a representation
of where bicyclists are now, but is instead a reflection of where bicyclists
wish to go. The actual travel patterns of Group B/C bicyclists are heavily influenced
by their perception of the bicycling environment they face. Uncomfortable or
threatening bicycling conditions will cause these bicyclists to alter route
choice from their most preferred alignment, choose a different travel mode,
or not make the trip at all. Thus, the task of the transportation planner for
bicycling is to ask, "Where are the bicyclists now?" and "Where
would they be if they could go where they preferred?"
Although this use of existing traffic flows is a useful overall predictor of
bicyclists' desire lines, a few special situations may require adjustments to
the corridor map:
Evaluate and Select Specific Route Alternatives
The corridor identification procedure identifies desire lines for bicycle travel
between various locations. The next step is to select specific routes within
these corridors that can be designed or adapted to accommodate Group B/C bicyclists
and provide access to and from these locations. The aim is to identify the routes
that best meet the performance criteria established in the first step of this
planning process.
Typically, this step and the selection of appropriate design treatments are
highly interactive processes. The practicality of adapting a particular route
to accommodate Group B/C bicyclists may vary widely depending upon the type
of design treatment selected. For example, a less direct route may become the
best option if comparatively few inexpensive and easily implemented design improvements
are required.
Therefore, steps 4 and 5 should be approached as an iterative loop in which both route selection and design treatment are considered together to achieve a network that is highly advantageous to the user, is affordable, has few negative impacts on neighbors and other non-users, and can be readily implemented.
In summary, the selection of a specific route alternative is a function of several factors, including:
A more inclusive list of factors to be considered in the selection of a specific route is presented in the AASHTO Guide.
Guidelines for selecting an appropriate design treatment are presented in lesson 3 of this manual. In overview, the principal variables affecting the applicability of a design treatment are:
Evaluate the Finished Network Plan Using the Established Performance
Criteria
Will the proposed network meet the criteria established at the start of
the planning process? If it does not meet most of these criteria, or inadequately
meets a few critical goals, either the proposal will require further work, or
the performance criteria must be modified. In the latter case, the planning
process as a whole should be reviewed to determine if previously discarded routes
should be reconsidered. There may now be more preferred options in light of
the newly modified criteria.
This reality check is important. Many well-considered proposals fail when it
is determined that the finished product no longer meets its established objectives.
(Drake, Pedestrian and Bicyclist Safety and Accommodation Participant Workbook, 1996).
Bicycle planners have traditionally relied on anecdotal evidence to prove that
bicycle facilities are needed within specific roadway corridors. In the case
of a typical urban arterial with heavy traffic and relatively high speeds, planners
rightfully argue that demand is not accurately reflected by the number of bicyclists
currently riding within the road right-of-way. They maintain that due to impedances,
there exists a pent up, or latent, travel demand within the corridor.
However, when challenged to quantify this latent demand, many planners are at a loss as to how to respond. Some bicycle planners attempt to employ the "desire lines" technique-a vintage 1930's planning tool that has become obsolete with today's environment of linked urban tripmaking patterns and expectations of sophisticated travel demand models. Other planners have relied on the "if you build, it they will come" philosophy of response - one that requires a leap of faith that many policymakers aren't ready to take except in rare circumstances.
 Several factors will determine the final design treatment used; two of the foremost are cost and controversy. |
Today's trend toward quantitative analysis puts more pressure than ever on transportation planners to justify public expenditures "by the numbers." Increasingly, competition among projects for priority within metropolitan area Transportation Improvement Programs requires a numerical basis to demonstrate that all projects can reach measurable objectives. Furthermore, in the case of the increasingly popular method of providing facilities by development exactions, local governments have been issued a "wake-up call" by the U.S. Supreme Court through its 1994 Dolan vs. Tigard decision. That decision has underscored the need for local governments to clearly demonstrate, or quantify, how a proposed bicycle facility will offset traffic caused by new land developments. Clearly, in today's transportation planning environment, bicycle planners must use analytical methods in order to do their jobs successfully.
While millions of dollars and decades of research have gone into travel demand models for motor vehicles and transit, bicycle travel demand models are virtually non-existent. However, a recently developed analytical tool, the Latent Demand Score (LDS) Model, can help planners to quantitatively evaluate bicycle travel demand on a systemwide basis. The LDS Model measures the relative amount of bicycle travel that would occur on a road segment if there were no bicycle travel impedances. It employs a simplified, probabilistic gravity model technique to quantify the proximity and magnitude of bicycle trip attractors and/or generators. Applied on a segment-by-segment basis and in conjunction with a bicycle Level of Service (LOS) analysis, the LDS model can provide a clear, reasonable, and relatively low-cost method of determining which roads are the best candidates for bicycle facility improvements. And until significant federal funding for the development and calibration of a bicycle travel demand forecasting model is mad available, the LDS Model will be the model of choice for cutting-edge bicycle transportation planners. The following sections outline the LDS Model technique.
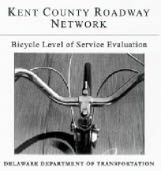
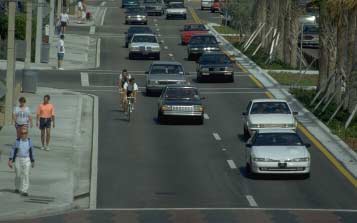
Streets and roadways can be analyzed to determine the relative level of
service they provide to bicyclists.
Technical Review: The Latent Demand Score (LDS) Model
The LDS Model was developed to provide transportation planners with the
ability to quantify latent bicycle travel demand. The LDS Model differs from
the classic four-step highway travel demand model in the following way: where
the highway's gravity model requires extensive network coding and algorithms
to simulate travel between its trip generators and attractors, the LDS Model
quickly estimates the probability of bicycle travel on individual road or street
segments based upon their proximity, frequency, and magnitude of adjacent bicycle
trip generators and/or attractors. The LDS Model uses many parameters similar
to those in the highway model. The steps of the LDS Model are:
The LDS Model uses readily available demographic data, employing simplified geocoding and data input for spreadsheet-based gravity computations. It is important to note that the LDS Model estimates the relative latent demand of bicycle travel on each segment of a road network. It provides a clear indication of the relative level of desired bicycle use should a bicycle facility be provided on the road segment.
Case Study: Application of the LDS Model in Birmingham, Alabama
In Birmingham, Alabama the LDS Model was used as one component of a comprehensive
Bicycle, Pedestrian and Greenway Plan for a large two-county region. The plan
was funded with Congestion Mitigation and Air Quality (CMAQ) funds and serves
as part of the MPO's Long Range Transportation Plan. The project was conducted
by the Birmingham Regional Planning Commission (BRPC).
One important task for this project was to prioritize facility development. The planning process included a Route Planning Charette for local planners, engineers, citizens and elected officials that resulted in a "ultimate needs list" of on-road and off-road corridors for bicycle and pedestrian facility development. The needs list, which included more than 900 different corridor segments, was further refined through a needs assessment, as defined in the steps below:
Step 1: Assess the Current Level of Service
During the first step, a bicycle level of service (BLOS) analysis was computed
for the on-road route system identified in the Route Planning Charettee. The
BLOS model, based upon the Interaction Hazard Score of IHS Model (Landis, Transportation Research Record1438) quantified the bicyclists'
perception of hazard level of interacting with motor vehicles. The resulting
BLOS score was scaled into categories A, B, C, D, E, or F, with "A"
representing the best conditions and "F" representing the worst conditions.
Step 2: Estimate Latent Demand
The LDS Model, as described above, was used to measure potential bicycle
travel activity for each onroad and off-road segment. For the Birmingham Area
plan, latent demand was estimated for four trip types:
An impedance variable was added to the model to account for the effect of grade on travel demand, because steep hills are commonplace throughout the region. In addition, the LDS Model's distance impedances were stratified to account for the different average trip distances in rural versus suburban and urban areas.
Step 3: Compute Analytical-Based Priority
By combing the results of the BLOS and LDS Models, an analytical score was
produced for each segment of the proposed route system. A road segment with
poor bicycling conditions, but a high latent demand ranked higher on the priority
list than a road with a similar level of demand, but relatively good conditions
for bicycling. Off-road future segments were ranked only with the latent demand.
Step 4: Measure Public Priority
During two public meetings held in January 1996, participants were asked
to identify the routes that they felt should have the top priority. The attendees
were given five votes each (more than 150 citizens participated in this process).
The results were tallied and public priorities for the route system were established

n = bicycle trip purpose (e.g., work, personal/business, recreation, school)
TTS = trip purpose share of all bicycle trips
GA = number of generators or attractors per trip purpose
TG = average trip generation of attractor or generator
P = effect of travel distance on trip interchange, expressed as a probability
ga = number of generators or attractors within specified travel distance range
d = travel distance range from generator or attractor
Form of Latent Demand Score Model equation.
Step 5: Compute Final Needs Ranking
The final needs ranking for the proposed route system was computed as a
combination of the analytical score and public priority. The results of the
final needs ranking were divided into three Needs Levels: A, B, and C, and stratified
by jurisdiction.
Step 6: Designation of the Short-Term and Long-Term Route Plans
The Long-Range Route Plan is composed primarily of routes that were scored
as Level A on the final needs assessment. Level B and Level C routes are included
on this plan as needed to form necessary regional connections. The Short-Range
Plan includes routes that are deemed critical for immediate improvement and/or
areas already planned for improvement (thus making bicycle/pedestrian facility
development less expensive).
As a regional plan, funding and construction for routes identified on the Short- and Long-Range Plans will require partnerships between local governments and the Birmingham Regional Planning Commission. This MPO is committed to allocating a portion of the region's Surface Transportation Funds (above and beyond Enhancement Funds) for bicycle and pedestrian facility construction and programs. While each route on the route plan is eligible for funding, a high level of competition among local governments is expected in the years to come.
Oregon Coast Bike Route
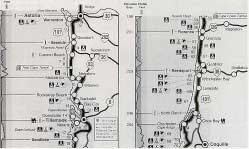
Oregon Coast Bike Route map provides a clear and easily read map for all
users.
Together, the Latent Demand Score and Bicycle Level of Service Models are effective bicycle system planning and roadway facilities prioritization tools that:
Numerous metropolitan areas throughout the United States are using these models to successfully develop their bikeway network in today's challenging planning environment. (Pro-Bike/Pro-Walk 1996 Conference Proceedings, Article #70, "Using the Latent Demand Score Model to Estimate Use")
Consistency in bicycle maps enables users to readily understand symbols and
colors when they visit a new area. A system of unified codes and symbols is
also useful to planners, designers, and engineers.
There are four basic types of bicycle maps:
The first three types are used mainly by bicycle riders; the fourth is used by a wide variety of interested parties.
Used primarily by local utilitarian bicyclists, newcomers, and visitors, this type of map is intended to help cyclists choose routes they feel comfortable bicycling on, and to encourage first-time riders to make certain trips by bicycle.
All streets should be shown. A simple color code indicates the presence and type of bicycle facilities. It also warns bicyclists of roads they should use with caution. The accompanying text should provide information on the proper use of bikeways, traffic laws, and safety tips.
Other useful information includes enlargements of difficult intersections, steep hills, weather data, parking facilities, bike shops, important destinations, and landmarks, etc. However, too much detail creates a cluttered effect; simplicity makes it easier to find needed information.
CODE:
Blue Bike Lanes
Purple Multi-Use Paths
Red Caution Areas
Black Local Streets (shared roadways)
The intended audience is recreational and touring riders interested in medium- to long-distance trips. The major concerns when choosing a route are traffic volume and roadway conditions. Color coding indicates bicycle level of service; a solid line indicates the presence of shoulders wide enough for bicycle travel.
The map should include State highways and county roads. The level of detail is less than that on an urban map. Other information to be included are distances, grades, weather data (especially prevailing wind directions), and camping facilities. Text should be used for information on local history, landmarks, viewpoints, etc.
Description of loop tours is useful to riders planning day trips. Local bicyclists should ride the loops in order to assess conditions. A written description of the route listing landmarks and turns is helpful.
Since bicycle trips often cross jurisdictional boundaries, counties are encouraged to coordinate regional maps, covering a natural geographical area within easy reach of several population centers.
Shoulders:
Black lines indicate shoulders 1.2 meters (4 feet) or wider on both sides
of the roadway.
Grades:
1 Chevron 2-4% grade
2 Chevrons 4-6% grade
3 Chevrons Greater than 6% grade
The intended audience is bicyclists on an extended tour. The format can be fold-out maps, strip maps, or brochures. Various agencies can cooperate to produce maps for long-distance bicycle tours that traverse several jurisdictions.
If a loop or one-way tour is best when bicycled in one direction only, this should be emphasized in the text (for example, it is best to ride the Oregon Coast Bike Route from north to south, to take advantage of prevailing winds).
Points of interest are important, as are distances, grades, campgrounds, availability of water, and details about different areas. A written description of the route listing landmarks and turns is useful, as well as an elevation profile.
Good maps are clear and simple, as too many symbols and details create confusion. Only needed information should be included:
It is usually better to create a new map. If available graphics capabilities
don't allow this, existing maps can be used by adding and deleting information.
Other important considerations are:
AASHTO, Guide for the Development of Bicycle Facilities, 1999.
Bicycle Federation of America, Pro-Bike/Pro-Walk Resource Book (1996 Conference Procedings), Article #70, "Using the Latent Demand Score Model to Estimate Use," 1996.
Birmingham Regional Planning Commission, Birmingham Area Bicycle, Pedestrian and Greenway Plan – Final Report, 1996.
City of Philadelphia, Bicycle Facility Design Standards, 1998.
Drake and Burden, Pedestrian and Bicyclist Safety and Accommodation Participant Workbook, NHI Course #38061, FHWA-HI-96-028, 1996.
Bruce W. Landis, "Bicycle System Performance Measures: The Interaction Hazard and Latent Demand Score Models," ITE Journal, Vol. 66, No. 2, pp. 18-26.
| < Previous | Table of Content | Next > |