U.S. Department of Transportation
Federal Highway Administration
1200 New Jersey Avenue, SE
Washington, DC 20590
202-366-4000
Section 1113(b) of the FAST Act requires the Secretary of Transportation to conduct a review of best practices with respect to roadway safety infrastructure improvements that are cost-effective and reduce the number and severity of crashes involving CMVs. Section 1113(b) states:
(b) COMMERCIAL MOTER VEHICLE SAFETY BEST PRACTICES.
(1) REVIEW.—The Secretary shall conduct a review of best practices with respect to the implementation of roadway safety infrastructure improvements that—
(A) are cost effective; and
(B) reduce the number or severity of accidents involving commercial motor vehicles.
(2) CONSULTATION.—In conducting the review under paragraph (1), the Secretary shall consult with State transportation departments and units of local government.
(3) REPORT.—Not later than 1 year after the date of enactment of this Act, the Secretary shall submit to the Committee on Transportation and Infrastructure of the House of Representatives and the Committee on Environment and Public Works of the Senate a report describing the results of the review conducted under paragraph (1).
This report provides a description of noteworthy practices that the review determined to be effective, lists the comparative cost-effectiveness along with their expected influence on reducing the number and severity of crashes involving these heavy vehicles. Most State departments of transportation (State DOT) have already adopted a variety of strategies and safety treatments to reduce the number and severity of CMV-involved crashes and their associated costs. Twenty-nine States have at least one emphasis area in their SHSP that is related to heavy vehicles or CMVs.
The FHWA and State and local agencies that plan, design, build, maintain, and operate the Nation's network of roadways realize that moving toward zero deaths and serious injuries requires a data-driven focus. Infrastructure improvements need to be made at both the system level and for specific locations where crashes are concentrated. This applies both in the broad sense and when focusing on specific crash types such as those involving CMVs. The infrastructure is vast and diverse, and safety issues exist both in high-speed free-flowing conditions and in places and times where the network is congested.
The review documented in this report includes a review of the literature and consultation with State transportation practitioners regarding their experience related to CMV safety. Reviewers considered the entire spectrum of safety measures including those specifically used for CMVs, which tend to be much larger and operate differently than the rest of the fleet, as well as those aimed at the larger mix of vehicles. Each type of improvement may have either wide application or specific, targeted uses. Since the infrastructure includes not just roads and bridges, but also the roadside environment and devices and equipment that play a significant role in communicating with drivers and their vehicles, the safety improvements and practices described in this report cover this wide range of topics. The review also recognized that to achieve a zero deaths goal requires embracing the role of enforcement, education, and emergency medical services along with engineering, and therefore includes discussion of infrastructure components related to enforcing safety regulations.
Before detailing the roadway safety infrastructure improvements found in the review to reduce CMV-involved crashes, this first chapter provides the context for how improved CMV safety could contribute to the economic vitality of the United States.
The national Federal highway program safety performance goal established by Congress in 23 USC 150 seeks to achieve a significant reduction in traffic fatalities and serious injuries on all public roads. In addition, the National Multimodal Freight Policy set by Congress in 49 U.S.C. 70101 establishes 10 goals, including two directly associated with safety. It seeks to expand the effectiveness, safety, and resilience of a national multimodal freight network that supports the economic competitiveness of the United States. The safety of that freight network and the use of technology to improve its safety are expected to contribute to the economic vitality of the nation.
As a measure of the connection of the national freight network to the economy, total business logistics transportation costs represented almost 5 percent of the nominal gross domestic product of the United States in 2015, according to the Council of Supply Chain Management Professionals.(6) Motor carriers (trucks) accounted for 65 percent of that total business logistics transportation cost—almost 11 million registered large trucks (single unit and tractor-trailer combinations). Trucks not only represent the majority of business logistics transportation spending, but they also account for the majority of freight shipments nationwide—69.6 percent of U.S. freight shipments by tonnage and 63.3 percent of shipments by value.(7)
National crash data cannot accurately track crashes involving CMVs. Therefore, the data reported include the best estimates available, which are based on large trucks and in some cases also buses. A large truck is defined as a truck with a gross vehicle weight rating greater than 10,000 pounds. A bus is defined as any motor vehicle designed primarily to transport nine or more persons.
Large trucks and buses accounted for 4,337 traffic deaths in 2015 according to recently released data in NHTSA's FARS. That is 12 percent of all traffic fatalities in the United States. Due to the extreme weight differences between larger and smaller vehicles, crashes involving CMVs often result in fatalities. In the 40 years data for crashes involving large trucks have been reported, only 16 percent of those fatalities (on average) were occupants of the large truck, a trend that continues over the most recent decade.(4) Similarly, the recently released FARS data indicates 716 of those killed in crashes involving large trucks and buses in 2015 were occupants of the large vehicle, the remainder being occupants of smaller vehicles or pedestrians. The NHTSA reports a 4.1 percent increase in fatal crashes involving large trucks from 2014 to 2015, although the total fatality rate increased 7.2 percent in that same timeframe.(2) Fatal truck crashes also have a significant economic cost estimated to be more than $20 billion each year. The cost associated with the loss of quality of life due to these crashes is approximately $13.1 billion each year.(3)
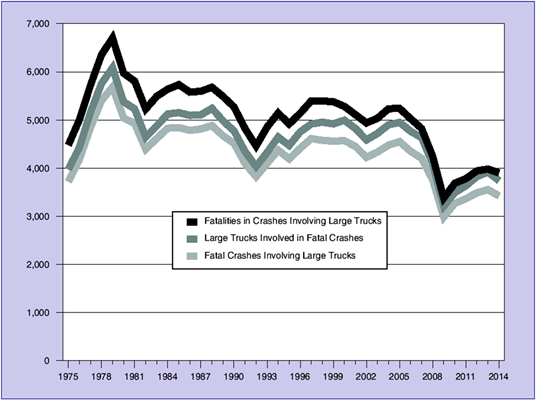
However, large truck safety has improved in the last 30 to 40 years, both in absolute and relative terms. The overall trends in large truck crash fatalities are shown in figure 1. While the crashes and fatalities fluctuate with traffic volumes, the trend line clearly indicates an overall downward movement. Considering 5-year averages to smooth out the trend line, the highest fatalities averaged just over 6,000 per year around 1980 and have averaged around 3,900 in recent years, representing approximately a 35 percent reduction.(4)
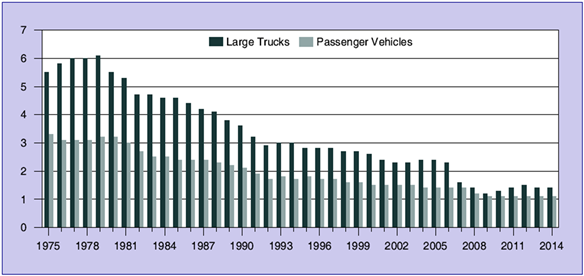
Passenger vehicles are more numerous than large trucks in terms of registered vehicles (240 million compared to 11 million, respectively) and in terms of vehicle miles traveled (VMT) (2.7 trillion compared to 279.1 billion, respectively). But large trucks travel more miles per vehicle than passenger vehicles (65,897 miles per combination truck, 13,123 miles per single-unit truck, and 11,287 miles per passenger vehicle).(5) Passenger vehicle and large truck crashes can be compared by considering the relative crash rates; figure 2 shows the rates for crash fatalities for passenger vehicles and large trucks over time.
Source: FMCSA.Large Truck and
Bus Crash Facts 2014.(4)
Figure 1.
Graph. Trend line for fatal crashes involving large trucks, 1975–2014.
Source: FMCSA. Large Truck and Bus Crash Facts 2014.(4)
Figure 2.
Graph. Fatalities in Crashes Involving Large Trucks and Passenger Vehicles per
100 million Vehicle Miles Traveled by Vehicle Type, 1975–2014.
At the peak levels of large truck crashes, the fatality rate for large truck crashes was almost double the rate for passenger vehicles (a rate of 6.15 fatalities in large truck crashes per 100 million VMT by large trucks compared to 3.22 fatalities in passenger vehicle crashes per 100 million VMT by passenger vehicles). In recent years, these fatality rates have been much closer. The lowest rate for large trucks was 1.17 in 2009, although that has continued to fluctuate, resulting in a rate of 1.40 in 2014 when the passenger vehicle fatality rate was at a low of 1.05.(4) This represents a measure of success for transportation safety professionals.
A variety of factors in large truck fatal crashes compared to all motor vehicle crashes and VMT in 2014 reveal considerations that may impact the effectiveness of crash countermeasures:
A large number of safety infrastructure treatments and practices were reviewed to determine those best suited to reducing the number and severity of crashes involving CMVs. In this report, the infrastructure is considered to extend beyond the roadway itself to include shoulders, slopes, and roadside appurtenances. This report presents information on CMV safety improvements and practices in three categories in the following chapters:
The final chapter identifies gaps in the current crash countermeasures, and describes changing conditions and technologies that might affect CMV traffic levels, safety risks, and mitigations against those risks.
Informed by the literature review and in consultation with a team of practitioners, this report addresses the documentation of the "cost effectiveness and expected influence on reducing the number and severity of crashes" involving these heavy vehicles, as required in section 1113 of the FAST Act. However, the effectiveness varies significantly depending on the location where it is applied, and costs can also vary somewhat. The CMV safety measures are described in chapters two, three, and four, and the report includes an assessment of the overall safety effectiveness of each countermeasure using the three-part readiness criteria similar to that outlined in National Cooperative Highway Research Program (NCHRP) Report 500: Guidance for Implementation of the AASHTO Strategic Highway Safety Plan, Volume 13: A Guide for Reducing Collisions Involving Heavy Trucks. The three-part readiness criteria are:
These criteria identify the extent to which the countermeasures are being used and have been demonstrated and evaluated to be effective. The report also summarizes a general assessment of the costs of implementing the treatment in order to address the requirement for cost-effectiveness evaluation. This cost assessment is relative among the practices presented, using a five-part scale—high, moderate to high, moderate, low to moderate, and low cost.
| << Previous | Table of Contents | Next >> |

