U.S. Department of Transportation
Federal Highway Administration
1200 New Jersey Avenue, SE
Washington, DC 20590
202-366-4000
The HRRR safety treatments summarized in this manual can be systematically considered; however, only a subset of the large number of candidate treatments can potentially help to reduce crashes for a given location.
One approach for selecting safety enhancements is to identify study sites, perform a descriptive statistical safety diagnosis, execute a treatment analysis, evaluate economic feasibility, and prioritize and select promising improvements suitable for consideration. The contents of this manual can be used to perform this type of assessment. The following sections briefly review each of these key steps that will enable the selection of potential safety enhancements for a study location.
The safety treatments summarized in this manual are specifically targeted for HRRR locations and assumed to apply to two-lane highways with varying traffic volume and road characteristics. Prior to initiating the safety assessment, practitioners should identify the specific sites or site types for which the analysis will be applied. In many cases, the study may focus only on an intersection while in other cases the analysis could be targeted to a corridor or a systemic modification. Consequently, it is important in this first step to clearly identify where the analysis will apply and why this location has been selected for consideration. Figure 1 (Flowchart A) introduces an overall approach to this safety enhancement analysis. Once the study location and focus has been established, the next step is to perform a preliminary safety diagnosis. For discussion related to spot versus systemic treatment application, see Chapter 3.2.
Figure 1. Flowchart A – HRRR Safety Enhancement Analysis
![Flow diagram describes the steps in an HRRR Safety Enhancement Analysis as follows: 1. identify characteristics for candidate two-lane high risk rural road; 2. perform safety diagnosis [see flowchart b]; 3. Ask if the facility is low volume (<1000 vpd). If the answer is yes, initiate the low volume (<1000 vpd) HRRR evaluation, then perform a treatment analysis [see flowchart c], assemble findings, and compile recommendations. If the answer is no, initiate the standard (1000<AADT<8000 vpd) HRRR evaluation prior to performing treatment analysis [see flowchart c] and then assembling findings and compile recommendations.](images/f1.png)
The steps for the initial safety diagnosis are depicted in Figure 2 (Flowchart B). The user should develop a series of descriptive statistics regarding safety at the study location(s). In an effort to provide a statistically robust evaluation, crash data that extends across a period of 3-5 years should be used for these summaries. Crash data should be compiled so that a summary of crash frequencies per year for total crashes as well as fatal and injury only crashes can be used in subsequent analysis. In addition, crash information should be summarized by crash types. This crash type information will be used as a key diagnostic input in subsequent tasks.
Figure 2. Flowchart B – Safety Diagnosis
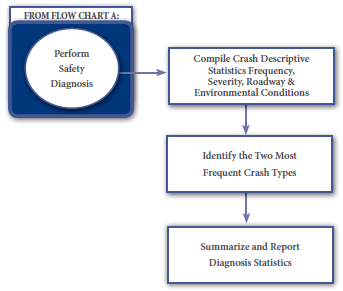
The crash types should be divided into the following general categories and proportional values should be assigned based on total crashes or fatal plus injury crashes (depending on the objective of the safety enhancement effort):
Following the development of the crash type summary for the study site, the user should identify the two or more most common crash types that occurred for the severity type targeted for reduction. If the intent is to reduce the number of fatal plus serious injury crashes, then the two or more crash types most often involved in that subset of crashes should be identified. If, on the other hand, the intent is to reduce total crashes or crashes of a specific nature, then the two most significant crash types for this group of crashes should be selected.
During the safety diagnosis step, the user should also compile information that may be contributing to the crash condition. This would include physical road features and traffic volume. In addition, unusual features identified by examining the crash history may be noted. These could include an unexpected number of crashes at dawn or dusk, inclement weather crashes, or similar.
It may be likely that the preliminary improvement selection criteria are availability of funding, either for the initial installation or for ongoing maintenance. Additionally, the economic feasibility of a specific treatment is strongly influenced by traffic exposure at a location. Consequently, the treatments provided in this manual are further divided into lower volume (assumed to be represented by AADT=1000 vpd) and higher volume (assumed to be represented by AADT=8000 vpd) treatments. In general, the lower volume locations are also characterized by relaxed design standards such as narrower lanes and shoulders. As a result, prior to initiating the treatment analysis the user needs to clearly define which traffic volume threshold best applies to the study location. As shown in Figure 1 (Flowchart A), facilities with more than 1000 vpd are considered "Standard" or higher volume and evaluated separately from their lower volume counterparts. Figure 3 (Flowchart C) demonstrates the treatment analysis steps that can be applied to either traffic volume threshold.
Figure 3. Flowchart C – Treatment Analysis
![This diagram describes the steps following Flowchart B and involves using Flow Chart A results, as follows: 1. Select the type of facility (intersection versus segment); 2. Identify the target crash severity level to reduce at this site (crash type identify in safety diagnosis); 3. Select nature of proposed improvement (systemic, single location); 4. Perform economic analysis [see Flowchart D]; 5. Summarize safety analysis results.](images/f3.png)
Each facility should be divided into a category of intersection or segment. For locations that include entire corridors or systemic improvements, the characteristics of the prevailing targeted crash types will help determine the facility type of interest. This manual includes the following 10 general categories for the potential safety treatments:
In many cases, an individual treatment can be included in more than one of these 10 categories. As an example, installing advanced intersection warning signs would be included in both the intersection category as well as the signing category. Within each category, the treatments tend to be further reduced into infrastructure-based treatments, traffic control treatments, and other enhancements.
Based on the two most significant crash types previously identified in the safety diagnosis, potential treatments can be identified; however, before the treatment analysis can be completed, the user should also consider the economic feasibility of a treatment for the specific study location. For example, one possible improvement that may be identified is widening a shoulder. If the study site already has a shoulder that is reasonably wide, this candidate treatment may not be practical if a different treatment can more substantially help to reduce crashes resulting in a more economically justified treatment selection. Therefore, the final step in the treatment analysis is to initiate the economic assessment for the subset of treatments identified.
The benefit-cost ratio is one common method for evaluating the economic feasibility of a treatment. In addition, issues such as substantial initial investments, short life cycles, and extensive treatment maintenance must be considered to determine practical application of a treatment. The benefit-cost ratio is a numeric value that helps to capture these influences. A benefit-cost ratio value of 2.0, for example, suggests that there would be a $2 return for every $1 invested. For more information on how to calculate a benefit-cost ratio, see FHWA's Benefit-Cost Analyses Guidance for TIGER Grant Applicants.52
In addition to the benefit-cost ratio are other potential economic metrics. Two of these candidate cost-effectiveness values in the user guide include the equivalent annual dollars spent for fatal plus injury crashes prevented and the net annual benefit. This manual includes these economic values for each of the candidate treatments.
Of course, many safety enhancement projects are constrained by targeted funds that must be used for specific purposes or that are systemic rather than site specific. Figure 4 (Flowchart D) summarizes the basic steps required to perform the economic analysis component of the treatment selection process.
Figure 4. Flowchart D – Economic Analysis
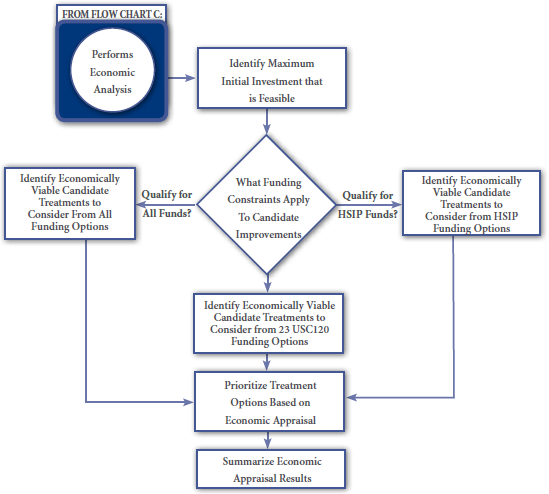
In many cases, a maximum initial investment can be a driving force in the selection of feasible treatments. The practitioner should first identify this maximum value and determine if there are any funding constraints associated with the available resources or candidate improvements. Once these economic analysis questions are answered, the practitioner can then evaluate the previously identified list of potential treatments and determine their associated economic assessment values. This information can then be used to develop a list of priorities.
Many agencies will restrict the economic analysis priority selection to a specific economic metric, so the practitioner will need to identify if this constraint applies. As an example, some agencies solely use the benefit-cost ratio for final economic decisions.
Following these safety enhancement analysis steps, the user should have a short, prioritized list of candidate safety treatments. It is important to note that the intent of this HRRR safety analysis is to identify potential safety enhancements for additional consideration. Consequently, transportation agencies would then use this information as one key input into a final safety project study. Additional issues that should be considered and that are not captured as part of this analysis include, but are not limited to, potential impacts to the roadway capacity, air quality, contextually sensitive characteristics, local or regional construction preferences, and local driving laws and regulations. A final engineering study is necessary to capture these broader issues associated with a specific improvement project.
52 FHWA's Benefit-Cost Analyses Guidance for TIGER Grant Applicants. Available at: http://www.dot.gov/tiger/guidance. [ Return to note 52. ]

