U.S. Department of Transportation
Federal Highway Administration
1200 New Jersey Avenue, SE
Washington, DC 20590
202-366-4000
A complete, consistent, and comprehensive data collection process is necessary to assess potential safety issues on all roadways in the State. Successful States maintain a statewide inventory of crash, roadway and traffic characteristics to locate and evaluate a comprehensive program of potential spot and systemic safety projects. A quantitative project prioritization process enables the selection of HSIP projects that provide the greatest opportunity for reducing fatalities and serious injuries.
Several States gave presentations on their crash data collection systems and crash data analysis tools.
SPOTLIGHT ON SAFETY:
Accessing and Analyzing Crash Data in Illinois
The Illinois DOT (IDOT) provides easy access to crash data through the Safety Portal, a web-based tool that provides access to data related to safety on Illinois roads. Among its tools is Crash Manager, which provides a comprehensive searching function for all Illinois motor vehicle Traffic Crash Reports submitted to IDOT. Every crash report that has been submitted to IDOT in the last 10 years (IDOT's record retention policy for non-fatal crashes) can be retrieved using this utility. This includes crash reports submitted on paper, through IDOT's current Mobile Capture Reporting (MCR) system, and also through a third party XML vendor. The Crash Manager utility also allows for searching crash reports that were just received, no matter how they were received. Items recently scanned from paper reports can be retrieved, but the amount of information available to search for them is considerably less than the reports that are received electronically through MCR or third party XML vendors. Crashes can be mapped if they have location information. Figure 5 shows an example crash map, the different colored dots indicate different years. Figure 6 shows the information that appears when zooming in on a crash location.
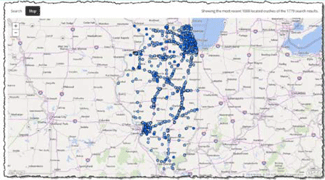
Figure 5. Example crash map from IDOT crash manager. (11)
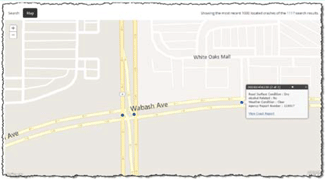
Figure 6. More detailed crash map information from IDOT crash manager. (11)
IDOT utilizes GIS and its SafetyData Mart to perform more detailed safety analysis. This is done in addition to IDOT's annual statewide analysis to calculate the Potential for Safety improvement (PSI) for State route intersections and segments and assign each roadway segment and intersection to a safety tier in IDOT's Safer Roads Index (SRI). IDOT has used a weighting system for fatalities and serious injuries to develop a local roads 5% List which aids local agencies in identifying local roadways with higher potential for safety improvement and applying for local HSIP funding. In addition, the statewide analysis has been used to identify locations to address specific trends, i.e. curves, roadway departure (rumblestrip prioritization maps), pedestrian safety corridors, etc.
In North Carolina, the majority of crash reports are available within one week. State and local law enforcement agencies send reports to the North Carolina Department of Motor Vehicles (DMV), submitting 70 percent of crash reports electronically. The DMV owns the data and most of the electronically submitted crash reports are fully available within five days, with the lag on roughly 30 percent paper reports being typically less than four weeks in duration. The four week lag on crash reports submitted on paper is primarily due to them being submitted via mail and then entered manually into the data system.
The North Carolina DOT has comprehensive access to the DMV crash data system. Because the DMV is part of NCDOT, traffic engineering staff work closely with DMV staff to understand the data and its use.
NCDOT has comprehensive access to the DMV system, including the ability to view images of crash reports with the crash diagram and narrative. Data is geo-coded using an automated process based on mileposts, but there is no dedicated staff for the 30 percent of reports that are not on the State-mile post system or that cannot milepost via automated processes. Because the DMV is part of the NCDOT, the traffic engineering staff are able to work closely with DMV staff to help foster an understanding of the data and its use, particularly with regard to data compliance and validity concerns, essentially offering technical assistance in return for DMV custodianship of the data.
In Massachusetts, safety performance evaluation efforts are primarily based on the use of crash data obtained from police reporting of the roughly 125,000 statewide annual crashes. Massachusetts requires by statute the use of a common form and roughly two-thirds of all police reports are submitted electronically. The MassDOT Division of Highway and Registry of Motor Vehicles (RMV) is responsible for entering crash data, but is not staffed with analysts. MassDOT's Traffic Safety Section's Crash Data unit performs attempted geo-coding of all crash data obtained from RMV and also conducts quality control on crash data, examining the information for anomalies in coding and geographic disparities.
The Massachusetts DOT attempts to geo-code all crash data and conducts quality control on crash data. MassDOT also has the ability to query citation data and uses that data to understand where behavioral issues are occurring and what countermeasures and public outreach campaigns can help correct those issues.
Massachusetts also maintains hospitalization data and is undertaking a project to link that data with the crash dataset. This project will address MassDOT's identified shortcomings of the Crash Outcome Data Evaluation System.
In addition to accessing crash reports, MassDOT also has the ability to query citation data, but citations and crash information are not linked with any guarantee of quality, so the citation query is performed independently of the crash information. Citation data has been particularly useful to MassDOT as they attempt to understand where behavioral issues are occurring and what countermeasures and public outreach campaigns would be most useful in correcting those behavioral issues.
In Utah, the DPS developed the statewide crash database, which receives electronic input from all of Utah's police agencies whenever a crash report is submitted. The Utah Highway Patrol began submitting electronic reports in 2003 and other agencies were required to participate in the program by 2012. State statute requires the electronic submittal of crash reports within 10 days of the incident.
Utah's statewide crash database receives electronic input from all Utah police agencies whenever they submit a crash report.
Alaska statute requires electronic transmission of crash reports, but the format is unspecified. Recent changes to the crash report itself include fields compliant with the Model Minimum Uniform Crash Criteria, some being additional fields that are often ignored by law enforcement. Changes in the police reporting form have resulted in an increase in civilian reporting on account of the complexity in the police form requiring additional officer time for completion.
Alaska and Utah see value in a tiered crash reporting system to reduce complexity of crash reporting and obtain additional details about higher-order crashes.
In lieu of simplifying the reporting categories and losing valuable data, the DOT&PF is studying the use of a tiered reporting system, where higher-order crashes would trigger the input of additional details, up to and including all available data fields.
Like Alaska, UDOT is currently undertaking development of a tiered reporting system to encourage additional data collection from higher-order crashes. The University of Utah is under contract to develop interfaces for the statewide crash database in addition to researching and developing the database architecture. The interfaces with the crash data system allow for access by discrete users and integration with UDOT GIS systems for display and access from other tools.
The Alaska DOT&PF contracted with the University of Alabama in the development of the Alaska eCrash system, called CRASH/Alaska CARE, in order to improve the accessibility of crash data. It is anticipated that this new system will use the conventional traffic records coding for severity in crash data. This system will provide a portal with access to the latest crash data with powerful analysis tools that will aid in network screening and crash data management, supporting repeatable network screening processes. Recent changes in reporting requirements have necessitated the Municipality of Anchorage to convert prior data to the fields in the new crash reporting architecture and DOT&PF is exploring how the eCrash system can be used to reduce the municipal burden in data collection and data management. Under the eCrash development contract, the DOT&PF is obtaining data entry services for the non-electronically-transmitted crash records, aiding in reducing the data entry backlog. While the system will be available only to DOT&PF employees and potentially to the Municipality of Anchorage, outputs from the system, including those that demonstrate monitoring of progress in the SHSP emphasis areas, will be made available to the public.
CRASH/Alaska CARE will provide a portal with access to the latest crash data and will include powerful analysis tools to aid in network screening.
The MassDOT Crash Analysis Tool produces a clustered crash map using GIS tools and the geo-coded crash system. The crash clusters use a search radius of 25 m from adjacent crashes and a search radius of 100 m for bicycle and pedestrian crashes, which are clustered separately. MassDOT developed the mapping tool in-house using contractor assistance and updates the Tool annually based on crash data collected in the prior calendar year. Over the last three years, roughly 94 percent of crashes have been geo-coded on average statewide, with the remainder lacking sufficient information for accurate coding.
MassDOT's Crash Analysis Tool provides a clustered crash map, coded by crash type and normalized to EPDO values for screening projects. MassDOT uses this tool to generate the HSIP-eligible projects list.
The database of crashes for the Crash Analysis tool uses a chaining algorithm, creating a map of crashes that is coded by crash type, where possible, and normalized to Equivalent Property Damage Only (EPDO) values for the purposes of screening projects. This EPDO normalization is the basis of the candidate project selection system, as crashes and crash clusters are ranked to create the 5% List, the top five percent of all crashes (the list previously mandated by FHWA), ranked by EPDO for each MPO region within the State. MassDOT Planning staff, District staff, and MPOs all use ESRI software to examine crash clusters in the process of developing the scope of future improvements.
MassDOT generates the 5% List using the clustering process and considers this the HSIP-eligible project list. The Crash Analysis Tool enables a visual confirmation of HSIP eligibility. Users of the tool can see crash clusters and individual crashes, and identification of segments with poor safety performance is easily undertaken.
In addition to the Crash Analysis Tool, MassDOT also operates a Crash Portal, which permits data distribution of crash information.(12) This tool is available to the general public and is used by MPOs, in particular, as they work with local agencies to evaluate locations as potential HSIP candidate projects. MassDOT also maintains the Cross-Tabulation Analysis Tool, which was recently made externally accessible.
UDOT contracted with Numetric to provide a crash query and safety data investigation system. The system analyzes crashes in selected locations and along segments and suggests countermeasures based on CMFs for low-cost safety improvements. As with all Utah HSIP projects, CMFs are only applied to targeted crashes, producing conservative b/c ratios.
Utah's crash system analyzes crashes and suggested countermeasures for low cost safety improvements.
Each Host State used a documented process for system screening, project nomination, and project selection. Among all States, North Carolina, Illinois, and Alaska offered the highest degree of flexibility for project nomination and selection. Several Host States made extensive use of regional engineering staff in the process of scoping potential improvements. While all of these agencies have centralized the system screening process, the deployment of local resources in scope and contract plans development was seen as key to effective cost control and identification of projects appropriate for the system.
NCDOT uses a safety warrants system for project screening, prioritizing and selecting projects on the basis of b/c ratio and a safety index decision support tool. This warrant system is divided into three areas, those being Intersections, Highway Sections (non-freeway, freeway, and city-maintained), and Bicycle and Pedestrian sites. The Safety Warrants are updated on a routine basis using crash data analysis, part of the overall evaluation process in North Carolina.
NCDOT identified intersection warrants, using frequency, severity, and combinatory factors to justify investments. When the location meets the warrants it is categorized as potentially hazardous. The goal is to identify correctable locations, with Potentially Hazardous (PH) locations prioritized using weighting factors for frequency, severity, and percentage of target crashes. Weighting factors are summed for locations that meet multiple warrants.
The NCDOT GIS portal uses a sliding window application to assist in identifying segments. The GIS portal displays both intersection and segment locations, permitting a view of present-year and prior-year PH sites, a useful tool for evaluating changes over time. Analysts segregate freeway sections based on minimum total crash and minimum crash-per-mile values, while persons bicycling and persons walking crash locations must have a minimum of five crashes in a ten year period.
An annual Potentially Hazardous Listing report is created based on the Safety Warrant Screening process. The current report includes 1,819 intersections, 491 sections, and 127 bicycle/pedestrian locations. NCDOT believes that this report is a strong demonstration of their commitment to correcting traffic safety deficiencies, with project selection from the report occurring on a quarterly basis, one means of advancing an HSIP project in North Carolina. Because this network screening process is based on pattern recognition, NCDOT believes the generated list provides highest-value projects.
Following the identification of a PH site (site for investigation), HSIP staff research and conduct a detailed crash analysis using the Traffic Engineering Accident Analysis System– a North Carolina developed, web-based system for crash data access, analysis, and collision diagram data export capabilities. HSIP staff submit the findings from this investigation to the Field (Regional Traffic) Engineering staff for additional analysis, research, and engineering field investigations and assessments. Based on the evidence-driven findings, observational analysis, and professional recommendations of the Field Engineer, a location may require additional analysis. It may also yield countermeasure recommendations and initiate either project development, project recommendation for inclusion in other active project, or a more immediate maintenance action. In some cases, the Engineer will determine and recommend no further action or treatment.
The Transportation Mobility and Safety (M&S) Regional Traffic Engineering (RTE) professional staff investigation includes evaluation of traffic control devices and operations, driver factors, and regulatory factors in conjunction with the collision diagram and crash form narrative content. The RTE:
This is all done using the project development resources of the field engineering office. For all projects advanced to preliminary design, the RTE coordinates with the Division public hearings, designs review sessions and press releases, and facilitates the project planning process. Mobility and Safety's Field Engineers (RTE's) are all Professional Engineers, and all safety project packets require the seal of a Professional Engineer.
In Illinois, project identification may occur at the District level or at the Central Office. Typically Central Office driven projects focus on statewide systemic safety improvements, i.e., wrong way driving, curves, pedestrians, etc. The nomination of all HSIP projects in Illinois occurs through an electronic application process. Figure 7 depicts a portion of the application form. The Districts and local agencies complete the same project candidate forms and have use of all of the web-based analysis tools, including the crash data portal. Documentation and tools for the program include the Systemic Safety Manual, various spreadsheet-based evaluation tools including the Benefit/Cost Analysis Tool and HSM Crash Prediction Tool, and the HSIP Project Selection Process Flow Chart shown in Figure 8 and found in Appendix B of the IDOT HSIP Policy.(13) This allows for statewide tracking of HSIP projects, monitoring performance, and ease of annual reporting.
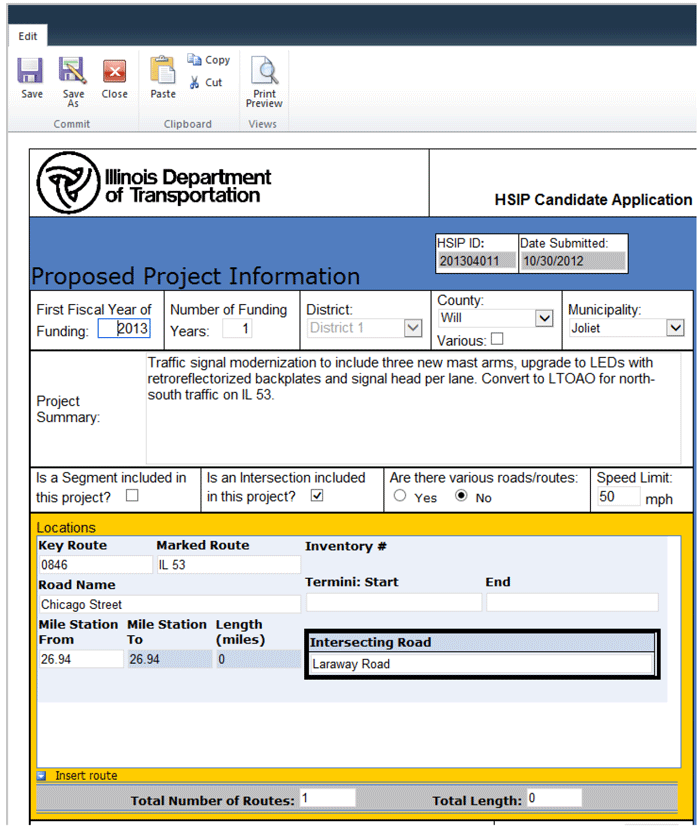
Figure 7. IDOT HSIP candidate application form.
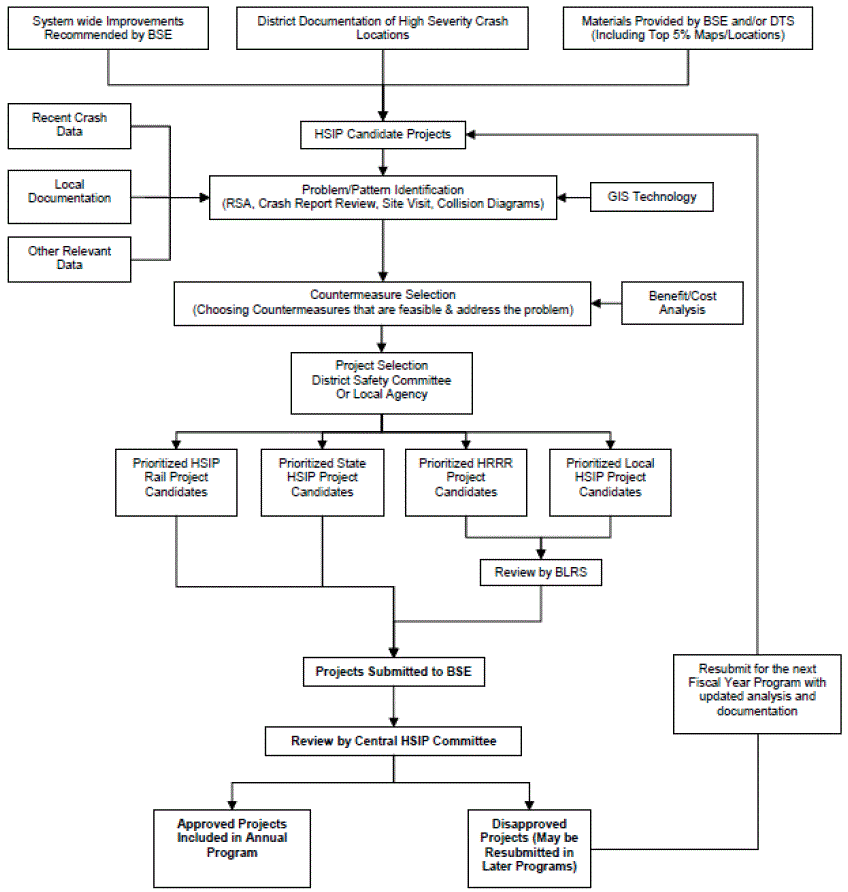
Figure 8. IDOT HSIP project selection process flow chart. (14)
Districts have access to an HSIP SharePoint site to submit projects throughout the year. IDOT solicits local agency projects on an annual basis and local agency officials submit candidate projects to the Districts. This is to allow the District staff to review the projects, ensure that the proposed location is not a State route and that the agency submitting the application is the roadway owner and has authority over the roadway itself, determine if the proposed project meets the criteria of HSIP and if the proposed scope of work is reasonable, and that either the supporting documentation is included or additional information is needed. The submission process for the Districts is open throughout the year, as previous submission deadlines were the cause of a large receipt of submissions in a very short period prior to the deadline.
In Illinois, all projects are subjected to the same criteria for evaluation by the Central Safety Committee. The Committee considers the following criteria:
The process of selecting HSIP projects includes submission, review, notification of approval/denial, planning and programming, Federal authorization, project design, letting and award, and, in parallel, HSIP funding.
Figure 9 depicts the Alaska DOT&PF project selection process. DOT&PF Traffic & Safety (T&S) performs an annual screening for all roads, using five years of crash data. This screening identifies the need and serves as the basis for new project nominations of spot and systemic improvements on the entire system, as the DOT&PF includes local roadway systems in the screening process, providing a solid basis for determining the ranking of projects based on correctable crashes. The Districts can use this information or other data-driven means to identify HSIP candidate projects.
Figure 9. Alaska HSIP project selection process.(15)
T&S prepares the generated list of projects from lists submitted by regional engineers. This results in a list of projects identified as "ranked," "non-ranked," and "systemic." Each regional traffic engineer nominates local projects based on the screening process. Local agencies can nominate a project with informal DOT&PF assistance in selecting the project limits, countermeasures, and computational metrics. Projects are prioritized for funding according to the HSIP Handbook. Ranked projects with the highest benefit-cost ratio are the first priority in funding, regardless of the lower benefit-cost projects or threshold.
The DOT&PF employs the recommendations of National Cooperative Highway Research Program (NCHRP) Special Report 214 Designing Safer Roads, using a formula from the Alaska HSIP Handbook to describe the methodology for computing the b/c ratio when employing multiple countermeasures. This approach handles the additive effects of multiple CMF applied to a spot improvement. Projects are considered "ranked" when they can be assigned a CMF and a calculated b/c ratio is available. The Ranked Projects are prioritized ahead of other projects based on the b/c ratio, while also considering history of fatal or serious injury crashes, deliverability, and project duration, as well as a cost factor. DOT&PF accepts projects with b/c less than 1 because a ratio of 0.2:1 can still eliminate crashes, and DOT&PF does not want to fail to obligate safety funding to any location where a crash reduction could occur based on the application of a safety countermeasure.
"Non-Ranked" projects are classified based on the absence of a CMF history of correctable crashes, which typically means that no b/c ratio can be computed. There are two categories of non-ranked projects, those with crashes at the location and lacking a CMF for the particular countermeasure and those without crashes at the location. This list exists primarily to allow safety engineering staff to apply engineering judgment in the development and recommendation of projects that have a high likelihood of reducing crashes, but may not have statistically-valid sample sets or are lacking other data necessary to complete the computational process. For example, there may be locations where barrier terminal end treatments are not compliant with NCHRP 350, yet are absent any record of crashes. However, speed and volume may demonstrate a high risk of severe crashes and engineering judgement would indicate that upgrading the end treatments would be an investment that, given any crash history, would have a high b/c ratio.
Non-ranked projects are prioritized among other projects based on history of fatal or serious injury crashes, deliverability, project duration, and a cost factor. Non-ranked projects require a narrative and, when a crash history exists, a sensitivity analysis to help evaluate project effectiveness. The sensitivity analysis is computed by performing two projected benefit-cost ratios assuming CRFs of 5 percent and 100 percent for historical crashes susceptible to correction. The minimum b/c ratio for ranked projects (those with a crash history and a known CRF for the countermeasure) is 0.2:1 in order to be considered eligible for funding. . Non-ranked project sensitivity analysis has been conducted since 2008, as DOT&PF staff wanted to avoid poorly-performing HSIP projects.
The NCDOT Spot Safety process uses a Safety Index Decision Support tool with the Safety Index comprising both Safety and Responsiveness indices. The Safety Index is weighted with 50 percent b/c, 10 percent severity, and 10 percent programmatic, with responsiveness being an aggregate measure of local priorities for 30 percent of the total weight. The programmatic weighting factor reflects the degree to which the project satisfies the objectives of the overall HSIP, such as concurrence with SHSP or addressing a targeted strategic need (or a recommendation for an HSIP or RSA Identified Improvement).
In North Carolina, spot improvement projects are identified using a Safety Index Decision Support Tool, which is comprised of both safety and responsiveness indices.
Several Host States employ a comprehensive program of spot and systemic improvements.
IDOT does not utilize a set proportion for allocation of spot and systemic improvements. By means of data collection and analysis and identification of trends, IDOT expects to balance systemic and spot improvements, recognizing that both types of improvements are necessary to achieve safety outcomes. The Central Office can provide information to the Districts through the two types of analysis, assisting the Districts in the development of a District-specific safety program that includes an appropriate proportion of systemic improvements. Most Districts typically have project-level focused projects, and the Central Office identifies and funds the majority of systemic projects.
IDOT does not utilize a set proportion for allocation of funding to spot and systemic improvements. Instead they expect to balance both types of improvements, recognizing that both are important to improving safety.
The Central Office develops and provides to all Districts the SRI and Safety Tier information (further described in Chapter 5), data trees, heat maps, and systemic safety analysis results of safety issues such as curves, pedestrians, and roadway departure (i.e., rumblestrip prioritization and wrong way driving). The Districts then use this information in conjunction with District knowledge (i.e., emerging trends or most recent high severe crash location) to identify their District safety needs and priorities, and ultimately their District safety program. In one District, staff first works to identify the safety performance information in the Planning and Programming System, using the SRI and Safety Tiers provided by BSE with emphasis on roadway departure, curve, and pedestrian crashes. That particular district weights safety improvements for project priority selection. In another District, they utilize the information provided by the Central Office to develop a safety analysis report, which includes data, reports, and a Safety Tier map with the 5% List included on the map. The District utilizes the District data tree to identify significant needs, using the Safety Committee to select projects based on this analysis. District 5 prefers to program typical spot improvements, such as friction surface courses, hot-mix asphalt shoulders, and systemic rumble strips. They apply CMFs to SPFs to predict crash frequency and they use crash maps to identify locations with critical PSIs. Applying this analysis in the project development process for all SMART, 3P, and 3R projects facilitates the inclusion of safety improvements in all projects, even those without an HSIP funding component. ("SMART" (Surface Maintenance at the Right Time) and "3P" are pavement preservation project categories within IDOT. Projects classified as "3R" are a resurfacing, rehabilitation, and restoration projects per the Federal-Aid Highway Act of 1976.) District 5 applies b/c ratios across all projects in project development, not limiting that analysis to HSIP projects alone. In District 1, the project implementation process for spot improvements includes location screening with the 5% List, data trees, emphasis tables, correlation with BSE initiatives, and district-sourced information such as the daily fatality report. The District studies each location for crash and roadway data, identifies crash types, and identifies countermeasures, with an emphasis on reducing severe crashes. In the data tree analysis, IDOT divides crashes into categories that can be further subdivided for an examination of crash types and circumstances that contribute the greatest to the overall crashes. The project selection criteria include the frequency of severe crashes, PSI values, crash trends, b/c ratios, and emphasis areas. The multi-disciplinary District Safety Committee (DSC) selects projects, assigns them to the project schedule, and submits an application for HSIP consideration. The DSC once again reviews any non-selected projects for HSIP. Some projects, including those rejected, could be implemented with internal forces when funding permits.
IDOT uses systemic improvements (those deployed on segments and at locations with specific characteristics) in a systematic way, that is, everywhere on the system. HSIP funds can also be used for engineering work for project development and implementation, but typically for engineering design services. Within IDOT, systemic improvements are one driver for policy changes, particularly in engineering design, because the success of systemic improvements demonstrates the validity of engineering countermeasures.
Each IDOT District can select emphasis areas for systemic improvements. For example, District 5 selected clear zones. IDOT District 4 selected flashing yellow arrows, offset left turns, and yielding behavior in medians. Additionally, systemic projects for curves addressed critical types of curves, based on all crash data. The District initially considered using a traditional "KABC" (fatality/injury total) analysis method but instead analyzed the curves using an approach that examines system safety performance based on roadway characteristics. District 3, based on further analysis of identified curves through statewide analysis, determined the existing superelevation was a contributing factor to severe crashes. They developed projects that provided superelevation correction called for by policy, added bituminous shoulders and high friction surface treatments, and installed delineation. In District 4, Peoria County acted as the lead agency for a multi-county chevron installation program for curves, an arrangement that reduced administrative and project delivery costs.
Districts 3 and 4 have developed a systemic safety detailed analysis process which uses an extended 5-year analysis period (from the 3-year period typical of IDOT analyses). First, they analyze the data using the Safety Portal web tool, downloading police reports with photographs to study crash locations. They compare the generated list to the BSE screening list, including local roads, and parity is typically found between KABCP crashes and using EPDO/weighted crash methods. Other agencies use GIS queries to identify locations based on characteristics such as rumble strips on shoulders and guardrail end treatments. The Districts gather existing conditions, with District 3 typically using summer work program employees. The project implementation process includes priority evaluation, field reviews, selection of countermeasures, calculation of b/c ratios, and construction of the improvements. Implementation of the systemic improvements is typically "district-wide" and follows a comparison of corridor-wide or systematic improvement expected outcomes, undertaken by the District Safety Committee. Implementing new strategies at a District level rather than a statewide level helps gain buy-in and get other Districts to implement the same types of strategies.
NCDOT funds the delivery of safety projects using two primary investment mechanisms, the Federally-funded HSIP (formerly referred to as Hazard Elimination) and the State funded "Spot Safety" program. The primary difference between the HSIP and Spot Safety programs in North Carolina is that the Spot Safety program projects are smaller scale /quicker implement type projects (maximum investment $400,000) funded primarily with State funds (but eligible to compete for HSIP funding). HSIP annual investments of $40 million contrast with Spot Safety annual investments of approximately $12 million, with Spot Safety projects subjected to the above mentioned project cap – although companion funding and leverage is encouraged. On average NCDOT Mobility and Safety Division invests between $10 and $12 million in safety funding (Federal + State) on a quarterly basis. Candidate HSIP projects in excess of $900,000 require specific advance approval of the State Traffic Engineer. Table 3 compares the HSIP and the Spot Safety Program.
NCDOT allocates 20 to 30 percent of their annual HSIP appropriation to systemic projects. They also use a State-funded Spot Safety program, in addition to HSIP funding, to fund smaller scale/quicker implementation types of projects. A decision support tool is used to prioritize and review the systemic and Spot projects.
Table 3. Comparison of NCDOT's HSIP and SPOT safety programs.
| HSIP | Spot Safety |
|---|---|
| Federal Funds & Rules | State Funded |
| $66 M Annually / $40 M Programmable for Safety | $13.1 M per Year |
| Projects above $1.0 M require advance justification and STE Authorization | $400K Cap per Project |
| Can be Combined with Other TIP Projects | Companion Funding Encouraged |
| Selected Quarterly | Selected Quarterly |
| Safety B/C Prioritization + Systemic Investments | Spot Safety Index Decision Support Tool |
| Advanced PE funds for Improved Surveys and better project estimates. | Vulnerable User and Administrative and Expedite Mechanisms when historical data may not reflect full safety circumstances or urgency of improvement. |
| Division-wide with Streamlined Programming | Intended for readily constructible projects – on the ground within 12 to 18 months of funding approval. |
Systemic projects and initiatives in North Carolina are funded using a dedicated portion of HSIP funding, currently estimated at approximately 20 to 30 percent of the State's annual appropriation. As with Spot Safety improvements delivered through HSIP and the Spot Safety program, North Carolina's goal is to obtain the highest return for each investment.
The Mobility & Safety Division and the Traffic Safety Unit are working toward a unified Safety Project selection and funding process that fully integrates HSIP and Spot Safety programs. Currently, a project selection committee comprised of NCDOT Headquarters staff selects projects on a quarterly basis. NCDOT selects HSIP projects on the basis of safety b/c and prioritizes and reviews systemic and Spot Safety projects using a decision support tool (Safety Index) and the detailed project packets) further described in Chapter 5. The committee also meets bi-monthly to review the status of current HSIP projects, particularly with regard to cost and delivery (progress in construction).
NCDOT is focused on "readiness and delivery" and emphasizes the need for accurate cost estimates, realistic project scopes, community support, and expedited construction as a means of maintaining public support for the safety programs. NCDOT works to ensure that smaller projects are incorporated into the program and not eliminated on account of the funding demands from larger high-profile projects. Projects exceeding $1 million must have State Traffic Engineer advance approval prior to submission. Smaller Spot Safety projects, when indicated that federal funds are acceptable, will automatically be considered for both Spot Safety and HSIP funding opportunities (this can help with systemic and vulnerable user project programming).
NCDOT also provides incentives (bounty) to encourage investment in systemic HSIP projects that address systemic issues systematically, such as full movement crossover modifications on high speed routes. For this program, when systemic improvements are identified that may not have a b/c ratio that meets the general criteria, a funding amount can be allocated to the project. This funding amount, presently $350,000, is credited to the project cost, thereby improving the b/c ratio. NCDOT also encourages the use of companion funding to leverage limited safety dollars, by using only the Safety fund cost component in the safety b/c analyses.
ODOT delivers their entire HSIP through ARTS, using Central Office-originated screening processes that rely on input from the ARTS staff in each Region. The ARTS staff in the regions then select the projects and supervise the design of selected projects, delivering them through the conventional capital construction program using HSIP funds.
ODOT delivers spot and systemic improvements based on scoping and selection processes carried out in the Regions. Fatal and Injury A crashes are used to identify spot improvement projects, while an application process is used for systemic projects.
ARTS is a data-driven program, based on crash performance and b/c analyses. Oregon divides their program into two parts, delivering spot improvements and systemic improvements based on scoping and selection processes carried out in the Regions. ODOT hired a consultant to develop a region specific "150% list" of potential spot improvement projects. Project selection is based on Fatal and Injury A crashes only. ODOT, local agencies, and the consultant work together to identify countermeasures, with attention paid to the CMF and treatment use in Oregon. ODOT Central Office staff, in consultation with Regional ARTS staff, decide which spot improvement CMFs are made available in order to provide for consistent comparisons between projects. As part of the ARTS Program, ODOT developed a list of countermeasures, known as the ODOT CRF List, which will be revised as new countermeasures become available.
ODOT spot improvement projects are prioritized using the b/c ratio. Local agencies did not utilize this safety project selection process prior to the effort in 2013. Thus, the new 150% list has no predecessor that can permit a comparison to projects previously identified and discarded because of a lack of consistent screening of local agency roads prior to the existence of the ARTS program. The initial ranking during the ARTS project selection was based on EPDO Average Crash Frequency, but the current process does not normalize EPDO initially, relying only on serious crashes in the screening process and EPDO for ranking of crashes.
ODOT uses a conventional approach to systemic improvements and provides a wide range of validated countermeasures available to local agencies. Countermeasures implemented by local agencies using HSIP funds must be selected from the approved ODOT CRF list. ODOT does not require systemic project locations to demonstrate a history of Fatal and Injury-A crashes, recognizing that systemic project implementations are often undertaken in locations that are characteristically similar to locations with demonstrated crash histories. The b/c calculation for systemic improvements in those cases would consider B, C, and PDO crashes in the benefit analysis, and these projects are ranked using the b/c ratio, along with projects with demonstrated crash history with F and A severities. This ensures that systemic improvements are applied throughout the system and in locations where future F and A crashes could be prevented.
The treatments to be used on priority corridors are identified in ODOT's Systemic Plans document. ODOT has 120 countermeasures available, with the complete list available on the ARTS web site. (9) About half of these countermeasures were identified as systemic countermeasures. The Systemic Plans are driven by ODOT's recognition that patterns of consistent similar crashes could be corrected more cost-effectively with planned systemic improvements. Unlike the hot spot process, the systemic process was an application-based process and the goal was to generate a region-specific "150% list" for each emphasis area. These separate lists for Roadway Departure, Intersections, and Pedestrians and Bicycles are the basis of the systemic project selection process. The funding allocation for systemic projects is further divided between these three emphasis areas based on the proportion of Fatal and Injury-A crashes occurring in these areas. The approximate allocations of HSIP funding, within the ARTS program, by spot and systemic projects, is displayed in Figure 10.
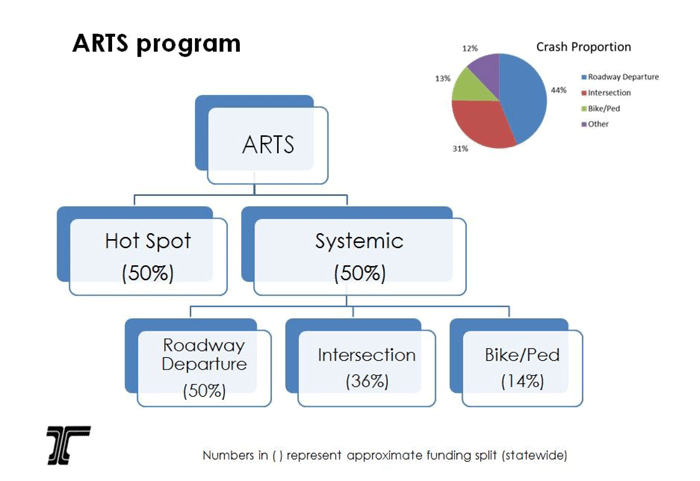
Figure 10 . ODOT ARTS program funding allocations and crash proportions.
Oregon's systemic project prioritization is based on b/c ratios for the roadway departure and intersection projects. Pedestrian and bicycle crashes are random enough that insufficient data exists for a benefit computation. ODOT uses the Cost-Effectiveness-Index (CEI) for bicycle/pedestrian projects. The CEI is the proportion of the number of correctable bicycle/pedestrian crashes to the cost of the bicycle/pedestrian project. ODOT considers the CEI to be a tool for data-driven evaluation of bicycle- and pedestrian-focused HSIP projects.
UDOT differentiates between spot improvements (reactive projects) and systemic improvements (proactive projects). The UDOT HSIP screening process uses analysis of crash data to study roadways with similar characteristics in an effort to determine systemic improvements that can be implemented system-wide. Some system-wide projects use a prioritization system, which uses crash performance to allocate projects among multiple levels of priority, including use of a weighted average for Fatal and Injury-A crashes. This approach has been successful in fully implementing systemic improvements, which has been recognized as the key to eliminating the entire crash problem across all segments. While data on specific locations for systemic improvements may not indicate a crash trend, UDOT's systemic efforts have been successful in eliminating targeted crashes when the entire systemic project was completed, proving the merits of the systemic approach. One example of systemic improvements in the absence of crash trends is the installation of cable median barrier, where installation was predicated on a decision tree using factors such as traffic volumes, median widths, and curve radii. In some locations with characteristics matching the highest-risk criteria, crashes were occurring and the systemic project corrected the majority of system crashes, as Figure 11indicates. However, the completion of the cable median barrier project throughout the system was necessary to nearly entirely eliminate those crash types.
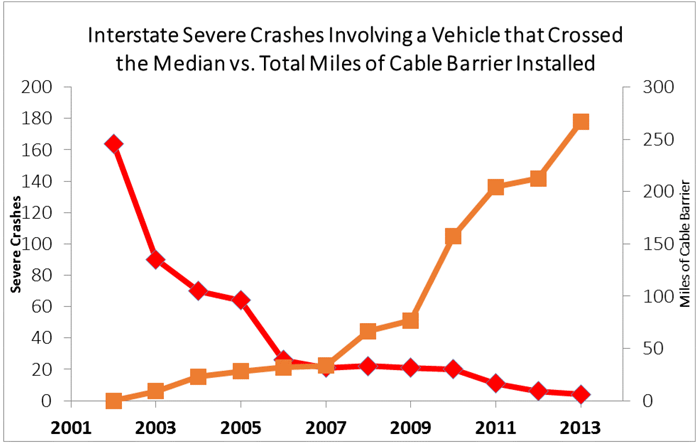
Figure 11. UDOT cable median barrier crash trends.
UDOT has observed a difference between public perception and data-driven safety management reality and is sensitive to the need to make the case for safety projects and behavioral programs. Utah recognizes that successfully addressing spot crash locations will lead to the need for more and more systemic programs. This change will be facilitated with improved data collection systems and enhanced analysis tools. UDOT's success in safety management outcomes is largely driven by policy that supports funding only those projects which can be related to a performance measure.
The Host States use a variety of crash data collection and analysis tools to assist in making data-driven safety decisions. For each State, crash report information is key in developing collision diagrams for projects, supplementing RSA preparation, and identifying the causative effects of crashes. Since most States do not actually own the crash data, it is important that not only the DOT, but all safety stakeholders have access to the data. Many States have a web portal, or something similar, enabling access to crash data. Typically, the DOT was a key partner in ensuring this level of accessibility exists.
In many of the host States, a lag in data collection, coding, and entry was evident. Both Alaska and Utah have worked to address these issues with academic partnerships aimed at improving crash data collection and the timeliness of coding.
Each Host State uses a documented process for system screening, project nomination, and project selection. In Illinois, the use of an online portal for the submission of project nominations enables their Bureau of Safety Engineering to track every project while also facilitating local submission of project nominations. The IDOT system screening process relies on the Safer Roads Index, a numerical value indicating the potential for safety improvement on roadway segments, derived from SPFs and current crash statistics.
Among all States, Illinois and North Carolina offered the highest degree of flexibility for project nomination and selection. North Carolina's wide variety of Safety Warrants provide HSIP staff with a time-tested method of evaluating improvements. In Illinois, the strong collaboration with the District engineers and the Bureau of Safety Engineering retention of statewide funds provided two primary IDOT-led project nomination channels, facilitating the statewide perspective and the regional perspective.
North Carolina, Oregon, and Alaska, in particular, make extensive use of regional engineering staff in the process of scoping potential improvements. While all of these agencies have centralized the system screening, the deployment of local resources in scope and contract plans development was seen as key to effective cost control and projects appropriate for the system.
In Massachusetts, where crash data is provided in an online tool, local agencies and planning organizations are particularly empowered to undertake locally-sourced screening (with MassDOT assistance) in the effort to identify problem areas and generate projects for the State's multi-year plan.
Most States differentiate between spot and systemic improvements. In Illinois and Utah, strong investment in systemic projects was seen as a key means of reducing system-wide fatal and serious injury crashes, particularly in areas where crash concentrations were insufficient to trigger a spot investment in the screening process.
| << Previous | Table of Contents | Next >> |

