U.S. Department of Transportation
Federal Highway Administration
1200 New Jersey Avenue, SE
Washington, DC 20590
202-366-4000
The HSM provides States with new tools to more effectively predict the effectiveness of alternative safety strategies and countermeasures. High-performing States are not only using these tools, but are incorporating them into their processes for evaluating and prioritizing potential HSIP projects.
SPOTLIGHT ON SAFETY:
New Hampshire's Use of Safety Analyst
The effort to evaluate and integrate Safety Analyst into the HSIP and other NHDOT programs began in 2009, under the impetus of the then-in-force FHWA mandate for development of a 5% List. Additionally, NHDOT was struggling to evaluate the effects of systemic improvements such as signing and was seeking a robust analysis solution. Initially, the program's staff validated roadway data on State facilities. The most significant hurdle was the development of the data integration protocols for Safety Analyst, including a 2-year process to develop the intersection database and conduct supplemental data collection. Roadway segments were added first, starting with the State system and then the local system. Intersections and ramps were added in subsequent years. For segments between intersections, the road inventory database was translated into the format for Safety Analyst, with post-import calibration and post-processing. Prior to beginning this work, the Assistant Highway Safety Engineer conducted a data mapping exercise and correlated fields in existing databases with Safety Analyst fields, laying the groundwork for adding roadway data to the program and developing an intimate knowledge of the program architecture, processes, and data development needs.
The key for New Hampshire was the statewide existence of a Linear Referencing System and Road Inventory data, which exists for all public roads including intersection and ramps. HSIP funding was used for improvements to the inventory systems so that Safety Analyst development could take place without significant data integration challenges. NHDOT is working to improve data for local traffic volumes and local intersection traffic control types. With most roadway data included in the program and subsequent data needs well-defined, the analysis of crashes and safety outcomes is less intensive.
The Network Screening Module of Safety Analyst is used the most in New Hampshire, primarily because it assembles collision diagrams and crash data in one place. Safety Analyst reduces the expenditure of time for network screening and has been the driving factor for multiple screenings with a variety of criteria, providing in-depth views of safety hazards and potential countermeasures. Prior to the implementation of Safety Analyst, NHDOT expended a large amount of time on data analysis in the development of safety efforts, but now data manipulation has replaced analysis as the time-consuming activity. The software's use of data for analysis beyond the fundamental data elements and network performance HSM-based methodologies has produced high-quality projects, particularly because of the availability of network-wide data. In particular, Safety Analyst's use of predictive methods mitigates the effects that occur on account of infrequent or non-existent crashes at specific sites.
The local planning agencies are trained to use Safety Analyst and have begun using the predictive method tools for evaluating safety performance of roadways in the course of capital improvement planning work. The 10-year Transportation Improvement Plan (TIP) is populated using planning agency solicitations of projects and the State Transportation Improvement Plan, a 3-year plan, includes projects identified using safety performance as one of the selection criteria. This use of Safety Analyst transportation planning beyond the safety program implementation is believed to be unique to New Hampshire and is particularly notable because of the effort to involve MPOs in the planning process by training them to use Safety Analyst as well.
NHDOT's first use of the Safety Analyst Effectiveness Evaluation module involved using before-and-after data to test the HSM evaluation process against the observed crashes method of evaluation. The eventual goal is to construct prior-to-project and subsequent-to-project SPFs, enabling cost-per-countermeasure evaluations to validate project performance and the return on investment.
The delivery of the UDOT HSIP is partially based on information obtained from several primary analysis tools. Those tools are the crash query and safety data investigation system created by Numetric, the FHWA Systemic Safety Project SelectionTool, United States Road Assessment Program (usRAP), and the Utah Crash Prediction Model (CPM) developed jointly with Brigham Young University.
UDOT delivers their HSIP using several analysis tools, including a tool developed by Numetric, the FHWA Systemic Safety Tool, usRAP, and the Utah Crash Prediction Model.
The FHWA Systemic Safety Project Selection Tool analyzes input based on network crash data. The output is a visualization tool that helps understand crash trends and types throughout the system, aiding in selecting targeted areas for investment strategies.
The usRAP Safer Roads Investment Plan considers risk factors from roadway features and computes benefit cost ratios using safety performance functions to determine the potential for future crashes, computing a b/c ratio with UDOTs value of life inputs. The output from the Safer Roads Investment Plan explicitly considers risk to users by mode and provides a strategy for investment that maximizes benefit.
The Utah CPM is a Bayesian statistical model created in cooperation with Brigham Young University. The CPM examines risk factors and estimates the crash risk, a precursor to Safety Performance Function development. This independent network screening is also used to identify candidate HSIP projects. UDOT's partnership with the academic institutions has even led to positive media coverage on how the "science" of safety management involves this type of in-depth, rigorous data analysis. Figure 12 shows the output of the CPM.
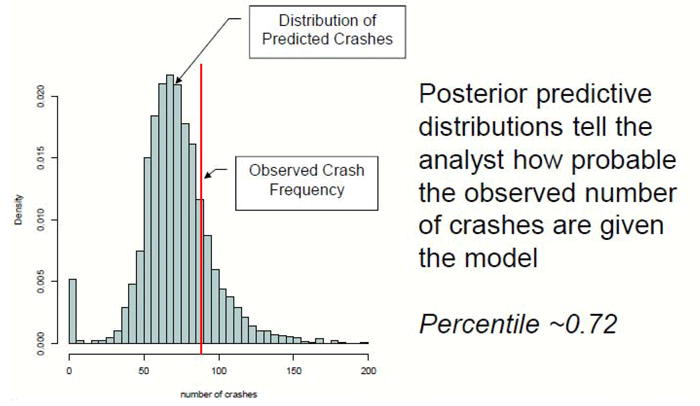
Figure 12. Output of Utah's crash prediction model.
Illinois uses safety performance functions (SPF) for State-maintained routes to predict the average number of crashes as a function of exposure based on infrastructure characteristics (roadway segment versus intersection). IDOT uses the PSI, as described in the HSM Part B, in its effort to determine what percentage of the crashes observed exceed the predicted amount for similar type roadways or intersections within assigned peer groups. IDOT uses weighted PSI to incorporate severity of crashes into the analysis methods. Using the KABCO scale, severe crashes are weighted 25 for fatal (K) crashes, 10 for A-injury crashes, and 1 for B-injury crashes. This method was used originally to develop IDOT's 5% List and was expanded to a "100% List."
The IDOT Safer Roads Index (SRI) improves the integration of quantitative safety performance in transportation project planning and programming.
IDOT developed the SRI with Safety Tiers and uses the PSI values for each roadway segment or intersection to move beyond the simple test of identifying whether or not a location is a 5% location and improve the integration of quantitative safety performance in transportation project planning and programming. Safety Tiers categorizes roadways segments and intersections based on their level of safety performance and opportunity for improvement, providing a rating for relative comparison. The Safety Tiers include a Critical/5 percent, High, Medium, Low, or Minimal designation. Safety Tiers allow transportation officials to understand relative performance of a location compared to similar types of roadways or intersections. For example, a rural 2-lane roadway segment would be compared to other similar types of rural 2-lane roadways statewide and would not be compared to an urban multi-lane facility. The Safety Tiers allow more locations to be identified and analyzed for similar roadway features and potential crash trends.
The SRI classifies locations (segments and intersections) based on the Safety Tiers and, in a GIS tool, assigns colors to each one consistent with the level of priority, as demonstrated in Figure 13.
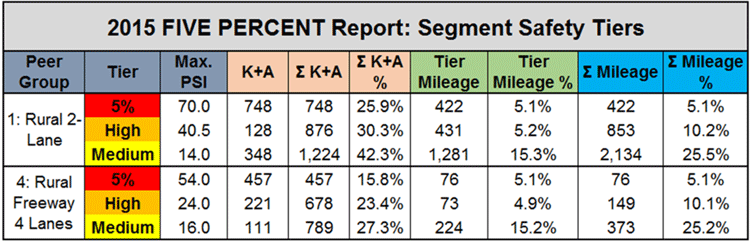
Figure 13. Illinois DOT safety tier classification.
The "High" classification locations are the second-highest category behind the "Critical or 5% List," comprising of locations (segments or intersections) which reflect 5 to 10 percent of the mileage within a peer group and the associated fatalities and serious injuries within the peer group. The "Medium" classification comprises of locations (segments or intersections) which reflect 10 to 25 percent of the mileage within a peer group and the associated fatalities and serious injuries within the peer group. These 3 top tiers account for approximately 25 to 50 percent of the fatalities and serious injuries on the State system. The SRI values, by segment, when used in mapping tools, allow direct segment-by-segment comparisons between the SRI and pavement data for the Condition Rating Survey (CRS) and the International Roughness Index (IRI). This tool is a visual and tactical aid found to be invaluable for programming of general capital improvement projects that accomplish all of three of these strategic objectives.
The analysis tools enabled by the SPFs in the SRI are allowing IDOT to transition from an emphasis on site-specific projects to system-wide and systemic projects and further to complete optimization of safety investments. For example, cable median barrier ("cable rail") installation research uncovered that on just 19 percent of the system, 49 percent of crashes occurred, typically in areas with a 40-ft median and average daily traffic in excess of 20,000 vehicles. Understanding the roadway segments that would benefit from systemic investment is just one outcome of the SRI. In addition, instead of a few intersections being identified and evaluated based on a 5% List, corridors of intersections can be evaluated to determine trends and potential policy changes.
The University of Illinois developed the SPFs for IDOT in 2007 at a cost of roughly $100,000. IDOT considers their investment in setting up the SPFs to be a programmatic investment with a substantial ongoing return. Use of the SPFs allows IDOT to direct efforts to appropriate locations, broaden areas of focus, and improve analysis of corridors and system-wide safety improvements. The Districts have embraced the SRI, which has helped IDOT to institutionalize safety as part of their culture.
IDOT intends to include SRI and Safety Tier information in the statewide roadway inventory, providing planning and programming staff a means of readily accessing this information as they make decisions within the planning and programming process, which includes evaluation of pavement and bridge performance.
The Host States use a variety of methods and analysis tools to identify safety concerns and countermeasures. New Hampshire DOT's use of Safety Analyst helps reduce the expenditure of time for network screening and has been the driving factor for multiple screenings with a variety of criteria, providing in-depth views of safety hazards and potential countermeasures. UDOT delivers their HSIP using several analysis tools from Numetric, the FHWA Systemic Safety Tool, usRAP, and the Utah Crash Prediction Model. IDOT uses a SRI to incorporate safety into their overall transportation management process and improve the integration of quantitative safety performance in transportation project planning and programming.
| << Previous | Table of Contents | Next >> |

