U.S. Department of Transportation
Federal Highway Administration
1200 New Jersey Avenue, SE
Washington, DC 20590
202-366-4000
| < Previous | Table of Contents | Next > |
The first step in conducting safety analysis is compiling the available data. The type of safety analysis that can be conducted and its level of sophistication vary according to the quantity and quality of the data used. Valuable safety analysis can be conducted with very little data. The most common types of quantitative data used for safety analysis are crash data, traffic volumes, and roadway characteristics. Qualitative or anecdotal information from stakeholders also is commonly used in safety analysis.
In addition to data, documents and other readily available resources along with information and assistance from a variety of organizations and agencies can be referenced and enlisted as support for safety analysis.
This section provides information about:
These types of data and resources are described in further detail below.
Anecdotal data include phone calls from concerned citizens, community member survey results, news items, and local staff and police knowledge about a particular site or segment of roadway. These data provide a range of perspectives about potential safety issues, including speeding, limited sight distance, lack of signage, and roadway segments that frequently experience icy conditions. They are particularly useful in identifying sites with potential for safety improvements. Additional information, as well as ideas for potential solutions, can be gathered from these stakeholders as well.
Quantitative data include information from police reports, crash data, traffic volume data, and roadway characteristics.
Typical sources of crash data include local and state crash databases as well as local police crash reports and the National Highway Traffic Safety Administration (NHTSA) Fatal Analysis Recording System (FARS).
Quantitative versus Qualitative?
Quantitative: Deals with measurable data, such as speed, time of day, traffic volumes, numbers, and rates of crashes or fatalities.
Qualitative: Deals with things that can be observed but not easily measured, such as an individual’s perception of safety on a roadway, public attitudes towards DUI checkpoints, and various other descriptive information.
Local and State Crash Data. Local law enforcement agencies usually keep records of all crashes their officers have recorded. These crash reports are recorded on crash forms that are uniform across the state, but often differ between states. Despite differences in the forms, crash reports across all states generally contain data related to:
Most crash reports include a key that describes the meaning of the codes used in the form. Figure 2 is an example of a crash report form from Michigan.
In some states, the DOT collects and maintains crash data for all public roads. In others, the state police maintain a comparable data system. These databases enable summary crash data to be analyzed and reports to be generated. Many states also publish summary crash reports that can be useful to understand crash trends and provide contact information for data requests or support (for example, Oregon Department of Transportation’s annual crash report.
Figure 2. Example of Crash Report Form from Michigan

Source: Michigan Department of Transportation, UD-10 Traffic Crash Report Manual.
Crash data can be requested from the DOT or State Police. Staff in the traffic engineering or safety division of the DOT or Local Technical Assistance Program (LTAP)/Tribal Technical Assistance Program (TTAP) can provide guidance on requesting crash data. Typically, these staff study both engineering and behavioral-related (behavioral, including seat belts, driving under the influence of alcohol or drugs, texting/cell phone usage) crash issues and are therefore good resources for data analysis assistance and information about safety-related activities at the DOT. Be aware that due to processing and reporting issues crash data summaries are often published six to nine months after the end of a given calendar year.
NHTSA Fatal Analysis Recording System. All motor vehicle crashes with fatal injuries are recorded in the NHTSA Fatal Analysis Reporting System (FARS) database, as illustrated in Figure 3. FARS is an on-line database which can be queried to learn about fatal crashes in any jurisdiction.
Figure 3. Example from NHTSA FARS On-line Database

Source: NHTSA Fatality Analysis Reporting System (FARS) Encyclopedia.
Traffic volume data are routinely collected for traffic operations analyses, transportation planning activities, and analysis of traffic patterns. These data can be used in combination with crash data to calculate crash rates. Calculating crash rates is helpful because the number of crashes at a given location depends not only on roadway characteristics and driver behavior, but also on the volume of traffic or “exposure.” It is best to use crash rates as a tool to compare safety performance for sites with comparable traffic volume and roadway characteristics.
The types of traffic volume information that contribute to safety analysis include:
Traffic volumes tend to vary with the type of roadway facility, the season, day of week, and the level of development. If an agency has a public works, engineering, planning, or traffic engineering department, it already may collect and record traffic volume data for local roads. State DOTs typically collect and record traffic volume data on state-owned roads (and in some cases non state-owned roads as well). The Handbook of Simplified Practice for Traffic Studies (see resources) provides information about collecting traffic volume data if none are available.
Many safety analysis tools use roadway characteristics data as an element of the analysis, including:
Functional Classification
Streets and highways are grouped into classes, or systems, according to the character of traffic service that they are intended to provide.
Common functional classifications in a local environment are arterial, collector, and local roads. A road is planned and designed to be an arterial, collector, or local road based on the character of the traffic (i.e., local or long distance), the degree of land access provided and travel speeds.
Arterial – Provides the highest level of service at the greatest speed for the longest uninterrupted distance, with some degree of access control.
Collector – Provides a less highly developed level of service at a lower speed for shorter distances by collecting traffic from local roads and connecting them with arterials.
Local Roads – Consists of all roads not defined as arterials or collectors; primarily provides access to land with little or no through movement.
Agency public works, planning, or traffic engineering specialists may be familiar with or have access to roadway characteristics information. State DOTs have much of this information, at least for state-owned roads, because they are required to provide it for the National Highway Performance Monitoring System (HPMS) database. If roadway characteristics data cannot be obtained through these sources, they can be collected through field reviews or identified through review of on-line satellite images (Several sources can be used including Google Maps™ mapping service or Bing® Maps).
HPMS Information
Among many purposes, the state Highway Performance Monitoring System (HPMS) is used for understanding national highway system performance analysis, funding allocation analyses, and reporting to Congress. Roadway extent, use, condition, and performance data are described in the HPMS database which all states provide on-line.
Often, crash data, traffic volume data, and roadway geometrics data are provided as part of the safety analyses conducted for various projects and reports. Statewide safety policy and planning documents also may contain information useful to local or Tribal practitioners studying safety. Example resources include:
More information about SHSPs is available on the Strategic Highway Safety Plan page. This site also provides links to all state SHSPs.
State SHSPs present emphasis areas and strategies statewide and provide valuable information about the most important safety issues from the state’s perspective. Because of their broad, statewide scope however, they may not provide practitioners with localized data.
Most state DOTs have Tribal Government Liaison staff that are charged with working with sovereign Tribal governments on transportation issue. Tribal Liaison staff can be an easy access point for Tribal governments interfacing with the state DOTs or local agencies in their area.
Many organizations provide safety training, information, contacts, advocacy, and analysis support, including:
LTAP/TTAP. Local Technical Assistance Programs (LTAP) and Tribal Technical Assistance Programs (TTAP) centers serve every state. Seven regional TTAP centers serve tribal governments by region across the country. The goal of these programs is to provide training, information, and resources to local and Tribal practitioners to address safety, security, congestion, capacity, and other issues on local and Tribal roads.
Kentucky, Florida, Idaho, Iowa, New York, Pennsylvania, West Virginia, and the Northern Plains Tribal Assistance Program have Safety Circuit Riders. Safety Circuit Riders provide safety-specific training, resources and support for analyzing safety issues, studying sites, and identifying low-cost safety countermeasures. FHWA has published a best practices guide for safety circuit riders. The purpose of the guide is to help state DOTs and LTAP/TTAPs enhance existing Safety Circuit Rider programs. If a state does not have a Safety Circuit Rider, safety training, resources, and support are available through the LTAP/TTAP.
LTAP and TTAP Centers
Every state plus Puerto Rico has a LTAP center. There are also seven tribal centers (TTAP). LTAP and TTAP Centers are charged with helping local and tribal agencies with transportation problems through training and technical support.
FHWA division offices generally have a Local Agency Engineer/Specialist that is specifically charged with interfacing with local and Tribal governments in their area.
After compiling and reviewing the available safety data, its quality should be assessed. Answers to the following questions provide a good indication of data quality:
The type and quality of available data determine the type and quality of analysis that can be conducted. The more comprehensive and accurate the data, the more options there are for in-depth analysis. However, valuable results can be obtained even with limited data.
In some instances estimating data using best judgment is sufficient to advance the analysis. In such cases, documenting how the estimate was made and why objective data was not used, helps everyone involved understand the limitations associated with the estimation process and the results obtained from it.

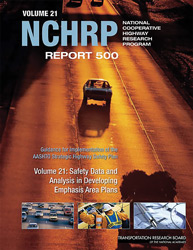
Source: National Cooperative Highway Research Program.
Section II of this document provides additional information about resources, opportunities and barriers associated with collecting and applying many of the data sources described above. Section III of this document also provides a process for identifying, evaluating, and identifying treatments for a specific safety concern. This publication can be found on the TRB web site.

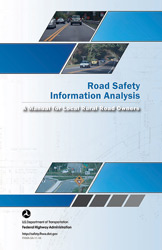
Source: FHWA.
This manual was published in 2011 by the FHWA to provide information on crash data collection and analysis techniques specifically applicable to local practitioners with limited resources. It is intended to help improve safety on local rural roads by providing a background on data driven decisions. The manual is written in nontechnical language and designed to meet the needs of local road professionals, regardless of their educational background or experience.
Pages 4 to 12 of the manual summarizes the three common types of data needs for a safety project or program: crash data, roadway characteristics data, and exposure data.
The manual is FHWA Report Number: FHWA-SA-11-10.
You may need Adobe® Reader® to view the PDFs on this page.
| < Previous | Table of Contents | Next > |
