U.S. Department of Transportation
Federal Highway Administration
1200 New Jersey Avenue, SE
Washington, DC 20590
202-366-4000
| < Previous | Table of Contents | Next > |
A “network” refers to the collection of roads under the jurisdiction of an agency. Network screening is the process of studying safety conditions on all of a road network or a subset of the network (e.g., all collector roads or all stop-controlled intersections). The safety analysis is conducted using the same method at each location so that the results can be compared and prioritized. There are a variety of methods available to conduct network screening.
While there are many methods for screening road networks, each with unique benefits and drawbacks, only five are presented in this section. They are:
To learn about other network screening methods, please refer to the comprehensive list of resources provided at the end of this section and in particular see Chapter 4 of the AASHTO Highway Safety Manual.
Local agency maintenance staff spend a significant amount of time driving on local roads and usually have extensive on-the-job experience and knowledge of community roads. These staff can be a valuable source of institutional knowledge about issues, performance, maintenance needs and opportunities for improvement.
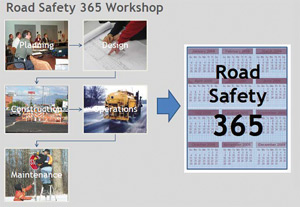
The FHWA Roadway Safety 365 workshop is a great source of training for non-technical agency staff. For more detail see the resources section at then end of this section.
Often agencies train road maintenance staff on how to identify safety issues. This training, combined with their knowledge of the roadway network, qualifies maintenance staff as excellent sources of information on locating safety concerns. Educating and relying on maintenance staff to identify safety issues is sometimes referred to as one component of developing a safety culture (another way to describe “developing a safety culture” is “to challenge employees to incorporate safety into their everyday activities regardless of their formal job function”). In fact, some agencies adopt formal policies on the frequency, type, and content of safety inspections. The following example from the United Kingdom (UK) is a case in point.
Formal safety inspection plans are widely employed in city and county councils (councils are a form of local government similar in function to cities and counties in the United States) in the United Kingdom (UK). The Aberdeen (Scotland) City Council, for example, employs a safety inspection program defined in the Aberdeen Roads Safety Inspection Manual. The Manual describes the guiding principles for conducting safety inspections, defines required inspection frequencies, provides guidance on the methodology to be used for inspections, and establishes time frames for implementing corrective actions.
Figure 4 (from the Aberdeen Roads Safety Inspection Manual) shows a repair time matrix that gives guidance on the speed that specific types of safety issues need to be addressed. This time matrix gives performance targets and sets expectations for maintenance crews, as well as informs them on when it is necessary to include a repair in a future work program.
Figure 5 shows an example of inspection criteria for assessing ruts or depressions in the roadway surface. The Aberdeen manual has inspection criteria for each type of safety defect or concern which provides objective criteria for determining if a safety issue is present and what activity is necessary. Note that the color bars in Figure 5 relate to the response necessary from the key on Figure 4.
Figure 4. Aberdeen Roads Safety Inspection Manual
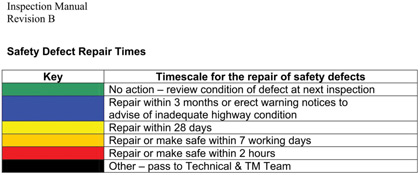
Source: Aberdeen City Council Scotland, Roads Safety Inspection Manual, 2012.
Figure 5. Example Repair Time Matrix Aberdeen Roads Safety Inspection Manual
Source: Aberdeen City Council Scotland, Roads Safety Inspection Manual, 2012.
There are several opportunities to complete routine safety inspection in conjunction with other field activities to save time and increase effectiveness of field staff. Annual pavement condition assessments for asset management activity lend themselves to looking for safety issues, as well as weekly or monthly maintenance inspections that some agencies already complete.
Local agency implementation of road inspections can be as informal as training staff on how to recognize safety issues, or as formal as an officially sanctioned process specifying inspection frequencies and methods to be followed as in the Aberdeen example. The training material from the FHWA class Road Safety 365: A Workshop for Local Governments (see resources section) is a good primer for a basic understanding of safety issues and would be valuable for informal inspection processes. Whether informal or formal, training staff on how to recognize safety issues is a low cost method of empowering staff to improve traffic safety and can lead to early detection and correction of safety issues.
If crash data are available, crash frequency and crash mapping, are methods that can be used for network screening.
The crash frequency method is a basic network screening method. This method counts the number of crashes that have occurred at a given location (along a roadway section or at an intersection) over a specified time period, typically three to five years. The results are ranked from highest to lowest crash frequency. Locations with relatively higher crash frequency are selected as possible sites for detailed investigation.
Some agencies further segregate crash frequency data by crash type or crash severity to identify locations with high crash severity or focus on a specific crash type – for example roadway departure crashes.
Crash frequency is an attractive quantitative screening technique because the only data required are crashes and their physical locations. Other data like traffic volume and roadway features are not necessary for using this technique, making it relatively quick and easy.
The most basic method of displaying and evaluating crash frequency data is to summarize the total number of crashes over the analysis period by location. It is then possible to identify those locations with the highest crash frequencies. Crash frequencies also can be calculated by crash type, such as fatal crashes or incapacitating injury crashes. Table 1 shows a summary of hypothetical crash data organized from highest to lowest total crash frequency.
Definition of KABCO Crash Severity Designation
The KABCO Scale is one tool to classify crashes by injury severity. The letters represent injury levels:
The severity of a crash is based on the greatest level of severity of injury occurring in the crash. For example: if someone is killed in a crash, the crash is labeled as a “K” or fatal crash.
Crash frequency screening relies solely on crash data. However, it does have shortcomings. The crash frequency method does not take traffic volumes into account. Because higher volume locations are likely to have more crashes than lower volume locations, this method has an intrinsic bias toward higher volume locations.
Another drawback to this method is that it does not account for the natural variation in crash frequency that occurs at any given site. On an annual basis, the number of crashes at a site will fluctuate up and down. Overtime, if nothing changed at the site (e.g., traffic volume, surrounding land use, weather, driver demographics), the frequency of crashes at the site would converge on an average crash frequency. This is called regression to the mean. Regression to the mean is the tendency for a site to experience a period with a comparatively high crash frequency followed by a period with comparatively low crash frequency.
If regression to the mean is not accounted for, a site might be selected for study because the annual number of crashes that occurred was higher than “usual” due to a random fluctuation in the data. Conversely, a site that should be selected for study might be overlooked because an unusually low number of annual crashes occurred there.
To reduce the influence of regression to the mean the agency should calculate the average of the most recent three to five years of crash data to determine the average crash frequencies. This minimizes year-to-year fluctuations in data and is appropriate if site conditions (e.g., traffic volume, land use, driveway access, roadway configuration) have not changed. However, if site conditions have changed significantly during the analysis period, it may be more appropriate to monitor the site and evaluate safety after conditions have stabilized.
Regression to the Mean
Calculating the average crash frequency over multiple years for a site will smooth out the normal year-to-year variations in crash data and mitigate the effect of the regression to the mean phenomena.
Example: A rural two-lane roadway segment averages 7 crashes per year. In any given year however, the total crashes will likely be higher or lower than the average.
Consider a year with more than 12 crashes. Using this single annual data point to estimate the next year’s crash level (12 crashes) would be a bad idea because it is much more likely for the next year’s crashes to be closer to the average (7 crashes) than it is for it to be closer to the previous year’s level (12 crashes). This illustrates the regression to the mean phenomena – the next data point in a series will tend to be closer to the true mean than to the previous data point, especially if the previous data point is an outlier. It also illustrates why the average of multiple years of data will tend to be closer to the true mean than a single year’s data will be.
Figure 6 demonstrates regression to the mean and the effects of average crash frequency across multiple years. The dark blue line shows hypothetical 1990 to 2010 annual crash frequency at a site. The crash frequency varies up and down from year to year. The gray line represents the long-term average crash frequency at the same hypothetical site. As shown the long-term average stabilizes at approximately 14 crashes per year. The gold line represents the five-year rolling average. For example, the first five-year average is from 1990-1994 and is plotted in 1994, the second is from 1991 to 1995 and plotted on 1995. As shown the five-year rolling average more closely approximates the long-term average then the annual crash frequency alone.
Figure 6. Example of Regression to the Mean
The crash mapping method involves mapping the locations of crashes over a given time period (usually three to five years). Each crash is represented by an icon or marker on a map detailing the type of crash that occurred. Locations with high crash densities are termed “dark spots” and can be visually identified on the map.
This method can be applied without the use of computer technology by simply using a paper map and push pins. It also can be done using the electronic mapping functions within geographic information systems (GIS) or mapping software. The resources listed at the end of this section describe each of these methods in more detail.
The crash mapping method does not take traffic volumes into account so, like the crash frequency method, it tends to be biased toward higher volume locations.
The equivalent property damage only (EPDO) method is documented in the Highway Safety Manual. In this method, weighting factors related to the societal costs of fatal, injury, and property damage-only crashes are assigned to crashes by severity (typically, at a given location over three to five years) to develop an equivalent property damage-only score that considers frequency and severity of crashes. The sites are ranked from high to low EPDO score. Those sites at the upper end of the list may be selected for investigation.
To apply the EPDO method for ranking sites, it is necessary to know the number of crashes per year, and the severity of crashes per year. In this method, all injury crashes (incapacitating, non-incapacitating, minor injury) are grouped together.
If crash maps are used, crashes also can be assigned labels to crash type and/or crash severity. Crash types include angle, head-on, and rear-end. The crash type is determined by the person investigating the crash based on how the vehicles collide. The crash severity could be recorded using the KABCO scale.
The EPDO method is conducted as follows:
| Severity | Comprehensive Crash Cost |
|---|---|
| Fatal | $4,008,900 |
| Injury A, B, and C | $82,600 |
| Property Damage Only (PDO) (2010 AASHTO Highway Safety Manual, Chapter 7) | $7,400 |
![]()
![]()
![]()
![]()
![]()
![]()
![]()
![]()
![]()
![]()
Table 2 shows a hypothetical summary of five intersections, their crashes by severity, and their EPDO score. Ranked by their EPDO score, the top three intersections are Intersections 1, 2, and 3; however, ranked by frequency the top three intersections are 3, 1, and 4.
Example calculations for Intersection 1 are:
Since the societal cost of fatal crashes is many times higher than the societal cost of severity and PDO crashes, the EPDO score tends to be skewed upward for any site experiencing fatal crashes. In the example shown in Table 2, the EPDO method ranked Intersection 1 higher than Intersection 3 because Intersection 1 had one fatal crash, despite having fewer crashes than Intersection 3. Practitioners should be cautious as sites that have high frequencies of severe injury crashes also warrant further investigation.
Crash rates describe the number of crashes in a given period as compared to the traffic volume (or exposure) to crashes. Crash rates are calculated by dividing the total number of crashes at a given roadway section or intersection over a specified time period (typically three to five years) by a measure of exposure. While traffic volume is the most typically used measure of exposure, others such as population, lane or roadway miles, and licensed drivers within a community also can be used. The locations are then ranked from high to low by crash rate. Crash rate screening is able to identify low volume, high crash risk locations that do not necessarily experience a high total number of crashes.
A crash rate is the number of crashes that occur at a given location during a specified time period (usually three to five years) divided by a measure of exposure for the same period. Typical measures of exposure for intersections and roadway segments are identified below.
The equation for MEV is:
The equation for MVM is:

Note: 1) AADT stands for Annual Average Daily Traffic.
Crash rates are then calculated by dividing the number of crashes by the measure of exposure. The equations are:
![]()
![]()
Note: To calculate crash rate for multiple number of years, the number of crashes and the measure of exposure should be over the same number of years.
Table 3 illustrates crash frequency and crash rate network screening to identify high crash locations. Intersection A has the highest number of crashes (crash frequency) as well as the highest traffic volume, giving it a relatively low crash rate. Conversely, Intersection C has a lower number of crashes but also a much lower traffic volume, giving it a crash rate which is nearly twice that of either Intersection A or Intersection B.
Crash rates tend to over-emphasize sites with lower traffic volumes. It is best to use crash rates as a comparison tool only for sites that have similar functional classifications, number of lanes, surrounding land uses, and traffic volume.
To compensate for short-term random fluctuations in annual crash numbers, it is recommended that three or five years of crash and exposure data (commonly traffic volume) be used to calculate crash rates. In cases where traffic volume data are not available, they can be estimated based on known traffic volumes on roads of similar functional class or use. For example, if many of the two-lane paved rural roads that are designated with the national functional classification of “local” in a agency have average daily traffic volumes between 100 and 400, it is likely that other comparable roads will have similar traffic volume.
Several software tools are available for screening road networks. These typically require extensive road network data and significant time to set up. However, these tools have advantages over “manual” or hand calculated methods, including:
The U.S. Road Assessment Program (usRAP), sponsored by the AAA Foundation for Traffic Safety, systematically assesses risk to identify locations where fatal and serious injury crashes can be reduced. To do this, usRAP utilizes a risk-mapping protocol to create maps that show variations in the level of crash risk across a road network. These maps can guide the prioritization of highway infrastructure improvements and targeted enforcement strategies. usRAP also provides usRAP Tools which is software that can develop a recommended program of location-specific crash countermeasures for any road network based on benefit/cost analysis (see Step 5 for a description of benefit/cost analysis).
Technical Definition
Systemic Safety Solutions. Low cost and widely applicable treatments that can be applied across a road network to reduce crash frequency and/or severity.
One strength of the usRAP Tools software is that it uses roadway and traffic control feature data to assess risk and does not require site-specific crash data. Roadway characteristics data do need to be collected and input into the software however, usually through a combination of video data collection and manual data input.
SafetyAnalyst is an AASHTOWare highway safety management software product. SafetyAnalyst can help an agency improve the programming of site-specific highway safety improvements. SafetyAnalyst incorporates state-of-the-art safety management principles into computerized analytical tools for identifying safety improvement needs and developing a systemwide program of improvement projects. SafetyAnalyst has a strong basis in cost-effectiveness analysis; thus, it can be helpful in ensuring that agencies get the greatest possible safety benefit per dollar spent. Comprehensive electronic, geolocated crash, traffic volume, and roadway characteristics databases are required by the software.
SafetyAnalyst was developed as a cooperative effort by FHWA and participating state and local agencies. AASHTO manages licensing, distribution, technical support, maintenance, and enhancement of SafetyAnalyst.
These software are data intensive and in most cases, a local rural or Tribal agency is not likely to implement either of these software-based network screening programs due to the start-up time and costs. However if an agency does choose to invest the time and resources required to utilize these programs, the safety analysis benefits can be tremendous.
Crashes on rural low volume roads are typically spread over a large geographic area with few repeat crashes at any given location. Low crash concentrations make identifying crash patterns by screening for high crash frequency or crash rate difficult due to the lack of data points (crashes) in any one location. In these cases, employing a systemic safety approach is often helpful. A systemic safety approach works by identifying high-risk roadway characteristics/geometry, including curves, skewed intersection, or limited sight distance across the road network. Once these problematic roadway characteristics are known, locations with these characteristics can be identified, and countermeasures targeting them implemented so that crash risks are reduced across the road network.
Although systemic analysis is data based it is useful in situations where little data are available. Systemic analysis helps the practitioner link local roadway characteristics to expected crash types (this linking of roadway characteristics and crash types is done based on research done at the national level). Roadway characteristics data consist of road geometry details – such as curve radii, shoulder width, lane width, and super elevation – for the network under investigation and are required for the analysis.
There are economies of scale to using systemic analysis to identify countermeasures, because once a road characteristic of concern has been identified, a single set of countermeasures can be applied to all locations sharing that characteristic. Typically, countermeasures identified through systemic analysis are low cost and can be readily implemented across the system.
Systemic versus Spot Safety Analysis
Spot safety analysis is based on crash history at individual locations and results in identification of high crash locations. The systemic approach analyzes crash history on an aggregate basis to identify roadways that have high-risk characteristics, and countermeasures to address these characteristics are identified. Plans are then developed to prioritize widespread implementation of countermeasures across the roadway network.
Figure 7 shows a hypothetical “crash tree” developed to demonstrate the first step in the Systemic Process: Identify Focus Crash Types and Risk Factors. A crash tree is created by dividing the total number of crashes into smaller and smaller categories of crashes. For example, as shown in Figure 7, 97 percent of the countywide fatal and serious injury crashes are non-animal related. Non-animal related crashes are summarized by intersection or non-intersection location. The data is continually sub-divided into different categories. The intersection crashes are summarized by four intersection categories: signalized, all-way stop, two-way stop, and no control. The two-way stop crashes are finally summarized by crash type: head-on, run-off-road, right angle, or other.
From this disaggregation of crash data, it can be seen that the majority of fatal and serious injury crashes during the study are non-animal-related (97 percent). Of the fatal and serious injury crashes that are non-animal related, the majority are not intersection related (70 percent), and results from vehicles running off the road (64 percent). From this information the practitioner can understand likely crash types for locations in their jurisdiction. As also shown in Figure 7, the disaggregation can be conducted for many different categories of information.
Figure 7. Example of “Crash Tree”
Note: In some cases counts do not total to higher-level numbers because counts were not completely disaggregated.
With this knowledge, a local or tribal agency can pursue a program of countermeasures related to minimizing the occurrence or lessening the severity of run off the road crashes in rural areas. Potential countermeasures include edge line rumble strips, better signing at curves, and aggressive removal of roadside fixed objects, among others. Systemic improvements like these could then be deployed on a regular basis as part of other on going agency activities like roadside maintenance or pavement maintenance programs.
The major steps (which are thoroughly described in the FHWA Systemic Safety Project Selection Tool document published in 2013) in the systemic process are:
See the resources section for more information.
The degree to which an agency collects and analyzes data during a systemic safety analysis is based on the resources and technical expertise at their disposal. As with all safety analysis methodologies, more data will lead to a more complete analysis; however even if data are not complete or comprehensive using as much as are available is a great start.
Source: FHWA.
The FHWA developed a one-day workshop to provide participants with practical guidance on improving road safety. The workshop is focused on rural roads owned by local agencies and is appropriate for audiences such as public works employees, law enforcement officers, and elected officials. The workshop promotes the development of a safety culture by showing participants how construction and maintenance activities impact safety.
The workshop includes the following modules:
Check with TTAP/LTAP Centers for offerings of this workshop.
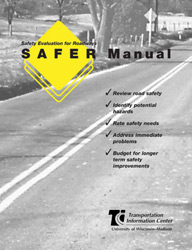
Source: University of Wisconsin.
The Wisconsin Transportation Information Center at the University of Wisconsin Madison produces the Safety Evaluation for Roadways (SAFER) Manual. The Manual was originally produced in 1996; however, the content is still relevant for use in maintenance inspections. The SAFER Manual includes a one-to-five rating scale to rate roads based on the urgency of the corrective action that is necessary.
The SAFER manual includes over 100 photographs of common safety concerns on topics such as roadsides, intersections, rail crossings, geometric issues, signing and pavement markings, road maintenance, and other special conditions.
Source: FHWA.
The FHWA produced this guide to aid local agency practitioners and maintenance staff in ensuring that their agency’s signs are maintained to meet road user needs. Section 8 of the guide can be useful for maintenance staff conducting routine investigations. It discusses inspection methods and offers maintenance staff a sign inspection checklist.
The manual is FHWA Report Number: FHWA-SA-09-025.
Source: FHWA.
The FHWA produced this guide in 2008 to assist local agency maintenance staff with identifying locations where vegetation control can be improved to enhance traffic and pedestrian safety. This document provides staff with specific items to check, and safe ways to mow, cut brush, and control roadside vegetation. Chapter 2 of the guide focuses on vegetation control items that maintenance staff should check to identify sites with potential for improvements.
The manual is FHWA Report Number: FHWA-SA-07-018.
Source: FHWA.
The FHWA produced this guide in 2009 to help local maintenance staff understand the importance of maintaining and upgrading drainage features on their road system and the potential impacts to road safety. The document guides staff to recognize drainage problems and how to correct drainage features. Page 11 of the guide offers a field inspection check list with conditions indicative of a drainage problem.
The manual is FHWA Report Number: FHWA-SA-09-024.
Source: FHWA.
The MUTCD defines the standards used by road managers nationwide to install and maintain traffic control devices on all public streets, highways, bikeways, and private roads open to public traffic. The MUTCD has been administered since 1971, and updated periodically to address changing transportation needs and new safety technologies and management techniques. The most current edition of the MUTCD is from 2009, with additional revisions made in 2012.
An electronic copy of the MUTCD is available on the FHWA’s MUTCD web site and the manual also can be purchased from AASHTO.
Source: FHWA.
The FHWA produced this guide in 2008 to provide practitioners with up-to-date information on how to repair W-beam guardrails. Chapter 2 of the manual offers guidance on identifying the extent of guardrail damage to assess its continued safety performance. Page nine of the manual offers practitioners a W-beam assessment checklist.
The manual is FHWA Report Number: FHWA-SA-08-002.
Crash frequency is described in many road safety documents. The two resources that provide the most thorough discussion on the topic are Road Safety Information Analysis: A Manual for Local Rural Road Owners and the AASHTO Highway Safety Manual.
This manual was developed by the FHWA to provide information on crash data collection and analysis techniques specifically applicable to local practitioners with limited resources.
Pages 13 to 18 of the manual provide a review of common uses of crash frequency screening; including crash averaging, crash trend analysis, and crash mapping.
The manual is FHWA Report Number: FHWA-SA-11-10.
Source: AASHTO.
The first edition AASHTO Highway Safety Manual (HSM) was published in 2010. There are four major sections of the manual: fundamentals, roadway safety management, predictive method, and crash modification factors. Chapter 4: Network Screening explains the crash frequency and equivalent property damage only methods (and many others). This chapter also discusses regression to the mean and regression to the mean bias that can be a concern when high crash locations are selected for analysis.
The HSM is available to order at the AASHTO bookstore (ISBN Number: 1-56051-477-0).
Examples of popular crash mapping tools are provided below. They are arranged from least complex to most complex in the following categories: static maps, web portals with mapping functionality, and GIS tools.
Many state DOTs create static maps in PDF or printed format for distribution to users. These maps can be a vital resource for local agencies without the technical capabilities or manpower to dedicate to crash mapping. Figure 8 provides an example of a PDF crash map produced for the State of Michigan.
More information on Michigan crash maps can be found at the Michigan Department of Transportation web site.
Figure 8. State-Level Static Maps Showing Severe and Fatal Crashes
Source: Metro Region 2012 Fatal and Serious Injury Crashes.
Safe Road Maps is developed and supported by Center for Excellence in Rural Safety (CERS), which is based at the University of Minnesota. This web-based mapping portal provides a GIS-based interface that can build maps using 2010 FARS data for the entire United States. The tool produces standard pin maps as well as “heat maps.”
Figure 9 below provides an example of a heat map. Heat maps show crash density on the roadway system. “Hotter” colors indicate a higher crash density then the cooler colors. The tool also can be used to search for fatal crashes in the vicinity of specific locations.
Figure 9. Heat Map of FARS Data for Minnesota Produced by the On-Line Mapping Site Safe Road Maps
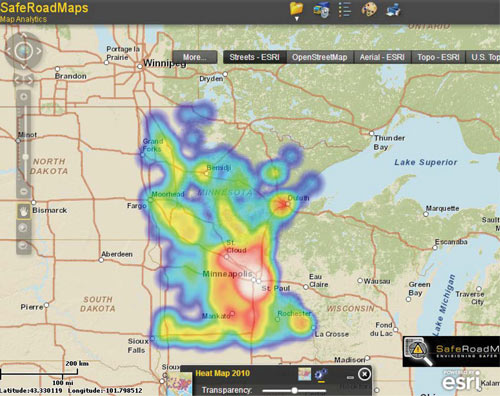
Source: Safe Road Maps.
The NHTSA FARS is a crash data resource; it is also a web encyclopedia that includes a mapping function. This tool accesses FARS 1994 to 2011 data and provides query-based reports in tabular or map formats. It can produce pin maps at nearly any zoom level. Figure 10 below illustrates an example of the FARS encyclopedia mapping functionality.
The FARS Encyclopedia is available on-line and a help file describing the mapping features of the FARS encyclopedia is also available.
Figure 10. Fatal Crash Location Pin Map Produced by the FARS Encyclopedia Mapping Function
Source: NHTSA FARS Encyclopedia.
Geographical information systems (GIS) have simplified the creation of crash maps. GIS also allows highlighting or attribution of data elements, such as crash type or crash severity, by modifying the color of crash markers. The ability to graphically represent data in reports, charts, maps, and tables adds significantly to the value of a GIS and other mapping tools. Figure 11 below provides an example of a crash map developed from a GIS system.
Google Earth™ mapping service is a free mapping tool that also can be used to plot data that has GPS coordinates associated with it. Google Earth™ mapping service comes populated with a road map of the entire United States and includes multiple years of aerial imagery and a terrain maps for most areas of the United States. Google Earth™ mapping service also has access to street level photography.
Google Earth™ mapping service does not come pre-populated with crash data, however, it can import data using several GIS-friendly formats plus crash records can be entered individually. Crash maps created in Google Earth™ mapping service can be saved and shared with other Google Earth™ mapping service users.
A download of the Google Earth™ mapping service application is available on-line as well as a tutorial of creating a map with Google Earth™ mapping service.
Figure 11. Crash Frequency Data Plotted in a GIS System for an Example Intersection
Source: Roadsoft® Version 7.6, Michigan Technological University.
Several states have developed web-based mapping tools which local or Tribal agencies can access for crash mapping analysis. One such tool is the Minnesota Crash Mapping Analysis Tool (MnMAT). The tool provides access to a state-level crash database using a GIS interface. Figure 12 provides an example of the data than can be displayed using MnMAT. MnMAT is available to Minnesota agencies free of charge (users will be prompted to request permission from MnDOT to access the tool).
Crash Data Tools at a State Level
The degree to which States have adopted tools to simplify local and tribal agency access to crash data varies greatly between States. Similarly how States market these programs to external users varies as well. Users are encouraged to explore resources in their own State by contacting their State DOT traffic safety unit as well as other traffic safety professionals at peer agencies.
Other examples are Roadsoft in Michigan and the Crash Mapping Analysis Tool (CMAT) developed by Iowa DOT. These resources and results may provide useful information about the type of data and road characteristics that may be important to a particular crash type. Also, while these tools are only available and relevant to agencies within their home states, they are good example of what features and functionality are possible if state and local agencies work together to further data access.
Figure 12. Crash Mapping Using the MnMAT On-Line Tool
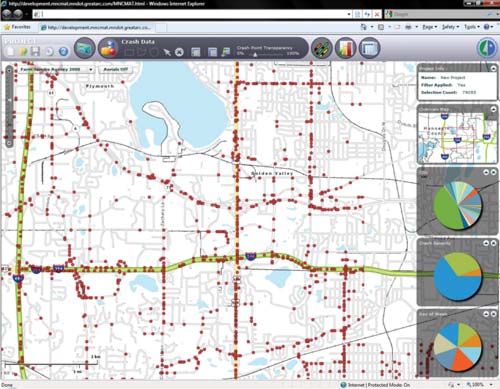
Source: Minnesota Crash Mapping Analysis Tool.
This manual was developed by the FHWA to provide information on crash data collection and analysis techniques that are specifically applicable to local practitioners. Pages 18 to 22 of the manual show sample crash rate calculations. The calculations measure exposure in traffic volumes or roadway mileage. The manual also discusses how crash rate can be used to compare relative safety to other similar roadways, segments, or intersections in the jurisdiction, region, and state.
The manual is FHWA Report Number: FHWA-SA-11-10.
Source: FHWA.
This manual was developed by the FHWA to provide information on effectively identifying intersection safety issues in local areas, choosing the countermeasures that address them, and evaluating the benefits of these countermeasures.
Pages 16 to 18 of the manual offer calculation steps for intersection crash rate that factor for level of exposure at each intersection. The manual shows an example of intersection crash rate comparison.
The manual is FHWA Report Number: FHWA-SA-11-08.
Source: FHWA.
This manual was developed by the FHWA to provide local practitioners information on identifying locations with historical or potential rural roadway departures crashes, and countermeasures to address these locations.
Page 20 of the manual explains how crash rates can be effective in comparing different network segments and can account for the level of exposure. Appendix C of the document includes formulas for crash rate calculation, and examples of calculation by vehicle miles traveled and by roadway mileage.
The manual is FHWA Report Number: FHWA-SA-11-09. The manual also can be ordered in hard copy at the FHWA report center.
Source: FHWA.
The systemic safety approach works by evaluating the road network and crashes to identify road characteristics, including road width, shoulder width, and sight distance that are present at a large number of crash sites across the road network. Then countermeasures are identified and implemented to address these common risk factors. The FHWA Office of Safety developed the Systemic Safety Project Selection Tool guidebook to provide practitioners a step-by-step process for conducting systemic safety planning, considerations for balancing investments in spot specific and systemic safety improvements, and analytical techniques for quantifying the benefits of a systemic safety program.
You may need Adobe® Reader® to view the PDFs on this page.
| < Previous | Table of Contents | Next > |

