U.S. Department of Transportation
Federal Highway Administration
1200 New Jersey Avenue, SE
Washington, DC 20590
202-366-4000
| < Previous | Table of Contents | Next > |
If a single site was studied and only one countermeasure was selected, then the agency is ready to begin implementation (go to Step 6). If, on the other hand, more than one site was studied or multiple countermeasures were identified at one or more sites, the agency will need to choose which countermeasures to implement. In these cases, the countermeasures must be prioritized to determine which should be implemented given agency resources. The appropriate prioritization method to use depends on the resources and data available.
Technical Definition
Countermeasure. An action taken to counteract a danger or threat. In the context of safety – a safety countermeasure is an action designed to counteract a threat to safety.
Example: after examining traffic crash history, roadway geometry, and other factors, the construction of a modern roundabout was selected as the appropriate countermeasure to address identified safety issues.
Related Terms: several terms are used to characterize actions to address a safety concern, including: countermeasure, treatment, “fix,” improvement, or mitigation.
One method for prioritizing among several countermeasures is to qualitatively evaluate each potential countermeasure against a set of criteria important to the community. In addition to project cost, there are many other criteria that may influence the suitability of a countermeasure to a given site. Some of these are:
To perform a qualitative evaluation, staff members select the appropriate evaluation criteria for their community or situation and rate the potential impacts and/or benefits of each countermeasure relative to the selected criteria. The rating can be “good, fair, or poor” or “high, medium, or low” based on staff members’ judgment. For criteria that can be quantified (criteria, including cost, safety effectiveness, acres of right of way needed for the treatment, and wetland impacts), the quantitative value should also be included in the evaluation.
Table 7 illustrates a hypothetical application of a “high, medium, low” qualitative rating applied to two countermeasures. The criteria selected for evaluating the countermeasures are in the left hand column. The information in the table is hypothetical. In application, the criteria and rating would be developed based on the judgment of the practitioners rating the countermeasures and the basis of the rating in the table:
It is valuable to include (to the extent possible) the public/residents/community advocates in the process of evaluating, planning for, and implementing improvements. If they cannot be included to such an extent, they should at least know that their concerns are recognized. This is important because projects with community support are more likely to be successful. Without community support a potentially good project can fail and have limited opportunities for a second chance.
Based on this qualitative assessment, each countermeasure was assigned a low, medium, or high rating for each criterion. The countermeasures were then compared and prioritized based on the assessment (see Table 7 below). In this hypothetical example, countermeasure A would be selected.
Qualitative evaluation is a relatively quick and easy to use “order of magnitude” tool for prioritizing countermeasures. It is applicable in situations where available data are limited and preliminary design activities have not been conducted.
Countermeasures also can be evaluated by converting the benefits and costs of the countermeasure to monetary value and conducting either a benefit/cost analysis, or a cost effectiveness analysis.
In a benefit/cost analysis, safety benefits are converted to the estimated dollar value of fatalities, injuries, and property damage avoided over the service life of the treatment. This is calculated as the net present dollar value of benefits. The dollar value of these benefits is then compared to the dollar value of constructing and maintaining the countermeasure over the service life of the countermeasure. Costs include construction costs, environmental costs, planning and design costs, and ongoing maintenance costs. Consideration also is given to service life of the countermeasure. In more complex applications of benefit/cost analysis, societal costs (including health care costs, pain and suffering, and insurance costs) and benefits also are considered and quantified.
Cost effectiveness analysis is similar to benefit/cost analysis except that instead of quantifying safety benefits in terms of dollar values, safety benefits are quantified in terms of expected crash reductions. Cost effectiveness analysis is used when it is not possible or practical to estimate the dollar value of the safety benefits of a treatment.
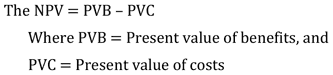
Net Present Value. The net present value (NPV) or net present worth (NPW) benefit/cost analysis method expresses the difference between the discounted costs and discounted benefits of a safety improvement project. The costs and benefits have been “discounted” meaning they have been converted to a present value using a discount rate.
The NPV has two functions. It can be used to determine which countermeasures are most favorable based on the countermeasure(s) with the highest NPV. It also can be used to determine if a project is economically justified when the NPV is greater than zero, meaning the benefits are greater than the costs.
This method identifies the most desirable countermeasure(s) for a specific site, or it can be used to evaluate multiple projects across multiple sites.
Table 8 is a hypothetical example using the NPV to rank four alternatives.
Source: FHWA.
Note: Alternative B has the greatest Net Present Value. All of the alternatives are economically justified, as their net present value is greater than zero.
For Alternative A the NPV is calculated:
![]()
The same step is repeated for the other three countermeasures. All are economically justified with NPV greater than zero. Alternative B has the greatest NPV, and is ranked number 1, based on this method.
Benefit/Cost Ratio. A benefit/cost ratio divides the sum of all of the benefits associated with implementing a countermeasure, expressed in monetary terms, by the sum of all the costs associated with implementing and maintaining the countermeasure. The benefit/cost ratio (B/C Ratio) of the project is the ratio of the present dollar value of the benefits to the present dollar value of the costs.
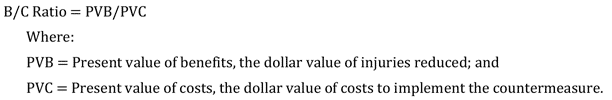
A project with a B/C Ratio greater than 1.0 is considered economically justified. The B/C Ratio can be used to prioritize optional countermeasures at one site or to prioritize among sites, by estimating the B/C Ratio for selected countermeasures at each site, and ranking the sites from highest to lowest B/C Ratio. The sites at the top of the list should be selected for countermeasure implementation. Table 9 shows an example using benefit cost ratios.
Source: FHWA.
Note: Alternative A has the highest benefit/cost ratio. All of the alternatives are economically justified, as their benefit/cost ratios are greater than zero.
For Alternative A, the B/C is calculated:
![]()
The same step is repeated for the other three countermeasures. All are economically justified with B/C greater than one. Alternative A has the greatest B/C ratio, and is ranked number 1, based on this method.
Some state departments of transportation have publicly available cost benefit spreadsheets. It can be worthwhile to check on the state DOT web site for availability.
Cost-Effectiveness Index. In situations where it is not possible or practical to determine dollar values of countermeasure benefits, a “cost-effectiveness” metric can be used in lieu of the net present value or benefit/cost ratio. Cost-effectiveness is the amount of money required to avoid a single crash, or the total amount spent on the countermeasure(s) divided by the expected number of crashes reduced. In this case, the countermeasure with the lowest cost-effectiveness index is ranked highest.
The Cost-Effectiveness Index is calculated as follows:
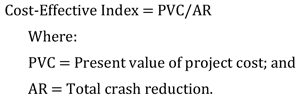
In this analysis, the present value of the project cost is calculated in the same manner as in benefit/cost analysis. The value of crash reduction is estimated by multiplying the relevant crash modification factor by the number of existing crashes to yield the number of crashes expected after countermeasure implementation. This method provides a general sense of a project’s value, and can be used to compare many safety improvement projects relative to each other. This method also avoids the sensitivities of placing a dollar value on lives and injuries. In this method, a smaller cost-effectiveness index is better.
Table 10 provides an example of evaluating four alternatives at a given site using a cost-effectiveness index as the measure for prioritizing countermeasures.
Source: FHWA.
Note: Alternative A is ranked first as it has the lowest cost associated with each crash reduction.
For Alternative A, the cost-effectiveness index is calculated as:
![]()
The cost-effectiveness index is calculated for each alternative as shown in the table. Alternative A is ranked first since it has the lowest cost associated with each crash reduced.
Agency preferences and available resources influence which countermeasure prioritization method is applied. Funding agencies often suggest and sometimes require agencies use a particular method in their applications for funding. In these cases, technical guidance outlining the specific requirements of the analysis is typically provided by the funding agency.
Other prioritization and optimization methods are sometimes used as well, including:
These methods are not typically used for selecting or programming projects at the local level because of the technical expertise required and generally the number of project is limited. They are described in some detail in Chapter 8 of the Highway Safety Manual.
Section 4.4 of the Highway Safety Improvement Program (HSIP) manual discusses methods of prioritizing countermeasures for implementation. These methods include: project cost, monetary value of benefits, total number of crashes reduced, net present value, and cost-effectiveness. The manual also provides information about incremental benefit/cost analysis and optimization methods.
The HSM’s Volume 1, Chapter 7 presents methods for prioritizing countermeasures at one site or prioritizing sites for implementation. The Manual’s Table 8-1: Summary of Project Prioritization Methods provides users with a comparison of the input needs, outcomes, and considerations for the different methods.
You may need Adobe® Reader® to view the PDFs on this page.
| < Previous | Table of Contents | Next > |

