U.S. Department of Transportation
Federal Highway Administration
1200 New Jersey Avenue, SE
Washington, DC 20590
202-366-4000
| < Previous | Table of Contents | Next > |
Once the site(s) have been selected for evaluation; crash data, traffic volume data, and roadway characteristics at the selected sites should be studied to identify the factors contributing to the crashes. Stakeholders also should be consulted to better understand their impressions of conditions and issues at the sites. This step is referred to as site diagnosis.
The availability of data substantially influences the methods available for diagnosis. This step presents information about diagnosing site crash conditions both without and with crash data and identifying countermeasures for a site.
In this step, the crash data, crash patterns, past studies, and physical characteristics of the site(s) are studied to understand crash contributing factors and identify potential countermeasures to address them.
Crash contributing factors are driver behaviors, events, or roadway infrastructure characteristics that contribute to the occurrence of the crash. Examples include texting while driving, low roadway friction around a curve, sight distance constraints, or inadequate lighting. Countermeasures/treatments refer to strategies implemented to reduce a specify crash type or crash severity.
Options for conducting site diagnosis without crash data are:
Existing Expertise. A variety of agency staff, including maintenance workers, public works staff, engineers, planners, landscapers, law enforcement officers, and public transportation providers, travel the road network everyday. These professionals are very familiar with the roadways and can provide information about locations with safety issues, including broken guard rails, standing water, skid marks, repeated sign maintenance requirements, scarred landscaping. They can help identify potential safety issues, conduct field assessments, and identify countermeasures to address safety issues.
Module 4 of the FHWA Road Safety 365: A Workshop for Local Governments provides information about “reading the road” which could be useful for these practitioners. “Reading the road” asks practitioners to look for indications along the road or at a site that indicate road users may be having problems traveling through the section. Typical example indicators are damaged guard rail or road signs or roadway skid marks.
Road Safety Audits. A RSA is a formal safety examination process of an existing or future road or intersection by an independent team. The team may include some or all of the following: planners, engineers, maintenance staff, enforcement staff, stakeholders, emergency services staff, and/or pedestrian or bicyclist safety experts.
The aim of an RSA is to answer the following questions:
The major steps in conducting an RSA are:
RSAs are inexpensive, focus on feasible and effective solutions, and are relatively quick to conduct.
Highway Safety Manual. A more advanced approach to diagnosing site conditions is provided in the Highway Safety Manual (HSM). The predictive method described in Part C of the HSM uses equations known as Safety Performance Functions (SPF) to estimate the number of crashes to be expected on a given facility and tests the likely impacts of various countermeasures. While this method does not require crash data, it does require detailed information about roadway cross-sectional features, traffic volumes, and a calibrated SPF. Please see Part C of the HSM for additional information.
Utilizing existing expertise, conducting RSAs, and using the HSM predictive method benefit from, but do not require crash data. Even without crash data these methods can provide reasonable estimates of safety conditions; improved understanding of issues contributing to the safety conditions; and potential countermeasures to address them.
Several tools/techniques are available to diagnose safety concerns when crash data are available.
The following is a brief overview of each tool/technique. Resources related to them are identified in “Resources” summary.
Crash Report Forms. Crash reports for a particular site can be studied and compared to determine if there are any common factors among the crashes. Sometimes the prevalence of a single crash type or common contributing factor or other recognizable patterns may become apparent. These patterns provide clues to identifying the underlying factors contributing to crashes at the location. For example, in some cases, repeated rear end collisions may be evident, in others, nighttime crashes might be a common feature.
These findings can be summarized in tables or pie charts, as shown in Table 5 and Figure 13. Table 5 provides a table of basic crash data for a given site indicating that the major crash type is angle crashes.
Figure 13. Example of Graphical Representations of Crash Data
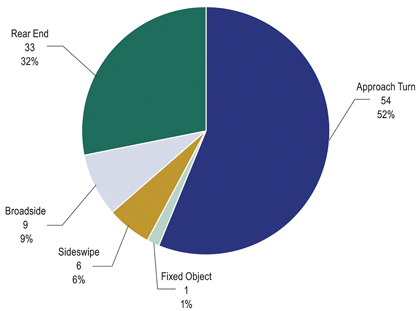
Source: FHWA.
Source: FHWA.
Haddon Matrix. The Haddon Matrix (Table 6) is a tabular summary of site crash conditions designed to help practitioners understand crash contributing factors. A unique feature of the Haddon Matrix is the specific categories of summary information. The rows correspond to stages of the crash event (pre-crash, during the crash event and post-crash), and the columns correspond to categories of contributing factors (human error, vehicle/equipment, physical environment, and socioeconomic) involved in the majority of crashes. These categories are standard for the Haddon Matrix. The table is filled as the practitioner reviews and interprets the crash reports related to the location under consideration. More information about the Haddon Matrix is in Chapter 3 and Chapter 6 of the Highway Safety Manual.
Contributing Factors or Causal Factors?
While it is common to refer to the “cause” of a crash, in reality, most crashes cannot be related to a singular causal event. Instead, crashes are the result of a convergence of a series of events that are influenced by a number of contributing factors, including time of day, driver attentiveness, speed, vehicle condition, and road design.
Contributing factors fall into three major categories: human, vehicle, and roadway.
Crash Diagrams and Conditions Diagrams. Crash diagrams are a technique to graphically illustrate crash data associated with a given site. Each crash is plotted on a schematic of the site at the approximate location where the crash occurred. Icons are used to represent crash types so that patterns are identifiable. Crash diagrams are sometimes cross referenced with a tabular listing of the associated crash data so that key information can be accessed easily.
Figure 14 is a crash diagram for the data in Table 5 above. The table provides a summary of crashes, while the crash diagram provides information about the number of crashes in the context of the site being studied. Together, they provide a more complete understanding of site crash conditions than either one does separately. Note the pattern of right angle crashes on the south leg of the intersection near the shopping center.
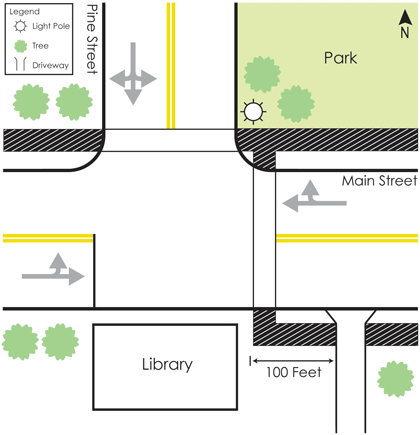
Condition diagrams are sketches showing the physical layout of the site under investigation such as surrounding land uses, roadway lane configurations, driveways, and other physical features of the site. Crash and condition diagrams can be either sketched by hand or created using software.
Figure 14. Example Collision Diagram
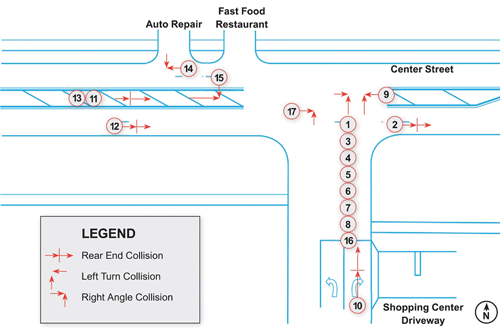
Source: FHWA.
Figure 15 shows an example condition diagram that has been created based on site visit information. Details of the intersection such as lane configuration and the locations of obstructing trees were collected during a site visit. For example, overgrown shrubs close to the intersection could explain a pattern of crashes where lack of sight distance was identified as a crash factor.
Graphical and tabular analysis of crash data are useful when there are many crashes associated with a site. In rural areas, especially on low volume roads, intersections may not have enough crash history to reveal crash patterns. In these cases, a systemic analysis would be a good alternative to pursue (see Step 2). A systemic analysis identifies low-cost and widely applicable treatments that can be applied across the road network (not only at “high crash” locations) to reduce crash frequency and/or severity.
After crash and field conditions have been studied, the next step is to identify potential countermeasures to address the identified safety concerns. A countermeasure is a strategy or action implemented to reduce the frequency or severity of crashes at a site. Countermeasures can be implemented at the specific site or implemented at multiple locations based on needs, budgets, and local priorities. Note that often (and in this Toolkit) the terms countermeasures and treatments are used interchangeably.
Example of a Countermeasure: Installation of chevrons along a horizontal curve is a countermeasure that is proven to reduce the likelihood of road departure crashes.
To identify countermeasures, the practitioner must understand the factors that contribute to crashes at the site (see the previous section) and link them to countermeasures designed to address the factors. Collaboration among road owners, stakeholders, and other safety partners in the countermeasure identification process can result in more comprehensive and effective multidisciplinary safety solutions and lessen the likelihood of “second guessing” after countermeasures are implemented.
Countermeasures can be identified by:
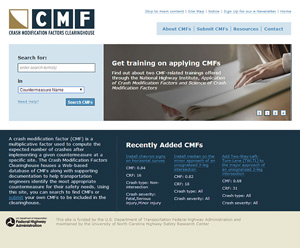
The FHWA Crash Modification Factor (CMF) Clearinghouse is one of the most current tools available for identifying, selecting, and prioritizing countermeasures. The Crash Modification Factors (CMF) Clearinghouse serves as a central on-line repository of CMFs. The CMF Clearinghouse defines a crash modification factor as: “a multiplicative factor used to compute the expected number of crashes after implementing a given countermeasure at a specific site.”
Users are able to query the Clearinghouse database to identify treatments and the associated CMF. For each CMF, the database provides users with published information, such as how it was developed, the research quality behind the CMF, and a link to the publication from which the CMF was extracted. Based on this, users are able to determine the most applicable CMF for their condition.
The clearinghouse is updated regularly to incorporate the latest safety research. The CMF Clearinghouse also reports which CMFs are included in the Highway Safety Manual; these CMFs typically have a higher quality rating given the strict HSM inclusion criteria.
Figure 16 shows an example of a CMF look-up from the clearinghouse for lane departure crashes.
Figure 16. Example of CMF Look-up
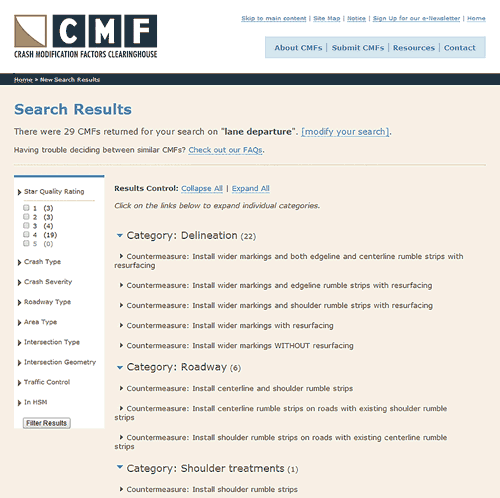
Source: CMF Clearinghouse.
Crash Modification Factors: What Are They?
A CMF is a factor used to compute the number of crashes expected after implementing a given countermeasure. The CMF is multiplied by the expected crash frequency without treatment. A CMF greater than 1.0 indicates an expected increase in crashes, while a value less than 1.0 indicates an expected reduction in crashes.
For example: a CMF of 0.8 indicates an expected safety benefit; specifically, a 20 percent reduction in crashes. A CMF of 1.2 indicates an expected degradation in safety; specifically, a 20 percent expected increase in crashes.
Multiple countermeasures: CMFs for several countermeasures can be multiplied to reflect the application of multiple safety countermeasures applied at the same location.
Crash Reduction Factors (CRF) are equal to 100% × (1-CMF).
Where do I find CMFs? – see the FHWA CMF clearinghouse web site.
When selecting treatments and applying the CMFs from the Clearinghouse or from any other resource, be aware that a single countermeasure may have more than one CMF associated with it. Practitioners should look for treatments that have similar characteristics as their location(s).
When a safety countermeasure is applied at a given site, consider the potential interactions of the treatment with other site conditions to limit the likelihood of unintended consequences. For example, if a lane is widened, drivers may feel they can drive faster due to the perception of improved safety of a wider roadway.
The Oregon Department of Transportation provides a useful set of instructions on how to query and interpret the information in the CMF Clearinghouse.
Countermeasures can sometimes be determined based only on the location characteristics of the crashes of concern. For example, common crash countermeasures have been determined for roadway features such as intersections and curves. FHWA, the National Cooperative Highway Research Program (NCHRP), and others, have developed guidebooks practitioners can use to identify appropriate countermeasures for specific location types. This approach to selecting countermeasures is useful because it can provide guidance when little data are available. A few example resources are:
The resources section for this step describes these in more detail.
Using location characteristics to identify potential countermeasures is appropriate when limited data are available. For example, to improve the safety of a horizontal curve with no formal data, the practitioner should consider application of rumble strips and additional signage as these countermeasures typically reduce crashes on horizontal curves.
Practitioners also can take advantage of “best practices” which are known to be widely applicable to many situations and to provide increased safety when installed properly. For example, if safety analysis shows that a particular site has experienced a series of road departure crashes, the agency may consider installing rumble strips or stripes which are known to reduce road departure crashes on two-lane roadways. Countermeasures can be applied to a single location, multiple locations, or across en entire network depending on need, budget, and local priorities.
In January 2012, the FHWA advanced a list of nine countermeasures that have been proven to improve safety but are not yet widely implemented. This set of proven countermeasures includes:
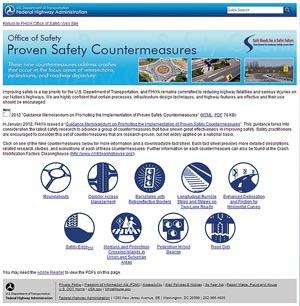
Source: FHWA Proven Safety Countermeasures.
This one-day workshop was developed by the FHWA. The workshop promotes the development of a safety culture by showing participants how construction and maintenance activities impact safety. Module 4 of the workshop is the “reading the road” section which provides information for site diagnosis. The workshop is offered through state LTAP and Regional TTAP Centers.
The AASHTO Highway Safety Manual was published in 2010. The HSM’s Volume 1, Chapter 5 describes field assessments and provides examples of considerations during a site review. Appendix 5D provides a field review checklist for segments, signalized intersections, and unsignalized intersections. Volume 2, Part C presents the predictive method.
The FHWA provides information about RSAs on their web site. The site provides information about:
The site also provides comments on the effectiveness of the RSA as a tool by traffic safety professionals, and directs viewers to additional RSA training and resources. The FHWA compiles a periodic RSA newsletter that provides practitioners with the most current information on RSAs.
Source: FHWA.
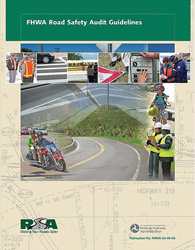
This publication presents background information on RSAs, the steps in the RSA process, and the RSA tools. The background chapters introduce the RSA concept to beginning practitioners, and describe issues that should be considered prior to RSA implementation, such as project selection, and costs and benefits. The publication details an eight-step process to conducting an RSA.
The document also includes several tools to assist in the data collection process for RSAs, including various “Prompt Lists” to identify all of the elements that should be examined on a set of road plans or in the field.
The manual is FHWA Report Number: FHWA-SA-06-06. The document also can be ordered in hard copy at the FHWA report center.
Source: FHWA.
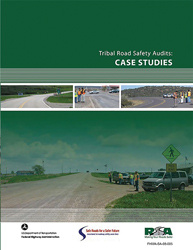
This document was published in 2008 and provides background information on the RSA process and the implementation of this process specifically on Tribal lands. Based on four case studies, the document summarizes key factors and lessons learned in conducting a successful RSA on Tribal lands. Detailed cases study background information, safety issues, and findings are provided in the document’s appendix.
The manual is FHWA Report Number: FHWA-SA-08-005. The document also can be ordered in hard copy at the FHWA report center.
Source: FHWA.
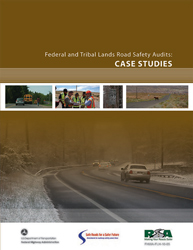
The FHWA published this document in 2009, targeting Federal Land Management Agencies (FLMA) and Tribal agencies that want to implement RSAs. The document provides background on the RSA process and conducting RSAs on Federal and Tribal lands. It provides six Federal and Tribal lands RSA case studies and two additional RSAs on Federal lands conducted by the Western and Eastern Federal Lands Division Offices. Each case study includes photographs, a project description, a summary of key findings, and lessons learned.
The manual is FHWA Report Number: FHWA-FLH-10-05. The document also can be ordered in hard copy at the FHWA report center.
Source: FHWA.
This document demonstrates how RSAs can be used to improve the safety performance of local rural roads. It includes 12 RSA case studies focused on county roads, township roads, intersections, and railroad crossings. For each case study, the document includes photographs, project descriptions, summary of key findings, lessons learned, and the follow-up actions that were taken to improve safety. The document’s appendices provide detailed case study information and a safety issues review list for practitioners to consider when doing a road safety field review.
The document is available at the LTAP web site.
Source: FHWA.
The manual, published in 2010, describes the overall Highway Safety Improvement Program (HSIP) and provides a roadway safety management process that emphasizes a data-driven, strategic approach to safety infrastructure decisions. Chapter 3 of the manual provides a discussion on countermeasure identification using crash data.
The manual is FHWA Report Number: FHWA-SA-09-029. The document also can be ordered in hard copy at the FHWA report center.
Source: Florida Department of Transportation.
The Florida Manual on Uniform Traffic Studies (MUTS) is designed to establish minimum standards for conducting traffic engineering studies on roads under the jurisdiction of the Florida Department of Transportation. The electronic version of this manual provides a series of PDF files which address the various steps of completing safety studies. It also includes blank forms for the collection of field data, and instructions on how to develop a collision diagram, condition diagram, and other studies. Chapter 6 of the manual provides an example of a collision diagram and a crash summary that represent the different types of crashes at a particular intersection.
Chapter 5: Diagnosis provides information reviewing safety data to identify patterns in crash types, severities, environmental conditions, and crash locations.
The HSM is available to order at the AASHTO bookstore (ISBN Number: 1-56051-477-0).
Source: CMF Clearinghouse.
The Crash Modification Factors (CMF) Clearinghouse serves as a central on-line repository of CMFs. Users are able to query the Clearinghouse database to identify treatments and the associated CMF. For each CMF, the database provides users with published information, such as how it was developed, the research quality behind the CMF, and a link to the publication from which the CMF was extracted. Based on this, users are able to determine the most applicable CMF for their condition.
The clearinghouse is updated regularly to incorporate the latest safety research. The CMF Clearinghouse also reports which CMFs are included in the Highway Safety Manual; these CMFs typically have a higher quality rating given the strict HSM inclusion criteria.
Related to the Clearinghouse, the Oregon Department has a useful additional discussion of how to query and interpret the information in the CMF Clearinghouse.
Source: FHWA.
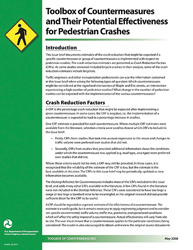
This toolbox provides users with crash reduction effectiveness information for three types of pedestrian safety countermeasures – signalization (i.e., pedestrian signal phasing), geometric (i.e., pedestrian overpass or raised median), and operational (i.e., signs and markings). For each countermeasure, the toolbox provides Crash Reduction Factors (CRF). Note that a CMF is equal to 1-CRF. For example, if the CRF is equal to 35 percent, the CMF is equal to (1-0.35) or 0.65.
The document is FHWA Report Number: FHWA-SA-014. The document also can be ordered in hard copy at the FHWA report center.
Source: FHWA.
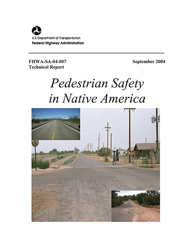
This FHWA report analyzed data from multiple national sources to typify crash patterns among Native American communities. The report provides countermeasures, including education-based, media-based, and law enforcement-based interventions as well as child education and pedestrian facility improvements. The report also provides four successful Tribal safety intervention programs and their crash reductions after implementation.
The report is FHWA Report Number: FHWA-SA-04-007. The document also can be ordered in hard copy at the FHWA report center.
The NCHRP 500 Reports are publications that help local practitioners reduce injuries and fatalities in targeted areas. Each publication addresses a specific type of crash or contributing factor:
The publications classify each strategy as proven, tried, or experimental based on: 1) whether the strategy has been applied in multiple locations; and 2) whether the evaluations proving the strategy’s effectiveness are properly designed. The publications also provide links to information on agencies or organizations currently implementing the strategy. Note that since publication of this document, the classification of some countermeasures may have changed from “experimental” to “tried,” or from “tried”” to “proven” based on research that has been completed.
The reports can be ordered in hard copy at the TRB Book Store. Book Code: NR500A (for Volume 01) to NR500Y (for Volume 23).
The FHWA produced this guide to aid local agency practitioners and maintenance staff in ensuring that their agency’s signs are maintained to meet road user needs. Section 8 of the guide can be useful for maintenance staff conducting routine investigations. It discusses inspection methods and offers maintenance staff a sign inspection checklist.
The manual is FHWA Report Number: FHWA-SA-09-025.
The FHWA produced this guide in 2008 to assist local agency maintenance staff with identifying locations where vegetation control can be improved to enhance traffic and pedestrian safety. This document provides staff with specific items to check, and safe ways to mow, cut brush, and control roadside vegetation.
The manual is FHWA Report Number: FHWA-SA-07-018.
The FHWA produced this guide in 2009 to help local maintenance staff understand the importance of maintaining and upgrading drainage features on their road system and the potential impacts to road safety. The document guides staff to recognize drainage problems and how to correct drainage features.
The manual is FHWA Report Number: FHWA-SA-09-024.
The MUTCD defines the standards used by road managers nationwide to install and maintain traffic control devices on all public streets, highways, bikeways, and private roads open to public traffic. The MUTCD has been administered since 1971, and updated periodically to address changing transportation needs and new safety technologies and management techniques. The most current edition of the MUTCD is from 2009, with additional revisions made in 2012.
The manual also can be purchased from AASHTO.
The FHWA produced this guide in 2008 to provide practitioners with up-to-date information on how to repair W-Beam guardrails. Chapter 2 of the manual offers guidance on identifying the extent of guardrail damage to assess its continued safety performance.
The manual is FHWA Report Number: FHWA-SA-08-002.
Chapter 4 of this manual provides countermeasures and specifies the intersection types where each countermeasure is effective.
The manual is FHWA Report Number: FHWA-SA-11-08.
Source: National Cooperative Highway Research Program.
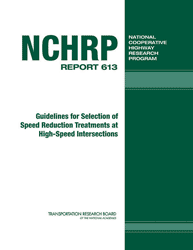
This report details how practitioners could evaluate and select speed reduction treatments for intersections with approach speeds of 45 miles per hour or greater. Section 2.2 of the report presents a summary of various speed reduction treatments, and Section 3.6 walks users through a step-by-step process of using intersection information (i.e., roadway features and speed data) to select the appropriate treatments to achieve speed reduction objectives.
This manual can be downloaded from the TRB web site or can be ordered in hard copy at their Book Store. Book Code: NR613.
Source: FHWA.
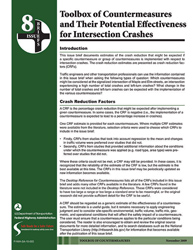
This FHWA brief provides practitioners with information for considering the most effective countermeasures for a particular intersection. The document presents the estimated crash reduction factors (CRF) with countermeasure implementation. This information is organized by three categories of countermeasures – signalization, left turn, and operational.
The toolbox is FHWA Report Number: FHWA-SA-10-005.
Source: FHWA.
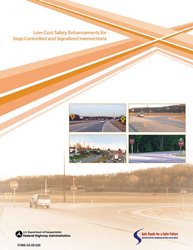
This report provides information about low-cost countermeasures for crash problems at various intersection types such as stop-controlled, signalized, and poorly lit intersections. For each countermeasure, the document provides an estimated crash reduction factor, the typical crash threshold for using the countermeasure, any additional implementation factors, and the typical range of implementation cost.
The report is FHWA Report Number: FHWA-SA-09-020. The toolkit also can be ordered in hard copy at the FHWA report center.
Source: FHWA.
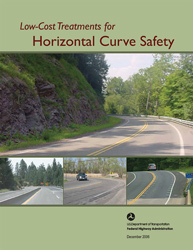
Published in 2006, this guide provides practical information on low-cost treatments for safety issues in horizontal curves. The publication describes each treatment; shows examples; suggests when the treatment might be applicable; provides design features; and where available, provides information on the potential safety effectiveness and costs.
The report is FHWA Report Number: FHWA-SA-07-002.
Source: FHWA.
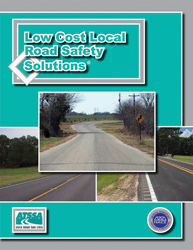
This ATSSA publication provides users with information on 16 proven low-cost countermeasures, focusing on traffic control devices such as signing and pavement marking. For each countermeasure, the publication gives users an overview of the countermeasure, its crash reduction effectiveness, and the relevant reference and countermeasure applications that prove the countermeasure’s effectiveness.
This report can be downloaded from the FHWA Intersection Resource Library. To order hard copies of Low Cost Local Road Safety Solutions, email Trish Hall or call (877) 642-4637, ext. 135.
Source: FHWA.
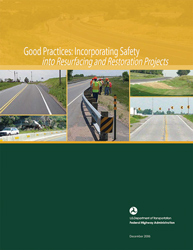
This FHWA reports provides users guidance on how to make sure safety improvements are included in resurfacing and restoration projects. The document identifies a set of common issues and common success factors in agencies across six states.
The report is FHWA Report Number: FHWA-SA-07-001. The toolkit also can be ordered in hard copy at the FHWA report center.
This manual was developed by the FHWA to provide local practitioners with information to identify locations with historical or potential rural roadway departure crashes, and countermeasures to address these locations. Chapter 4 of the manual provides effective countermeasures on different roadway types based on best practice.
This manual is FHWA Report Number: FHWA-SA-11-09. The toolkit also can be ordered in hard copy at the FHWA report center.
You may need Adobe® Reader® to view the PDFs on this page.
| < Previous | Table of Contents | Next > |

