U.S. Department of Transportation
Federal Highway Administration
1200 New Jersey Avenue, SE
Washington, DC 20590
202-366-4000
Sign up to have Safety Compass delivered right to your inbox!

Best for printing: PDF Version (2.6 MB)
To view PDF files, you can use the Acrobat® Reader®.
In this issue:
A Message from the FHWA Associate Administrator for Safety, Cheryl Walker
What's New?
State Departments of Transportation Put Pedestrian Safety into Context
Considerations for Developing a Local Safety Policy or Program
Data and Analysis
Update of Pedestrian and Bicycle Crash Analysis Tools
Data Visualization in Safety Transportation Planning
Model Inventory of Roadway Elements Fundamental Data Elements …the Clock Is Ticking
Safety-Driven Changes and Improvements
Funding Tribal Road Safety with the Transportation Program Safety Fund
Safety Data Business Plans: Technical Assistance to Enhance Safety Data
Fremont's Successful Midsize City Vision Zero Approach
Making Roads Safer for First Responders
Median Cable Rails Preventing Cross-Median Crashes in Montana
Learning Together
A Bonner County Participant Shares His Perspective on the Rural Road Departure Peer Exchange
2019 Montana Department of Transportation Annual Transportation Safety Meeting
Stakeholder Workshop Results on Automated Vehicles, Safety, and Human Factors
Announcements
New Railway Safety Noteworthy Practices Available!
New Lane Departure Countermeasure Outreach Resources Available!

The United States Department of Transportation (USDOT) defines a safety culture as the shared values, actions, and behaviors that demonstrate a commitment to safety over competing goals and demands. How do we build a safety culture in our organizations, families, and society?
We do it by truly making safety our top priority. Consensus among safety experts is that a safety culture exists in different forms in the transportation industry. Two forms that resonate the most with transportation organizations are an organizational safety culture and a public safety culture.
The strength of an organization's safety culture is reflected by the extent to which safety is valued and pursued by the organization. The organization is aware of potential hazards in its work environment and is prepared to react to incidents as needed. And importantly, agency staff have safety in mind when planning, scoping, designing, and constructing a roadway. In these types of organizations, employees regularly communicate the importance of safety with colleagues, customers, and contractors - and executive leaders are vocal supporters of safety.
States or communities with a strong public safety culture have citizens who understand the risks associated with transportation and who choose to make safe choices when using their transportation system. Drivers in a community with a strong safety culture are likely to wear their seat belts and safety gear voluntarily, obey traffic laws, limit distractions, and refrain from operating a vehicle when impaired; cyclists wear helmets and reflective gear; and pedestrians stay alert to their surroundings.
These actions are reflective of a safety culture, and a strong safety culture saves lives.
When I am driving north on I-395 into Washington, DC, on my usual commute to USDOT, I think of everyone traveling northbound toward the district as one big team traveling together—a team with the common goal of getting to our destination safely. Ideally, none of our "teammates" would make bad decisions such as speeding or sudden lane changes that endanger other team members. But if I do witness this kind of behavior, I understand that honking at that other driver, or otherwise expressing frustration, won't keep the team safer and might even cause more of a danger to everyone.
This team-based approach is a key part of developing an effective safety culture. I encourage you to be an advocate for effective safety culture in your organization and community. Communicate regularly on safety with your staff and other stakeholders. Even if safety is not explicitly part of everyone's job title, empower all employees to improve safety. Encourage your friends, neighbors, and family members to drive, bike, and walk with care. Because we are all in this together.
By: Rebecca Crowe, FHWA Office of Safety
Maryland Department of Transportation's Context-Driven Guide
When the Maryland Department of Transportation (MDOT) State Highway Administration (SHA) released its new roadway design guide, Context Driven Access & Mobility for All Users, in 2019, MDOT Secretary Gregory Slater said, "The issue of pedestrian safety requires bold action." The guide begins by summarizing the increasing pedestrian fatalities in the State (which have risen more than 46 percent of total fatalities between 2009 and 2018) and the relationship between roadway speed and severity of pedestrian crashes.
The MDOT SHA guide describes six new context zones and how each relates to multimodal travel, such as pedestrian activity. The context zones are based, in part, on national guidance such as the most-recent edition of the American Association of State Highway Transportation Officials (AASHTO) Green Book, including zone categories for urban core, suburban activity center, and rural.
"The issue of pedestrian safety requires bold action."
– Gregory Slater, MDOT secretary
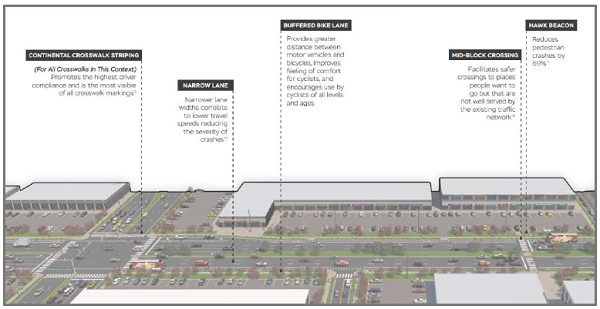
The guide also shows, using strong visuals, how the FHWA Safe Transportation for Every Pedestrian (STEP) countermeasures can be integrated into each design context. For example, the suburban activity center zone shows how the pedestrian hybrid beacon (or HAWK beacon) can improve safety at midblock crossings along busy arterials. The guide also references STEP countermeasure tech sheets and other FHWA resources for designing multimodal transportation systems.
MDOT SHA Design Engineer-Cost Estimator Jeff Davis said, "Addressing pedestrian safety through the lens of context provides a means to proactively implement treatments in areas that have traditionally shown a higher propensity for pedestrian crashes. This allows us to get out ahead of the problems, rather than solely reacting to issues as they arise."
Georgia Department of Transportation's Pedestrian and Streetscape Guide
The Georgia Department of Transportation (GDOT) updated its Pedestrian and Streetscape Guide to better integrate pedestrian safety into street design, specifically highlighting STEP countermeasures. Compared with previous versions, the updated guide includes several new graphics to illustrate how streetscape design and pedestrian crossings apply beyond the urban Atlanta context.
The guide also includes a midblock pedestrian crossing evaluation process to help engineers and planners consider crosswalk placement and additional safety countermeasures. The crossing evaluation references FHWA's Guide for Improving Pedestrian Safety at Uncontrolled Crossing Locations and provides screening questions to help the decision maker collect relevant data.
Oregon Department of Transportation's Blueprint for Urban Design
Similar to Maryland and Georgia, the Oregon Department of Transportation (ODOT) created new guidance based on more diverse sets of roadway contexts reflecting land use and the relationship between speed and safety. Oregon's Blueprint for Urban Design explains and compares trade-offs between operations, safety, and design for urban roadway projects.
The blueprint also provides target spacing for crosswalks per each of the six urban contexts. The spacing targets consider roadway elements such as intersection spacing and transit stops. For example, it suggests crosswalks should be spaced 500–1,000 feet apart along commercial corridors. The blueprint also promotes using design speed when selecting STEP pedestrian safety treatments, such as raised medians, curb extensions, and road diets.
If you would like to learn how your agency can improve pedestrian safety with STEP, contact Becky Crowe with FHWA's Office of Safety at Rebecca.Crowe@dot.gov or Peter Eun with the FHWA Resource Center at Peter.Eun@dot.gov.
By: Karen Scurry and Rosemarie Anderson, FHWA Office of Safety
More States are partnering with local agencies to address local road safety, which is critical to achieving our vision of zero fatalities on the nation's roads. We can get to zero fatalities, one community at a time, through partnership with strategic stakeholders.
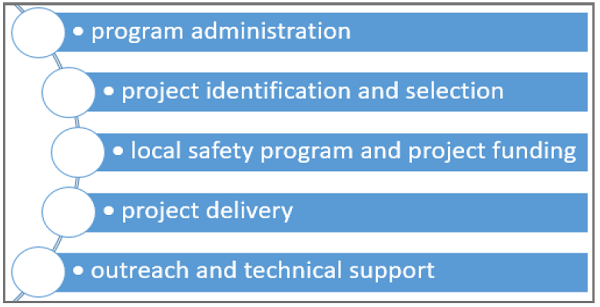
To help achieve this vision, the FHWA developed the Framework for Local Safety Policies and Programs, a guide States can use to establish a framework for developing or updating their local road safety programs or policies. The guide includes examples of policies and programs that can be adapted from other States to improve local road safety. The guide also provides considerations and examples in each the following areas: program administration, project identification and selection, local safety program and project funding, project delivery, and outreach and technical support.
Successful local road safety programs and policies require strong leadership support from State partners. State departments of transportation (DOT) are in a position to provide relevant guidance, training, and technical assistance to local agencies to ensure they are developing and delivering the best projects to save lives and prevent serious injuries on local roads. The Framework for Local Road Safety Programs and Policies demonstrates opportunities to update your local safety policies or programs. If you are just getting started, the guide outlines various approaches to consider as you develop your local road safety policies or programs. The guide also presents an array of approaches States have taken to incorporate local road safety in an overall State safety program. A single approach will not fit all situations, so find an approach that might work best in your State, discuss it among State and local partners, and adapt it to best meet your needs. Local agencies must also be willing to put in the work to identify local safety champions; coordinate with relevant safety stakeholders; and plan, develop, and implement local safety programs and projects.
We encourage you to review the framework for local road safety programs and policies and consider implementing the appropriate approaches that will improve safety on your local roads. Together, we can achieve our vision of zero fatalities on our nation's roads—one community at a time.
For additional information about local road safety programs or policies, contact Karen Scurry, Highway Safety Improvement Program (HSIP) program manager, at (202) 897-7168, Karen.scurry@dot.gov, or Rosemarie Anderson, local and rural roads program manager, at (202) 366-5007, Rosemarie.anderson@dot.gov.
By: Esther Strawder, FHWA Office of Safety, and Frank Gross, VHB
The AASHTO Highway Safety Manual (HSM) describes a method for predicting crashes among road users on various facility types. While the premise of the predictive method is relatively straightforward (i.e., input traffic volume and roadway characteristics in an equation to estimate crashes by type and severity), practitioners must educate themselves regarding the terminology and nuances to properly apply the predictive method. For example, the following are common questions posed by highway safety professionals:
To answer these, and other safety analysis questions, FHWA developed a series of brief (10–15 minute) safety data and analysis training videos:
The following is an overview of each video.
The Predictive Method
This video describes the use of the predictive method in quantifying the safety performance of existing and proposed designs. The video explains how to define the study location and period of interest; what data are needed to apply the method; how to select and apply safety performance functions (SPF), adjustment factors, and calibration factors; and how to use the Empirical Bayes (EB) method.
Observed, Predicted, and Expected Crashes
This video covers three approaches for quantifying safety performance. The video defines the three approaches, describes the strengths and limitations, explains how to select an appropriate approach, and illustrates the use of the approaches in estimating safety performance for a given facility.
Application of CMFs
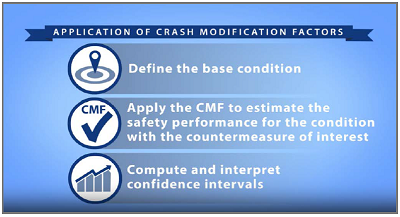
This video describes the process of applying CMFs to estimate countermeasure effectiveness, assuming the viewer is familiar with selecting an appropriate CMFs and estimating the safety performance of the base condition. As shown in the image above, the video explains how to define the base condition, how to apply CMFs, and how to compute and interpret the confidence interval.
Selecting a Method to Analyze Multiple CMFs
This video is the first of a two-part series on estimating the combined effect of multiple countermeasures. The video explains how to select an appropriate method based on the scenario of interest, the limits of the combined effect, the potential for overlapping effects among countermeasures, and the magnitude of countermeasure effects.
Applying a Method to Analyze Multiple CMFs
This video is the second of a two-part series on estimating the combined effect of multiple countermeasures. The video explains how to apply the additive, multiplicative, dominant effect, and dominant common residuals methods. It also explains how to address scenarios where the CMFs apply to the same or different crash types and severities.
The self-paced videos allow you to learn at your own speed. You can pause the videos to work through example problems and skip ahead to specific sections of interest. You can also return at any time for a refresher. Each video concludes with a link to an HSM resource web page for further details and readings on the topics. Given the focused content and flexibility in reviewing the content, it's not surprising that these videos have received more than 1,700 views.
For more information on the technical content in the training videos, contact Esther Strawder at Esther.strawder@dot.gov or Karen Scurry at karen.scurry@dot.gov.
By: Patrick Hasson and Adam Larsen, FHWA


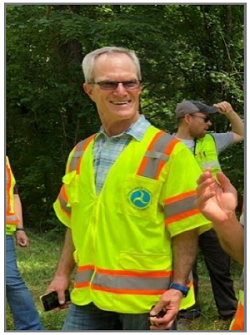
The safety discipline award is an annual award recognizing individuals for their leadership and accomplishments. In 2019, three individuals were awarded two Field Safety Leadership Peer Awards and the Howard Anderson Lifetime Achievement Award.
Field Safety Leadership Peer Awards
Peter Eun and Rick Drumm were recognized with FHWA Field Safety Leadership Peer Awards for demonstrating leadership and accomplishments in highway safety. These leaders were nominated by their peers for contributions to FHWA and its partners, and, ultimately, for reducing fatalities and serious injuries on our roads.
Peter Eun is a member of the safety and design team of the FHWA Resource Center. He uses creative tactics to inspire people throughout the country to take action to reduce pedestrian fatalities and serious injuries. Peter has mentored many of his peers to become better presenters and advocates for non-motorized transportation safety, and has provided outstanding instruction, leadership, and partnership above and beyond the requirements of his position.
Rick Drumm from FHWA's Indiana division is a longtime safety champion, engaging both State and local safety stakeholders. Recently, Rick began assisting local agencies in the development of local road safety plans. Several national efforts have benefited from Rick's active participation and leadership, including the HSIP steering committee. Rick hosted the first-ever traffic safety bowl at the 2019 national safety engineer peer exchange. Rick is passionate about safety and well respected by both his safety partners in Indiana and his peers across FHWA.
Howard Anderson Lifetime Achievement Award
In 1974, Howard Anderson was named the first FHWA associate administrator for safety. In honor of his contributions to our agency, the Howard Anderson Lifetime Achievement Award was established in 2014 to recognize current FHWA employees who exemplify outstanding and significant service to the safety discipline over their careers. Nominees are evaluated for continuous efforts to champion safety both internally and externally to FHWA.
Greg Schertz was awarded the Howard Anderson Lifetime Achievement Award for his leadership in advancing FHWA's safety mission and for his efforts over the years to save lives across the country. His career at FHWA is a remarkable testament to dedication and commitment to safety. His accomplishments continue to be reflected in many of our current programs and initiatives. Road safety audits, roadway departure countermeasures, and retroreflectivity have all benefited from his involvement. Many current leaders in these areas have been influenced by his previous work, as well as his current support and advice. His commitment to the success of others is exhibited in many ways, most notably through his mentoring activities. As a master instructor for the National Highway Institute, he has shared his commitment to excellence with professionals in and out of the safety discipline. Likewise, in his current role as the Federal Lands safety functional discipline leader, his passion for safety is infectious, as evidenced in the great work being accomplished by those he works with and leads. We cannot thank him enough for this support.
For more information about the awards, contact Patrick Hasson at patrick.hasson@dot.gov.
By: Tamara Redmon, FHWA Office of Safety
FHWA is in the process of updating the Pedestrian and Bicycle Crash Analysis Tool (PBCAT) for the first time in more than a decade. PBCAT is crash-typing software that assists practitioners with improving pedestrian and bicycle safety through a database that contains details of crashes between motor vehicles and pedestrians or bicyclists. The original version of PBCAT was made available in 1999 and was last updated in 2006.
Traditional crash data provide the where, when, and who facts about pedestrian and bicyclist crashes. However, crash data often lack information about the sequence of events and causes leading up to a crash, which is important for selecting safety countermeasures to prevent future crashes. PBCAT provides this information through crash typing, which describes the pre-crash actions of the parties involved. The current software can be used to type crashes and append the information to an agency's existing database, or develop a stand-alone pedestrian and bicyclist crash database. With the database, analysts can identify crash types that are prevalent systemwide or at specific locations and use the information to select the most effective countermeasures to address the problems. Crash types in the current PBCAT can also be linked to crash types in PEDSAFE and BIKESAFE.
As part of the PBCAT update, the contract team contacted State and local agencies to discover how PBCAT is currently used and how it might be used in the future. Below is a summary of current uses identified in that feedback process.
Arizona
Arizona Department of Transportation sponsored statewide pedestrian and bicycle safety action plans that identified prevalent crash types by location to help prioritize appropriate safety improvements on the State-owned network.
Florida
The University of Florida used PBCAT-derived crash-type logic to develop a crash analysis tool to type and analyze pedestrian and bicyclist crashes. The tool is embedded in the State's data system, Signal Four Analytics. Authorized users can easily access the crash report for typing their jurisdiction's pedestrian and bicyclist crashes, and crash-type variables are automatically linked to other variables in the database. Broward County, Florida; St. Petersburg, Florida; and the Orlando metropolitan region are among jurisdictions that have used the tool. A demonstration can be viewed in a webinar that FHWA hosted in April 2018.
Delaware
The Delaware Valley Regional Planning Commission conducted a large pedestrian crash study on a 4-mile stretch of Philadelphia's North Broad Street, the pedestrian crash epicenter of Pennsylvania. Using the tool, the study identified a type of crash and a time of day that were highly over-represented, which led to identifying a very specific countermeasure for those crashes.
Colorado
The City of Boulder exports PBCAT data into a geographic information system (GIS) accident database to link crash typing, traffic control, and facility type data with standardized data captured on Colorado State accident reports. After data are linked, the records are exported to a spreadsheet and then imported into a statistical software platform to conduct cross-tabulations. Key findings are produced in a technical memorandum or final report. Jurisdictions use the findings to support site-specific safety improvements as well as policy changes that can be applied, systemwide, to locations that share similar issues.
North Carolina
The University of North Carolina Highway Safety Research Center developed multiyear, crash-typed, geocoded pedestrian and bicycle crash databases. The data are used to analyze local and statewide safety problems, including through online query tools and model analysis reports, and aid in the State's process of prioritizing safety projects. An interactive map with downloadable spatial pedestrian and bicycle crash data can be viewed online.
What's Next?
To gather deeper insights about how to make the tool most useful to States and local jurisdictions, an in-person stakeholder meeting was convened in December 2019. The meeting included State, local, and Federal experts on crash typing, as well as crash data collection and analysis to solve safety problems. The contract team is currently updating the crash-typing decision logic and variable definitions according to stakeholder input.
Planned improvements include enabling users to develop crash-type variables for crashes involving micromobility modes and motor vehicles. Other goals are to reduce confusion about crash types by creating a coding framework that will develop a unique crash type for each crash, and to reduce the number of distinct crash types to make it easier to identify treatable patterns. As part of the strategy, a related goal is to align crash type inputs with the crash reporting elements recommended by the Model Minimum Uniform Crash Criteria (MMUCC), to the extent possible. This strategy should make it easier for more States to develop crash types for vulnerable road users.
A draft version of the new logic will be produced by the project end date of May 2020. It is envisioned that States will test the crash-typing logic before it is finalized. Stakeholders have advocated for a browser-based tool that will not be limited by users' computer operating systems. Subsequent efforts will consider updating the software by implementing the revised logic and graphic updates.
For more information, contact Tamara Redmon at tamara.redmon@dot.gov.
By: Chimai Ngo, FHWA, Subasish Das, TTI, and Eric Tang, VHB
If you work in planning processes, you understand the significant role of data in these processes. Data allow planners to develop goals, objectives, performance measures, and targets, and to prioritize programs and projects. Collecting and analyzing accurate data are the initial steps in the right direction. But how do we communicate the data to identify where and what the needs are? Visualizing through mapping opens a door to a host of possibilities, as it tells stories more effectively than other types of communication. This article presents several examples of transportation agencies using mapping to communicate information for transportation safety planning purposes.
Mapping for Public Involvement Process in Idaho
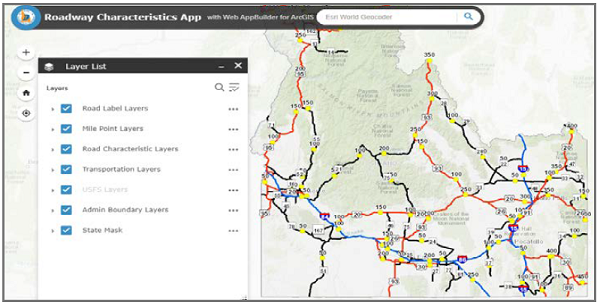
In an effort to communicate with transportation stakeholders and the public, the Idaho Transportation Department (ITD) uses StoryMaps. This tool allows ITD to combine project maps with narrative text, images, and multimedia to communicate with stakeholders and the public about project planning activities.
ITD uses StoryMaps for long-range, corridor, and modal project outreach efforts. These maps can display safety issues along a corridor and allow users to understand issues in relation to other transportation needs in a specific corridor.
ITD created a series of interactive web-based applications using StoryMaps to support data visualization. For example, the Highway Safety Corridor Analysis app incorporated several drop-down panels and hovering and zooming options. The app allowed users to weigh in on proposed safety improvements. Other ITD web-based StoryMap apps focused on many aspects such as crashes, transportation investments, roadway characteristics, intelligent transportation system devices, and construction locations.
A key advantage of these online GIS tools is that users do not need to have any GIS or coding experience.
StoryMaps are available on the IPlan site, a collaborative site used by ITD to collect and distribute information on the system network.
For more information, contact Sonna Lynn Fernandez at Sonnalynn.fernandez@itd.idaho.gov or (208) 334-8209.
Quick and Easy Crash Data Visualization in New Jersey
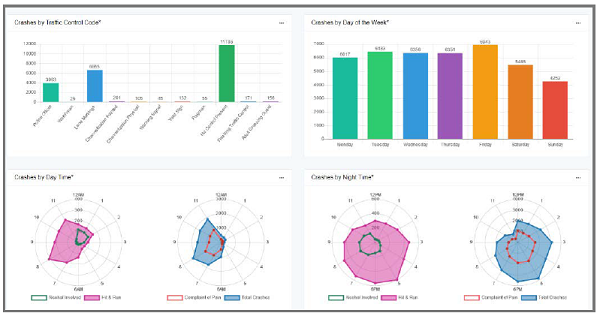
The New Jersey Department of Transportation's (NJDOT) data-driven software tool, Safety Voyager, provides a quick and easy visual perspective of crash data in a map-based interface. Safety Voyager can quickly show a comparative 2D or 3D view of crashes in a defined area, municipality, or county.
Safety Voyager updates crash data biweekly and ensures that users have access to the most current data available. The tool's interactive visualization platform provides end users a reactive impression to help them cut through the clutter of complex data dynamics. This tool has the following functions:
NJDOT regularly updates and enhances Safety Voyager with new features based on user feedback. The application was recently updated with a pedestrian and cyclist heat map. Tutorials (e.g., crash map tutorial, emphasis areas tutorial) are also regularly uploaded to improve usability.
For more information, contact Chris Zajac at chris.zajac@dot.nj.gov or (609) 963-1893.
Metro Map for Equity
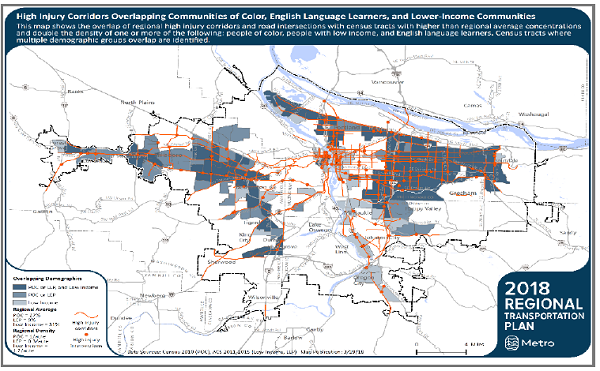
Oregon Metro (Metro), the metropolitan planning organization (MPO) for the greater Portland area in Oregon, focused on ways to address disparities and improve racial and social equity in the implementation of Vision Zero projects in the region. Metro identified equity focus areas within the region to provide a framework for evaluating where transportation safety projects could be prioritized to reduce disparities for three demographic groups (which are not mutually exclusive): people of color, people with lower income, and people with limited English proficiency.
Metro found that a majority of high-injury corridors are in communities with higher concentrations of these three demographic groups, and mapped this overlap as part of its regional transportation plan update. Regional high-injury corridors are stretches of roadways in the Portland metropolitan area where the highest concentrations of serious crashes involving a motor vehicle occur on the regional transportation network. Regional high-injury intersections are roadway intersections with the highest concentration of fatal and serious crashes. The regional high-injury corridors and intersections are identified to help prioritize near-term safety investments. Metro will update these corridors and intersections approximately every 5 years. In the interim, other safety investments may be identified that warrant priority based on other data and analysis.
For more information, contact Lake Strongheart McTighe at Lake.McTighe@oregonmetro.gov or (503) 797-1660.
By: Robert Pollack, FHWA Office of Safety
The clock is ticking for States to meet the Fixing America's Surface Transportation (FAST) Act requirement to have access to the Model Inventory of Roadway Elements (MIRE) Fundamental Data Elements (FDE) for all public roads. On March 5, 2020, FHWA Office of Safety conducted a public webinar to convey information about MIRE FDEs, States' progress in acquiring MIRE FDEs, and outreach activities to help the States.
Background
The two most recent transportation reauthorization acts (Moving Ahead for Progress in the 21st Century Act and FAST Act) identified required capabilities State data systems must have to support States' HSIPs. The acts specify the type of roadways covered, the type of data to be collected, the ability to geolocate data to a common basemap, and that State data systems adopt and use a subset of MIRE data elements—referred to as FDEs—to improve data collection and ensure a data-driven safety management process for States' HSIPs. Through a rulemaking process, FHWA identified 37 MIRE FDEs that States are required to have access to, for all public roads, by September 30, 2026.
MIRE FDEs
The overriding focus in establishing MIRE FDEs is to provide States with roadway characteristic and traffic volume data elements that, when integrated with crash data, enable sufficient data analysis to identify safety problems and make effective safety investment decisions. The MIRE FDE data set enables States to analyze crash experience on their roads and identify the expected average crash frequency, given the roadway and traffic characteristics at each location.
MIRE FDEs are organized into three categories: non-local paved roads, local paved roads, and unpaved roads. Non-local paved road elements are further subcategorized by data elements for road segments, intersections, and interchanges. A list of MIRE FDEs by category can be found in tables 1–3 in FHWA's Guidance on State Safety Data Systems.
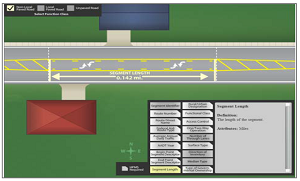
To help State DOTs and other safety data practitioners (e.g., cities, counties, MPOs, Tribes, and researchers) better understand the structure and measurement of MIRE FDEs, the Office of Safety created an interactive MIRE FDEs graphic. The graphic provides an interactive display of each MIRE FDE's definition, attributes, and sample data likely be collected.
MIRE FDE Status within States
In 2017, States were required to develop and submit by September 2026 strategies for how they would access MIRE FDEs on all public roads. These strategies are to be incorporated into the State's Traffic Records Strategic Plan, such as:
The quality of these strategies varied greatly among States' Traffic Records Strategic Plans. Submitting this information was a one-time effort, with no requirement for follow-up or updates.
Another measurement of MIRE FDE status is through annual reporting of MIRE FDE completion percentages. States are required to include their estimated completion rates for each MIRE FDE as part of their annual HSIP evaluation report. FHWA's Office of Safety has shared a template with States to assist in this reporting.
States have been reporting their MIRE FDE completion status since 2017, and the Office of Safety now has 3 years of compiled reporting. In addition, the Office of Safety has added a graphic that displays the change in MIRE FDE collection between the two most recent reporting years (e.g., 2018 and 2019).
The Office of Safety is currently participating in a joint project with the National Highway Traffic Safety Administration's (NHTSA) National Driver Register and Traffic Records Division to map the MIRE FDEs. The MIRE FDE mapping process is similar to a MMUCC mapping process that NHTSA has previously performed with the MMUCC crash data elements.
In the MIRE FDE mapping process, a database format is created for each MIRE FDE element in the NHTSA Traffic Records Improvement Program Reporting System 2 (TRIPRS2) database. Using the MIRE FDE format, State roadway data dictionaries determine if the State database contains the MIRE FDE element and attributes in the exact MIRE format, or if the element and attributes could be derived from other elements in the State's roadway inventory database. This process enables the Office of Safety to develop a report indicating if the State's roadway inventory database contains all required MIRE FDEs and attributes. FHWA expects to complete the MIRE FDE mapping process for all States by April 2020.
MIRE FDE Outreach
The Office of Safety will distribute its findings from both the MIRE FDE completion status report and the mapping results to State FHWA division offices, and ask division offices to share the information with State DOT points of contact for MIRE FDE collection/maintenance.
We ask that State DOT's assess the information and let the Office of Safety know if they concur with the findings. States are encouraged to discuss the findings with the Office of Safety, their progress in acquiring the MIRE FDEs for all public roads, and what successes or difficulties they are encountering. The Office of Safety is committing future resources to help States meet the MIRE FDE requirement, and the information obtained through this outreach process will help direct those resources in the most beneficial and effective manner possible.
For more information, contact Robert Pollack at Robert.pollack@dot.gov or (202) 366-5019.
By: Adam Larsen, FHWA Office of Safety
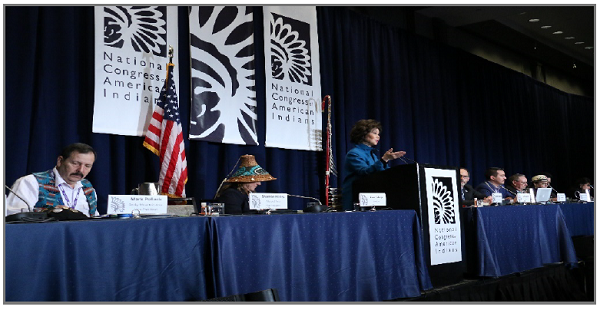
On Tuesday, February 11, 2020, U.S. Secretary of Transportation Elaine L. Chao announced during remarks at the National Congress of American Indians that more than $8.9 million in grants will be awarded to 80 Federally recognized American Indian Tribal Nations. These grants come from the Tribal Transportation Program Safety Fund (TTPSF), which received 159 applications totaling $38.5 million in fiscal year 2019. The 91 projects awarded represent the sixth round of TTPSF, which started in 2013 and, so far, has distributed more than $60 million to Tribal governments.
With Secretary Chao's recent announcement, more than 61 percent of the 573 Federally recognized Tribes in the United States have received funding to develop a transportation safety plan. Many of the transportation safety plans have been completed and are more than 3 years old with updates underway. These data-driven plans are a major part of the safety decision-making process used to identify safety projects and communicate the Tribes' transportation safety priorities with other governments, including the FHWA's TTPSF. In addition to driving TTPSF investments, these safety plans have led Tribal governments to work with States to build safety improvements using funds from the HSIP.
Tribes are using the TTPSF, the overall transportation program shares, and partnerships with States and others to improve transportation safety and reduce the more than 500 fatal crashes reported in Tribal areas every year. Projects funded by TTPSF fall into four categories: safety planning, data collection and analysis, behavioral safety projects, and infrastructure funding.
Data collection and analysis projects have included road safety audits, systemic safety studies, and improvements to crash data collection systems. FHWA and NHTSA have partnered on a project to develop a Tribal crash reporting toolkit. Currently in a pilot phase, the project is expected to be completed by fall 2020 and will include a self-assessment tool, a fillable PDF crash report, a database to compile crash reports, quality control guidance, documentation on common misconceptions related to crash data collection, and a guide introducing concepts in safety data analysis.
Behavioral grants for projects related to emergency medical services, enforcement, and education were eligible under the MAP-21 Act. This eligibility did not continue under the FAST Act. Behavioral grants issued under MAP-21 comprise 9 percent of the total awards issued from TTPSF. A related effort funded by the Indian Health Services (IHS) is the Tribal Injury Prevention Resource Center to assist and train Tribal employees in deploying car seat checkpoints, data surveillance, and other injury prevention topics. Funding is available to address some behavioral safety topics through the Bureau of Indian Affairs Indian Highway Safety Program, which distributes funding from NHTSA under 23 U.S.C. § 402.
A wide variety of infrastructure improvement projects have been funded by the largest category (75 percent) of TTPSF funding. In addition to intersection improvements, pedestrian facilities, and roadway departure strategies, TTPSF has also addressed some unique challenges such as monitoring the safety of ice roads in Alaska.
The Tribal Transportation Program Coordinating Committee (TTPCC) recently met with FHWA to discuss progress with TTPSF to address transportation safety in Tribal areas. Comparing the priorities of the Tribal Transportation Strategic Safety Plan to TTPSF expenditures led TTPCC to approve a resolution supporting FHWA's initiative to create a 25 percent set-aside goal to address systemic deployment of roadway departure countermeasures. This will help increase funding of roadway departure countermeasures, which have only comprised 12 percent of TTPSF expenditures, while roadway departure is involved in about 63 percent of fatalities in Tribal areas.
For more information, contact Adam Larsen at adam.larsen@dot.gov.
By: Rosemarie Anderson, FHWA, Bob Scopatz, VHB, and Catherine Chestnutt, VHB
Safety data and data-driven safety analysis can improve decision-making and resource allocation, which aid in reducing fatalities and serious injuries on public roads. Safety data business plans (SDBP) help State DOTs and their partner agencies meet Federal requirements for State safety data systems in support of safety data collection, integration, and analysis. A data governance program addresses data collection, storage, security, inventory, analysis, quality control, reporting, and visualization.
The SDBP synthesizes information to propose high-priority, implementable actions for safety data stakeholders to enhance safety data collection, management, integration, governance, analysis, and performance measurement. Improvements in these areas will result in more efficient business practices, progress toward meeting Federal data requirements, and better highway safety analysis.
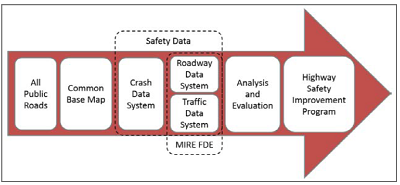
The SDBP is structured to represent key data components of a successful State safety data system, as shown in the schematic graphic.
Technology and data infrastructure and data governance are represented as loops encompassing all other data management areas, with governance the outermost loop. This schematic view reflects the relationships among all areas of a State safety data system.
The FHWA Office of Safety offers technical assistance to agencies working to implement an SDBP. The technical assistance includes:
Developing an SDBP has the following benefits:
The graphic below shows the focus on three core safety data systems—crash, roadway, and traffic volume—and how their integration is essential to the HSIP.
Seeking Agency Participation
FHWA seeks opportunities to work closely with State, planning, Tribal, and local agencies to improve safety data management and governance. Direct technical assistance is offered to help States create the data resources and data management processes required by the FAST Act and State safety data systems guidance. The SDBP technical assistance program will help agencies produce a fully implementable plan by integrating the areas in a coordinated fashion. States are invited to request technical assistance in developing their own SDBP. To request assistance, State DOTs and partnering agencies should:
If interested, contact Rosemarie Anderson at rosemarie.anderson@dot.gov or (202) 366-5007.
By: Matthew Bomberg, City of Fremont
Fremont, California, with a population of 235,000, is at the northern end of the land of early adopters, Silicon Valley. Matching the ambition of Silicon Valley, this midsized suburban city in the San Francisco Bay Area adopted a Vision Zero traffic safety policy in 2015 and developed an action plan in early 2016, making it the seventh city nationwide (and first midsize city) with a Vision Zero action plan. Fremont's approach to Vision Zero has been opportunistic and proactive, building on ambitious general plan policies to create complete streets and reduce vehicle miles traveled. Implementation includes systemic deployment of proven countermeasures and leveraging partnerships to extend the impact of city staff and funding resources. Fremont's approach to Vision Zero has enabled it to successfully reduce major crashes (severe injuries and fatalities) by more than 30 percent since adopting its Vision Zero policy, even as major crashes have increased in the Bay Area, the State, and nationwide.
Systemic Deployment of Proven Countermeasures
Rather than consider countermeasures after sufficient collision history has accrued, Fremont has sought to proactively implement a series of proven countermeasures. Proactive implementation involves targeting citywide locations where infrastructure characteristics suggest there is risk of a crash that the countermeasure is designed to mitigate, or where collision data suggest a crash type is overrepresented.
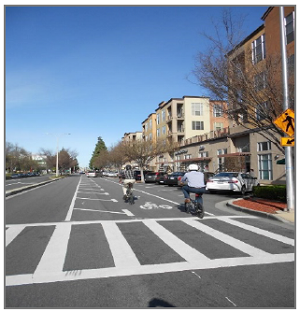
One example of systemic implementation of a proven countermeasure is a citywide LED streetlighting upgrade project. The city's review of major crash data suggested that low lighting contributed to more than half of crashes. Based on this finding, the city accelerated an initiative to convert all 16,000 streetlights from yellow sodium vapor to white LED. The citywide retrofit was expedited by bonding against future operating expense savings from more energy-efficient lighting. Another example is a citywide traffic signal upgrade to include pedestrian countdown signals. The city's review of police reports from the 3 years prior to adopting a Vision Zero policy identified several crashes involving seniors struck and killed in signalized crosswalks on major arterials, possibly because they were unaware of available crossing time. In response, the city installed pedestrian countdown signals at all traffic signals citywide, an increase from 50 to 220 locations.
Fremont has also changed its roadway striping standards to a safe and complete street design standard, based on guidance from the National Association of City Transportation Officials (NACTO). A key feature of Fremont's new striping standard is adopting travel lane widths of 10 feet on major arterials to manage speeds, create additional width for buffering, and protect vulnerable road users. The city now implements this standard as part of all roadway restriping after pavement maintenance. In addition, the city completed a project to remove existing striping and restripe 9 miles of arterial roadways identified as safety priority streets. Because these streets would not be resurfaced for more than 5 years, they were upgraded to safe and complete striping standards in advance of normal pavement maintenance. The city has now restriped with 10-foot travel lanes more than 50 miles of arterial roadways and buffered bike lanes. Recent speed surveys indicate the city will be able to reduce the posted speed limit on more than 30 street segments due to lower 85th percentile operating speeds.
Finally, Fremont has worked to enhance all marked, uncontrolled crosswalks of major arterials with high-visibility crosswalks, advance yield lines, and in-pavement yield to pedestrian signs. To realize immediate benefit, the city has sought quick striping upgrades in advance of more permanent upgrades, such as additional lighting, rectangular rapid flashing beacons (RRFB), and pedestrian hybrid beacons (PHB). With promising results, the city has also experimented with flexible delineators and in-pavement yield markers on lane lines between through lanes approaching uncontrolled crosswalks to increase conspicuity of crossings and physically prohibit multiple threat crashes.
Leveraging Partnerships
Fremont leverages partnerships between city departments and with external organizations to extend the impact of city funding and staff resources. Fremont's Vision Zero program has primarily been implemented by the city's Public Works Department, but has also been supported through a strong partnership with the police department and city manager's office. The city manager's office has supported Vision Zero by contributing to communications efforts such as citywide newsletters mailed to residents, social media communications, and outreach at community events. Similarly, the police department has been an invaluable partner in data sharing and enforcement, including:
Fremont's ability to rapidly implement traffic safety improvements has been significantly expanded by the support of street maintenance crews that implement quick-build projects. Street maintenance crews have quickly implemented numerous safety projects consisting of signage, striping, and flexible delineator improvements. They also provide valuable suggestions on emerging materials and products that enhance project designs.
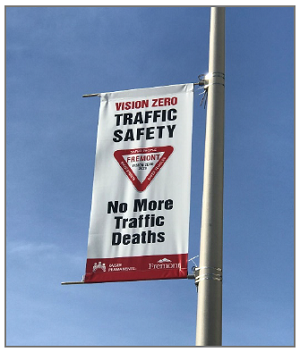
A strong nexus exists between public health and traffic safety, and Fremont has successfully pursued a partnership with Kaiser Permanente, which operates one of two large hospitals in the city. Kaiser's support for Vision Zero in Fremont includes installing a new midblock crossing with an RRFB and funding a Vision Zero street banner campaign with educational messaging.
Fremont has also engaged the city's Youth Service Corps—high school student summer volunteers—in supporting Vision Zero efforts. Youth Service Corps volunteers have painted "Look for Safety" markings at crosswalks in high-pedestrian activity areas, providing a teaching opportunity for both students and the larger community.
Finally, the city has enjoyed a strong partnership with the Fremont Unified School District. The city and district jointly funded school safety audits at all 42 schools in the city, completed over 2 years. The audits have generated numerous quick-build safety improvements that have also been implemented at all schools over a 2-year period.
Results
Fremont is now 4 years into Vision Zero program implementation. The number of severe and fatal crashes has dropped more than 30 percent—from an average of 35 per year during the 3 years prior to Vision Zero to an average of 23 per year during the 4 years after. The city has seen a drop in major crashes for all travel modes, as well as a decline in major crashes after dark and major crashes involving DUI.
For more information on Fremont's Vision Zero program, contact Matthew Bomberg at mbomberg@fremont.gov.
By: Paul Jodoin and James Austrich, FHWA
Traffic incidents such as crashes, debris, and stalled vehicles can cause 50 percent, or more, of regional delays. But most importantly, they put motorist and responder lives at risk.
Thousands of motorists are killed or injured each year in the wake of a primary crash. In 2019, 44 responders were killed while working roadway incidents—up from 17 in 2018. Since January 2020, 11 responders have been struck and killed by errant motorists.
In response, FHWA offers traffic incident management (TIM) training for responders and municipal and State stakeholders, with cooperation from partners in all States, Washington, DC, and Puerto Rico. TIM training is available and recommended for the first-responder community to improve safe, efficient, and quick clearance of incidents and to reduce secondary crashes. At a local level, TIM education and strategies are key to improving safety for all first responders essential to road response, including:
For more information, contact Paul Jodoin at paul.jodoin@dot.gov or James Austrich at james.austrich@dot.gov.
By: Gabe Priebe, Montana Department of Transportation
If you've driven between Laurel and Billings, or west of Missoula, in the last few years, you may have noticed a series of cables supported by metal posts in the median of Interstate 90. These cables and posts are known as median cable rails and are becoming a cost-effective way to prevent cross-median crashes on high-speed divided highways. A cross-median crash occurs when a vehicle leaves the roadway to the left and completely traverses the median, ending up in the opposing lanes of traffic. This type of crash often results in fatal or serious injuries.
Montana Department of Transportation (MDT) recently completed a cable median barrier study to explore further use of this treatment on Montana's interstate system. The study explored other national and State studies and practices. The study found that median cable rail is a cost-effective way to greatly reduce cross-median crashes. The crash data for the run of rail between Billings and Laurel also pointed to a significant reduction (almost 90 percent) in this type of crash. This treatment isn't without limitations; proper median widths, adequate slopes, and sufficient space for the cable to deflect after being struck are all important considerations. The study's recommendations helped MDT initiate several project nominations in the Butte, Bozeman, Missoula, and Helena areas.
For more information, contact Gabe Priebe at (406) 444-9252 or gpriebe@mt.gov.
By: Steve Klatt, Bonner County
I recently returned from a FHWA-sponsored peer exchange on reducing rural road departures in Phoenix, where I represented Idaho's local jurisdictions. I was flattered by the invitation to attend, and I felt a responsibility to present a perspective for the many locals with far less funding than Bonner County. Turned out I was the only local among seven western States and Federal highway safety administrators—somewhat a fish out of water.
The grim nationwide statistics for rural road departures are eye opening—30 people die each day on rural roads, and 14 of those die on a local rural road. These numbers are so disconcerting that FHWA has made efforts to initiate Local Road Safety Plans (LRSP) in all 50 States, and Idaho's turn is coming very soon. Bonner County has been offered the opportunity to help develop a pilot project model safety plan for reference to other Idaho local jurisdictions. FHWA and the Local Highway Technical Assistance Council (LHTAC) are teaming up to present workshops on the nuts, bolts, and benefits for local jurisdictions to consider when developing our own local plans. I encourage us all to consider making the effort.
Recently I began to ask myself if we could identify similarities in areas and types of crashes in Bonner County where safety can be improved with simple, cost-effective treatments. As crash data and road structure similarities are compiled, the framework of an LRSP is consequently created. After spending a day and a half with highway safety pros, I recognize I had begun to think of initiating a systemic approach to countermeasures that could be wrapped into a cost-effective bundle.
It was a genuinely interesting challenge to get the State and FHWA safety professionals to understand how difficult it is to secure basic funding for our local roads—let alone find time and money for safety countermeasures. Without continually sounding like an old curmudgeon, I strove to convey the need to create new funding mechanisms that reach locals more directly, without all the Federal strings and guidelines attached. I came away from the peer exchange convinced there are countermeasures we can initiate locally to improve our rural road safety.
For more information, contact Steve Klatt at steve.klatt@bonnercountyid.gov.
By: Cathy Satterfield and Dick Albin, FHWA Office of Safety
No program embraces small innovative steps to manage America's highway infrastructure with more vigor than the FHWA's Every Day Counts (EDC) initiative. EDC is the front line of innovation in project delivery, operation, stewardship, and safety of the nation's highway system. In the fifth round of EDC, the Focus on Reducing Rural Roadway Departures (FoRRRwD) initiative challenges State and local agencies to save lives.
Nearly 12,000 people die every year in a roadway departure crash on a rural highway. That's 30 people today, and every day. These account for one-third of all crashes, even though less than one-fifth of the U.S. population lives in rural areas. We can do more to save the people behind those numbers!
FoRRRwD is built on four pillars:
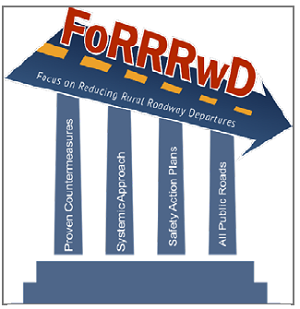
To assist States and other transportation agencies in deploying these strategies, FHWA is hosting a series of peer exchanges that provide a forum for State and local transportation professionals, along with partners from the Local Technical Assistance Program (LTAP) Centers, to share ideas and noteworthy practices. So far, in 2020, three exchanges have taken place: one in New Orleans, Louisiana; Phoenix, Arizona; and Concord, New Hampshire. In each case, agency decision makers spent a day and a half discussing their experiences and innovations, asking questions, and troubleshooting challenges together.
Each peer exchange included discussions on each of the four pillars, and led the agencies in attendance to walk away with some action items. Key takeaways from these exchanges include:
Decreasing roadway departure crashes is a team effort, and peer exchanges such as these bring people together to collaboratively ensure we are moving forward together.
To learn more about FoRRRwD, check out our informational video released late last year. For more information, contact Cathy Satterfield at cathy.satterfield@dot.gov.
By: Pam Langve-Davis, Montana Department of Transportation
More than 100 people attended the 12th annual Transportation Safety meeting, held October 30–31, in Helena. Attendees included representatives of the 4E's of transportation: education, enforcement, emergency response, and engineering.
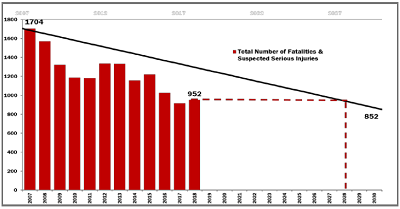
MDT Director Mike Tooley opened the meeting by talking about breaking down barriers, solutions to overcoming hurdles, and MDT's progress on reducing fatalities and suspected serious injuries on Montana roadways. The Comprehensive Highway Safety Plan (CHSP) interim goal is to halve fatalities and suspected serious injuries from 1,704, in 2007, to 852 by 2030. In 2018, Montana experienced 951 fatalities and serious injuries on its roadways. Director Tooley also called for Montana's support for the AASHTO aggressive goal to reach zero deaths by 2040.
Guest speaker Professor Nicholas J. Ward, director of the Center for Health and Safety Culture at Montana State University, spoke on psychological reactance and moral disengagement. He explained how psychological resistance to being told what to do triggers defense mechanisms and leads to disregarded normal reasoning. This often results in assigning blame to others and creating negative outcomes for others. By understanding these influences, communications can be developed to reach those who have previously been resistant to traffic safety messaging.
Three emphasis areas reported on successes and challenges. The roadway departure and intersection crashes emphasis area champion provided a NHTSA program update, and highlighted the increase of certified child passenger seat technicians as a result of statewide training efforts by coordinators of Buckle Up Montana. The 2019 annual seat belt observation survey also showed increased use, with 89 percent seat belt use on all roads.
The impaired-driving emphasis area champion facilitated a panel discussion regarding the challenges of DUIs and the criminal justice system. The panel included Traffic Safety Resource Prosecutor Chad Parker, Traffic Safety Resource Officer Doug Samuelson, and Judge Greg Mohr. Panel discussion included an overview of law enforcement training programs to identify alcohol- and drug-impaired drivers, and training for judges and prosecutors on DUI law and impaired-driver detection.
The consensus among participants was that enhancing public education and awareness is crucial in promoting change and shifting how people perceive appropriate driving behavior. Always wearing seat belts, understanding what constitutes impairment and deciding not to drive, following traffic control, and not speeding are the most important behavioral changes to help us reach zero deaths and serious injuries.
For more information, contact Pam Langve-Davis at (406) 444-7646 or plangvedavis@mt.gov, or visit the Vision Zero CHSP website at https://www.mdt.mt.gov/visionzero/plans/chsp.shtml.
By: Laura Mero, FHWA Office of Safety
FHWA is funding a project that investigates issues with automated vehicles (AV), human factors, and infrastructure. The objectives of the project, Investigate Key Automated Vehicle Human Factors Safety Issues Related to Infrastructure, include:
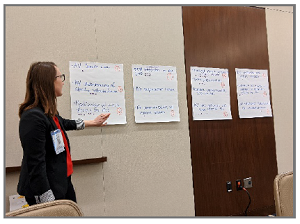
After completing a literature review and gap analysis, the research team conducted an in-person stakeholder workshop to develop a list of prioritized research topics. The workshop was designed to facilitate discussion of major issues and challenges facing Level 2 and Level 3 AVs operating on and with roadway infrastructure. The research team maximized participation by strategically holding the workshop on the morning of January 16, 2020—the last day of the annual American meeting of the Transportation Research Board (TRB)—at the Marriott Marquis in Washington, DC, which was convenient for stakeholder attendees. Project funds were allocated to assist some participants in traveling to the workshop. Additionally, the research team created a list of questions to facilitate a small group activity during the workshop to encourage participants to share ideas.
Eighteen stakeholders with relevant expertise representing State DOTs, universities, national organizations, private consultants, and FHWA attended. The agenda began with a brief welcome from FHWA, introductions, a presentation from the research team, and an opportunity for participants to share information on related projects. Participants then engaged in the small group activity.
During the 55-minute activity, attendees were encouraged to consider three major challenge areas identified in the literature review and gap analysis, physical infrastructure, traffic control devices, and transportation systems. Following the small group activity, each group reported out, then participated in a large group discussion involving all attendees. Participants then agreed on a consolidated list of 13 research topics and voted on the three they thought were most important to address. Topics that received fewer, or zero, votes were not considered unimportant; rather, they were already being researched or considered less urgent for near-term study. The results generated the following prioritized list that will guide the design of four project experiments:
For more information, contact Laura Mero at (202) 493-3377 or laura.mero@dot.gov.
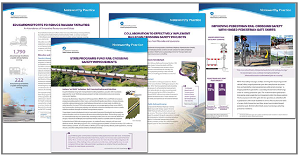
A new suite of railway safety Noteworthy Practices is now available! Everything from innovative treatments to creative outreach strategies is presented, and each practice has been entered into the Noteworthy Practices database. Learn more about how partnerships and collaboration can lead to project success, why out-of-the-box thinking can lead to increased funding, and how targeted outreach can reduce railway fatalities. The four new Noteworthy Practices include:
Visit the FHWA Office of Safety's Railway-Highway Crossings Program website at https://safety.fhwa.dot.gov/hsip/xings for more information and resources, including FHWA and Federal Railroad Administration (FRA) joint webinars and the Highway-Rail Crossing Handbook, Third Edition.
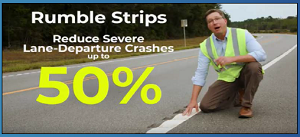
Are you looking for resources to help you explain the value of lane departure countermeasures to your leadership or the public? If so, check out these two new resources: Rumble Strips: The Sweet Sound of Safety and Curve Warning Signs Save Lives.
Contact Cathy Satterfield at cathy.satterfield@dot.gov for more information!
is a publication of the U.S. Department of Transportation, Federal Highway Administration.
The Federal Highway Administration publishes the Safety Compass newsletter three times a year. We can be reached at:
FHWA Office of Safety
1200 New Jersey Ave. SE
Room E71-320
Washington, DC 20590
The Safety Compass is available online at the FHWA Office of Safety web site at: https://safety.fhwa.dot.gov/newsletter/safetycompass/.
We welcome your comments and highway safety-related articles. The purpose of this newsletter is to increase highway safety awareness and information and to provide resources to help save lives.
We encourage readers to submit highway safety articles that might be of value to the highway safety community. Send your comments, questions and articles for review electronically to Tara McLoughlin at: tara.mcloughlin@dot.gov
